
August 5, 2026
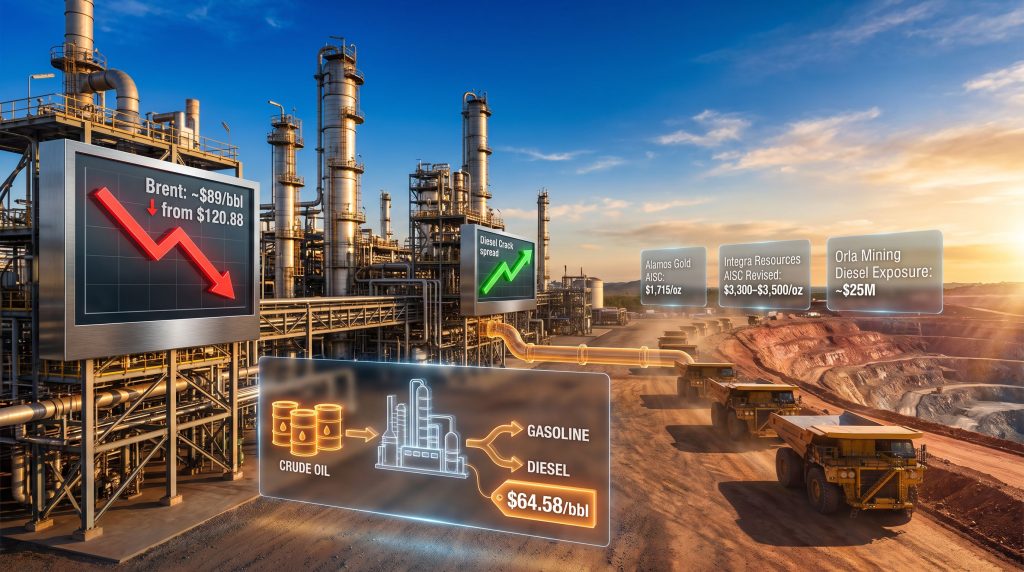
The Metric That Mining Cost Models Have Been Getting Wrong
For decades, mining analysts have treated Brent crude as a reliable proxy for operational fuel costs. The logic was straightforward: diesel prices and crude prices moved together closely enough that a falling oil price meant falling mine-site energy bills. That relationship has broken down in 2026, and the divergence is now flowing directly into reported all-in sustaining costs, guidance revisions, and margin compression across the sector.
The fundamental error in Brent-indexed cost models is that they measure the wrong variable. Mining operations purchase refined diesel fuel, not crude oil. When the gap between crude input costs and refined product prices expands — which is precisely what happens during periods of refinery constraint — the crude price becomes an unreliable predictor of what mines actually pay at the pump.
Understanding why diesel crack spreads and mining costs have become inseparable in the current cycle requires stepping back from crude price charts and examining the mechanics of fuel production itself.
When big ASX news breaks, our subscribers know first
Understanding the Structural Shift: From Crude Prices to Refining Margins
What Is a Diesel Crack Spread and Why Does It Matter for Mining Operations?
A diesel crack spread measures the theoretical gross margin a refinery generates by converting crude oil into refined transport fuels. The widely referenced NYMEX 3-2-1 crack spread models the economics of processing three barrels of crude into two barrels of gasoline and one barrel of distillate fuel. When this spread widens, the signal it sends is not about crude scarcity but about refining capacity becoming the market's binding constraint.
The step-by-step mechanics work as follows:
- Input: Three barrels of crude oil enter a refinery
- Output: Two barrels of gasoline plus one barrel of distillate (diesel or heating oil)
- Spread Calculation: The combined market value of those refined products minus the crude input cost
- Signal: A widening spread indicates refining bottlenecks rather than upstream supply shortfalls
- Mining Relevance: Mines pay delivered diesel prices, which reflect both crude costs and refining margins simultaneously
Key Insight: Because mining operations purchase diesel rather than crude oil, the crack spread is a more direct indicator of mine-site fuel costs than Brent or WTI spot prices. A falling crude price does not automatically translate into lower diesel costs when refining margins are simultaneously expanding.
Brent vs. Diesel: Why the Historical Correlation Has Broken Down in 2026
The scale of the divergence between crude prices and diesel refining margins in 2026 is historically unusual. The prompt NYMEX 3-2-1 crack spread reached a record $64.58 per barrel on July 8, 2026, while Brent crude simultaneously fell more than 26% from its April intraday peak of $120.88 per barrel to settle near $89 per barrel on July 30. Furthermore, understanding the broader crude oil price trends helps contextualise why this divergence is so significant for operational planning.
| Metric | April 2026 Peak | July 30, 2026 | Direction |
|---|---|---|---|
| Brent Crude (intraday high) | $120.88/bbl | ~$89/bbl | ↓ Falling |
| NYMEX 3-2-1 Crack Spread (record) | — | $64.58/bbl (July 8) | ↑ Rising |
| European Diesel Refining Margin | — | >$60/bbl | ↑ Elevated |
| European Gasoline Premium to Crude | — | ~$41/bbl | ↑ 4-year high |
| US Distillate Inventories vs. 5-yr avg | — | ~10% below | ↓ Tight |
Critical Takeaway: Brent fell more than 26% from its April peak, yet diesel refining margins simultaneously hit record highs. Mining cost models indexed to Brent crude therefore systematically understate actual fuel expenditure during periods of refinery constraint.
Major commodity research teams recognised this dynamic explicitly. J.P. Morgan noted that record distillate crack spreads in both the US and Europe confirmed the market was being driven by refining constraints rather than crude supply. Goldman Sachs, in its July 23, 2026 research note, maintained its Q4 2026 Brent forecast at $80 per barrel while simultaneously recommending a long position in the December 2026 to March 2027 European diesel and gasoil timespread as the preferred vehicle for geopolitical risk exposure.
The significance of that positioning cannot be overstated: Goldman effectively signalled that refining margins, not crude prices, would capture the geopolitical premium going forward. According to Forbes reporting on refining stocks, this dynamic drove a significant rally in refinery equities as investors repositioned accordingly.
What Is Causing the Refinery Capacity Crunch?
Three Simultaneous Disruptions Compressing Global Throughput
The IEA reported on July 10, 2026, that global refinery runs rose 1.5 million barrels per day (mb/d) in June but remained 6 mb/d below year-earlier levels. Three concurrent disruptions drove that gap:
- Middle East export refineries: Restart timelines extended well beyond initial projections, with J.P. Morgan's base case assuming only 250,000 b/d of Middle East refining capacity remains shut in by year-end
- Russian throughput constraints: Ongoing operational restrictions resulting from attacks on refining infrastructure limited processing volumes throughout the period
- Asian refinery utilisation decline: Reduced run rates across key Asia-Pacific processing hubs compounded the global shortfall
The critical sequencing issue is that crude supply recovered through the second quarter while conversion capacity did not. This means the crack spread, rather than the crude price, became the operative cost signal.
IEA Refinery Run Forecasts: When Can Mining Companies Expect Cost Relief?
| Period | Global Refinery Run Change | Crude Supply Change | Demand Change |
|---|---|---|---|
| Full Year 2026 | -2.4 mb/d | -3.7 mb/d (avg: 102.6 mb/d) | -1.0 mb/d |
| Full Year 2027 | +3.1 mb/d | +7.5 mb/d (if transit improves) | +2.0 mb/d |
The IEA's forecasts point to a clear conclusion: crude supply is expected to recover considerably faster than refining capacity. That sequencing means diesel crack spreads and mining costs will remain structurally linked well into 2026 and likely through the first half of 2027.
US Refinery Utilisation at 97.2%: The Supply-Inelastic Ceiling
US refineries operated at 97.2% of operable capacity in the week ending July 24, 2026, according to EIA data. Commercial crude inventories simultaneously fell 7.2 million barrels to 404.5 million barrels, approximately 7% below the five-year seasonal average. Distillate inventories remained roughly 10% below their five-year average in the week ending July 17.
With refineries already running at near-maximum throughput, higher diesel prices cannot incentivise additional fuel production. The market has reached a supply-inelastic ceiling where excess demand is absorbed entirely through wider refining margins rather than increased output volumes.
Investor Watch Indicator: The EIA publishes weekly distillate inventory data every Wednesday. With distillate stocks sitting approximately 10% below their five-year average, this weekly release has become one of the most actionable short-term indicators for mining fuel cost trajectory — far more so than daily Brent price movements.
How Elevated Diesel Crack Spreads Are Directly Raising Mining Costs
The Transmission Mechanism: From Refinery Margin to Mine-Site AISC
The pathway from crack spread expansion to reported mining costs operates through multiple channels, several of which are frequently overlooked in standard cost analysis:
- Direct diesel purchases covering haulage trucks, excavators, drill rigs, and ancillary mobile equipment
- On-site power generation at remote mines relying on diesel generators for processing plant electricity
- Contractor cost pass-through as mining service companies reprice contracts to reflect higher fuel inputs
- Consumables and reagents including explosives, tyres, grinding media, and chemical reagents, all of which embed hydrocarbon costs that reprice on independent contract cycles
- Ocean freight for seaborne logistics covering equipment and concentrate shipments, which embed bunker fuel costs
A lesser-appreciated aspect of this transmission is the lag effect embedded in consumables repricing. Ammonium nitrate used in blasting agents tracks energy input costs. Haul truck tyres embed synthetic rubber and manufacturing energy. Grinding media and reagents reflect steel and chemical production energy intensity. Each of these categories reprices on its own contractual cycle rather than moving in real time with crude prices, creating cost pressures that persist even after fuel prices moderate at the pump.
Mining Company Cost Guidance Revisions: Quantifying the Real-World Impact
Q2 2026 results across the gold sector provided concrete evidence of how diesel crack spreads and mining costs interact in practice. Consequently, the relationship between commodity prices and mining margins has rarely been more complex to model accurately.
Alamos Gold (Q2 2026 Results, July 30, 2026)
- Total cash costs rose to $1,304 per ounce
- Mine-site AISC reached $1,715 per ounce
- Key drivers: higher contractor, labour, diesel, and energy costs, partially offset by Canadian dollar weakness
Integra Resources (Florida Canyon 2026 Guidance Revision)
- Previous site-level AISC guidance: $2,750 to $2,950 per ounce
- Revised site-level AISC guidance: $3,300 to $3,500 per ounce (an increase of up to $750 per ounce)
- Production guidance maintained at 70,000 to 75,000 ounces
- Primary drivers: higher diesel fuel and explosive costs
Orla Mining (Disclosed Fuel Price Sensitivity Framework)
- Gross 2026 diesel exposure: approximately $25 million
- Diesel as share of total operating costs: approximately 4%
- Diesel impact on AISC: approximately $70 per ounce
- A $10 per barrel crude price move equates to approximately $2.50 per ounce AISC impact
- A 6% diesel price increase equates to approximately $3.00 per ounce AISC impact
Analytical Note: Orla Mining's disclosed sensitivity framework reveals a structural gap in Brent-indexed analysis. The actual diesel cost impact exceeded what crude price sensitivity alone would have implied, precisely because refining margins amplified delivered fuel costs beyond what a Brent-based model would have predicted.
Energy Intensity Across the Mining Sector: Not All Operations Face Equal Exposure
How Much of Mining Cash Costs Does Energy Actually Represent?
S&P Global data from 2025 reveals that energy cost exposure varies by more than a factor of two across commodity types, yet equity valuations frequently fail to reflect these differences in margin risk:
| Commodity / Mining Type | Energy as % of Total Cash Costs (2025) | Relative Fuel Risk |
|---|---|---|
| Uranium mining | ~9% | Low |
| Underground hard rock (grid-connected) | ~10-12% | Low-Medium |
| Grid-connected processing (hydro-powered) | ~8-11% | Low |
| Copper (treated ore, open-pit) | ~14-16% | Medium-High |
| Gold (open-pit, diesel haulage) | ~19.2% | High |
| Remote diesel-generated operations | >20% | Very High |
S&P Global's copper cost research adds further context. Total cash costs for treated copper ore rose 27.8% between 2021 and 2024, with the 24.2% energy cost increase during 2021 to 2022 contributing the single largest share of that cumulative rise. However, reviewing the broader mining commodity outlook reveals that copper and uranium face quite different energy cost trajectories going forward.
The same research assessed that fuel-dependent producers face meaningful margin compression when crude remains in the $90 to $100 per barrel range for more than six months — a threshold that Brent was sitting just beneath at $89 per barrel on July 30, 2026, even as elevated refining margins kept delivered diesel costs well above what the crude price alone would suggest.
Direct Diesel Exposure vs. Indirect Hydrocarbon Pass-Through
BMO Capital Markets, drawing on Wood Mackenzie data, estimated that diesel accounts for approximately 5% of copper mine operating costs today, down from roughly 8% two decades ago. This decline in the direct share, however, understates total hydrocarbon exposure because energy costs are embedded in:
- Explosives and blasting agents (ammonium nitrate pricing tracks energy inputs directly)
- Haul truck tyres (synthetic rubber and manufacturing energy embedded in unit cost)
- Grinding media and reagents (steel and chemical production energy intensity flows through to per-tonne costs)
- Ocean freight (bunker fuel costs for concentrate shipments repriced on shipping contract cycles)
Which Mining Jurisdictions Face the Greatest Diesel Cost Risk?
S&P Global identified the Democratic Republic of Congo as the most vulnerable major mining jurisdiction. Marginal copper producers in the DRC rely on diesel generators for power and sulfur for acid leaching, creating a dual hydrocarbon dependency that amplifies fuel cost sensitivity relative to grid-connected or hydro-powered peers.
A practical risk hierarchy based on operational characteristics:
- 🔴 Highest risk: Remote open-pit operations with diesel haulage fleets and diesel power generation
- 🟠 High risk: Open-pit operations with grid power but diesel haulage
- 🟡 Medium risk: Underground operations with diesel equipment but grid or hydro power
- 🟢 Lower risk: Grid-connected, hydro-powered processing with electrified or shallow underground operations
What Do Brent Price Forecasts Tell Us — and What Do They Miss?
The Dispersion in Major Bank Brent Forecasts Signals Elevated Uncertainty
| Institution | Q3 2026 Brent Forecast | Q4 2026 Brent Forecast | 2027 Brent Forecast |
|---|---|---|---|
| J.P. Morgan | $86/bbl | $80/bbl | ~$78/bbl |
| Goldman Sachs | — | $80/bbl | $75/bbl (open transit scenario) |
| EIA (July STEO) | $74/bbl | — | $65/bbl |
| Spot (July 30, 2026) | $89/bbl | — | — |
On July 30, spot Brent traded above all three near-term base-case forecasts, indicating the market continued to price a geopolitical risk premium that consensus models had not fully incorporated. Goldman Sachs flagged upside scenarios above $120 per barrel alongside downside scenarios to the low $60s by end-2027 — a range of approximately $60 per barrel that renders point estimates largely unreliable for operational planning purposes.
Why Brent Forecasts Are an Insufficient Framework for Mining Cost Analysis
Even if Brent converges toward the consensus range of $74 to $80 per barrel, mining fuel costs will not necessarily follow proportionally if:
- Refining capacity remains below pre-disruption levels through the recovery period
- Distillate inventories stay 10% or more below five-year seasonal averages
- Middle East refinery restarts are delayed beyond J.P. Morgan's base-case assumption of 250,000 b/d of capacity remaining offline by year-end
The more actionable analytical framework for mining cost assessment is the weekly EIA distillate inventory report relative to its five-year average, not the Brent spot price. This is a subtle but important shift in analytical methodology that many equity models have yet to incorporate.
The next major ASX story will hit our subscribers first
The Refinery Margin Signal in Crude Quality: Why Light Sweet Oil Commands a Premium
How Refinery Constraints Change the Economics of Crude Grade Differentiation
When refining capacity rather than crude availability is the binding market constraint, crude oil quality characteristics become significantly more economically important. Light, sweet crude grades yield a higher proportion of middle distillates and gasoline through straightforward atmospheric distillation, requiring fewer conversion steps than heavy sour grades.
Refineries operating at or near maximum utilisation cannot readily process additional heavy sour barrels through conversion units that are already fully committed, making light sweet crude disproportionately valuable during periods of refinery stress. The simultaneous occurrence of European gasoline trading at a $41 per barrel premium to crude (a four-year high) and diesel refining margins exceeding $60 per barrel confirms that this quality premium has reached a multi-year peak.
A perspective from the oil exploration sector captures the commercial logic well. Scott Lower, President of Dune Oil, which confirmed a 32.4° API gravity light oil discovery with 38 metres of net oil pay at the C-1 well on the M47 exploration block in Turkey, has noted that conventional onshore light oil in highly porous formations represents the most advantageous discovery type available to explorers — precisely because the refining economics are so favourable.
An independent resource evaluation assigned that North Prospect a 2C best-estimate contingent resource of 27.6 million stock tank barrels of light oil and an unrisked NPV-10 of US$733.5 million. It is worth noting that contingent resources are not reserves and require additional appraisal, financing, and development before generating cash flow, with the capital required carrying potential dilution risk for existing shareholders.
The broader industry context is instructive: conventional onshore light oil resources in highly porous formations have become increasingly scarce in mature basins such as North America, pushing exploration activity toward tighter plays that require hydraulic fracturing and carry higher per-barrel extraction costs. In a refinery-constrained environment where light sweet crude commands a structural premium, conventional light oil discoveries in underexplored basins carry amplified strategic value compared to prior market cycles.
Strategic Implications for Mining Investors: Reframing the Cost Analysis Framework
Five Operational Characteristics That Determine Diesel Cost Exposure
When Brent-indexed cost models are structurally unreliable, investors should assess mining operations across five dimensions:
- Mining method: Open-pit haulage operations carry materially higher diesel exposure than underground or in-situ recovery methods
- Power source: Diesel-generated electricity creates dual fuel exposure across both haulage and processing; grid or hydro-connected assets eliminate the processing component entirely
- Disclosed fuel price sensitivity: Companies that quantify fuel cost impacts per barrel of oil price movement allow precise margin modelling; those that do not require broader energy intensity assumptions
- Jurisdictional logistics: Remote operations where fuel delivery reliability is uncertain face a logistics risk premium that extends beyond price risk alone
- Consumables contract cycles: Operations with longer-dated fixed-price contracts for explosives, reagents, and tyres have greater near-term insulation from spot energy price movements
A Scenario Framework for Mining Fuel Cost Trajectory
Scenario A: Rapid Refinery Restart (Bull Case for Mining Costs)
- Middle East and Russian refinery capacity restarts faster than J.P. Morgan's base case
- Distillate inventories recover toward five-year averages by Q4 2026
- Crack spreads narrow to the $25 to $35 per barrel range
- Mining fuel costs decline even if Brent remains near $89 per barrel
Scenario B: Protracted Refinery Constraint (Base Case)
- IEA forecast materialises with refinery runs recovering 3.1 mb/d in 2027
- Crack spreads remain elevated through the first half of 2027
- Mining fuel cost relief delayed until mid-to-late 2027
- Open-pit, diesel-dependent operators continue reporting elevated AISC through the full 2026 reporting cycle
Scenario C: Crude Price Decline with Persistent Refining Constraints (Adverse Case)
- Brent falls toward $65 to $70 per barrel (consistent with the EIA's 2027 base case)
- Crack spreads remain above $40 per barrel due to persistent refinery underutilisation
- Delivered diesel costs decline modestly but remain well above 2023 levels
- Brent-indexed cost models show apparent improvement that materially overstates actual fuel cost relief
The Economic Case for On-Site Power Generation as a Fuel Cost Hedge
Higher diesel prices structurally improve the return on capital for on-site power generation investments by converting a variable fuel cost into a fixed capital expenditure. In addition, the broader case for mining decarbonisation benefits becomes more compelling in precisely this environment, where fuel volatility is directly eroding reported margins.
The hedge is meaningful but bounded:
- Effective for: Processing plant electricity, pumping, ventilation, and other stationary loads
- Less effective for: Mobile haulage fleets requiring liquid fuel that cannot readily electrify at scale in remote environments
- Capital allocation consideration: The payback period for on-site generation shortens as diesel prices rise, but capital requirements compete directly with mine development expenditure
Furthermore, hydrogen-based fuel alternatives are gaining traction as a longer-term solution for reducing diesel dependency in remote mining operations, though widespread commercial adoption remains several years away for most operators.
Disclaimer: This article contains forward-looking statements, forecast data from third-party institutions, and financial analysis that involves inherent uncertainty. Information about contingent resources, production guidance, and cost forecasts should not be relied upon as guarantees of future performance. Investors should conduct independent due diligence before making any investment decisions.
Want to Know Which ASX Miners Are Best Positioned for Rising Fuel Costs?
Discovery Alert's proprietary Discovery IQ model scans ASX announcements in real time, delivering instant alerts on significant mineral discoveries and helping investors identify which operators carry the lowest diesel exposure before the broader market catches on — explore historic discoveries and their returns to see the kind of opportunities that early positioning can unlock, then start your 14-day free trial today.