May 17, 2026
How Mining Production Constraints Shape Long-Term Market Trajectories
The physical extraction of precious metals operates under geological realities that distinguish these markets from renewable commodities. Global gold production reached 3,661 metric tons in 2024, representing output levels consistent with extraction patterns established over recent decades. This stability reflects the finite nature of economically viable deposits and the substantial capital requirements necessary to bring new operations online.
Understanding gold and silver supply and demand drivers requires examining the complex mining permitting process that governs new project development. The fundamental constraint on gold supply expansion stems from genuine scarcity and elevated extraction costs associated with ore processing.
Key Production Statistics:
- Global gold output: 3,661 metric tons annually
- Primary silver mining: 25-30% of total supply
- Byproduct silver production: 70-75% of total supply
- Central bank accumulation: Over 1,000 metric tons for three consecutive years
When spot prices appreciate substantially, mining companies theoretically possess capacity to expand operations. However, meaningful production increases require years to materialise due to permitting timelines, environmental assessments, and infrastructure development requirements.
Silver production exhibits distinctly different structural characteristics compared to gold. According to research from The Silver Institute, approximately 70-75% of silver emerges as a byproduct from copper, lead, and zinc mining operations, while only 25-30% originates from dedicated primary silver mines.
This dependency creates a fundamental disconnect between silver prices and silver supply availability. Consequently, it potentially generates supply-demand imbalances when base metal extraction cycles operate independently of silver market conditions.
Central Banking Influence on Available Supply
Central bank behaviour represents a critical determinant of net supply available to commercial buyers and investors. When monetary authorities engage in gold sales, they increase market supply and typically exert downward pressure on valuations. Conversely, sustained accumulation patterns tighten available supply and provide structural price support.
Recent data demonstrates a significant shift in central bank positioning. Emerging market monetary authorities have driven sustained gold accumulation for three consecutive years exceeding 1,000 metric tons annually. This purchasing pattern reflects strategic reserve diversification efforts away from traditional currency holdings.
Furthermore, this trend fundamentally alters the supply-demand balance compared to historical periods when central banks functioned as net sellers. The geographic concentration of these purchases among emerging market central banks suggests coordinated efforts to reduce dependency on established reserve currencies.
This structural shift creates persistent supply pressure that affects price trajectories across extended time horizons. Moreover, it demonstrates how central banking decisions increasingly influence gold and silver supply and demand drivers in global markets.
When big ASX news breaks, our subscribers know first
Why Silver Demonstrates Superior Volatility Characteristics
Silver's price behaviour exhibits substantially higher volatility compared to gold due to three interconnected structural factors. Market capitalisation differences, industrial demand sensitivity, and the dual nature of silver as both monetary asset and industrial commodity create amplified price movements in both directions.
The total value of investable silver markets represents a fraction of gold's market capitalisation. This size differential means relatively modest capital flows can generate disproportionate percentage price movements. This characteristic becomes particularly pronounced during periods of significant investor interest.
Historical Performance Comparison:
- Gold appreciation (2020): 25.1%
- Silver surge (2020): 47.9%
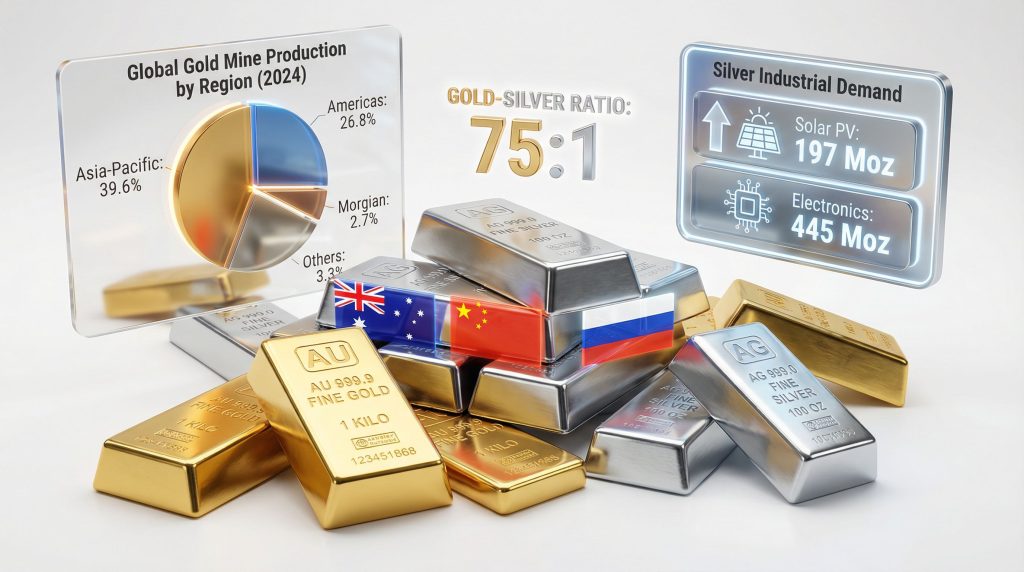
- Gold-silver ratio range (2014-2023): 70:1 to 85:1
- Crisis spike (March 2020): 120:1
Silver's dual demand profile creates unique price dynamics absent in gold markets. Industrial applications now account for more than half of total silver consumption. This makes prices sensitive to global economic activity cycles, manufacturing output levels, and technological adoption rates.
During economic downturns, industrial silver demand can contract sharply. However, investment demand often increases simultaneously due to monetary uncertainty. This creates conflicting price pressures that don't affect gold to the same degree.
The pattern results in silver initially underperforming gold during crisis onset before subsequently outperforming during recovery phases. The 2020 pandemic year demonstrates this mechanism perfectly, with gold gaining 25.1% whilst silver surged 47.9%.
Industrial Demand's Growing Influence on Silver Fundamentals
The transformation of silver's demand profile represents one of the most significant structural changes in precious metals markets over the past decade. Industrial consumption reached a record 680.5 million ounces in 2024, representing approximately 59% of total silver demand.
Industrial Silver Consumption Breakdown:
| Application Category | 2024 Consumption | Percentage of Industrial Total | Decade Growth |
|---|---|---|---|
| Solar Photovoltaic | 197 million oz | 29% | From 11% to 29% |
| Electronics Manufacturing | 445 million oz | 65% | Steady expansion |
| Electric Vehicle Components | 42 million oz | 6% | Emerging sector |
Solar energy applications alone now consume 29% of all industrial silver demand. This represents a dramatic shift from just 11% a decade earlier. This transformation reflects how the global energy transition is fundamentally reshaping silver's demand profile in ways that don't affect gold markets.
As renewable energy installations accelerate worldwide, silver's superior electrical conductivity properties make it irreplaceable in these applications. The structural nature of this demand creates a persistent tailwind for silver that operates independently of monetary factors driving gold prices.
Electronics manufacturing continues to represent the largest single industrial application. It accounts for 65% of industrial silver consumption. Semiconductor production, 5G network infrastructure development, and Internet of Things device proliferation all require silver components.
Electric vehicle production represents an emerging demand category that demonstrates significant growth potential. As automotive electrification accelerates globally, silver content per vehicle increases substantially compared to traditional internal combustion engines.
Monetary Policy Transmission Through Precious Metals Markets
The relationship between monetary policy decisions and precious metals valuations operates through well-established transmission mechanisms. These centre on real interest rates and opportunity cost calculations. When central banks implement expansionary policies, precious metals become more attractive investments due to reduced competition from yield-bearing alternatives.
Real interest rates—nominal rates adjusted for inflation—represent the primary determinant of gold's attractiveness relative to fixed-income investments. During periods when real rates turn negative or approach zero, the opportunity cost of holding non-yielding gold diminishes substantially.
The inverse relationship between real interest rates and gold prices reflects fundamental investment decision-making processes, where investors compare returns from different asset classes after adjusting for inflation risk and currency debasement concerns.
Central bank balance sheet expansion through quantitative easing programs typically supports precious metals prices through multiple channels. Direct monetary expansion increases the supply of base money, potentially weakening currency purchasing power.
The Federal Reserve's policy stance carries particular significance for global precious metals markets due to the dollar's reserve currency status. When Fed policy shifts toward accommodation, international investors often increase precious metals allocations as hedges against potential dollar weakness.
Emergency monetary interventions during financial crises typically generate substantial precious metals demand. The magnitude of policy responses during the 2008 financial crisis and 2020 pandemic created unprecedented monetary expansion that supported precious metals appreciation across extended periods.
These patterns demonstrate how gold record high trends often correlate with expansive monetary policies. Furthermore, understanding these relationships helps explain why precious metals have increasingly attracted institutional attention during periods of monetary uncertainty.
Investment Demand Patterns and Portfolio Allocation Strategies
Institutional and retail investment demand for precious metals exhibits distinct patterns based on investor categories, risk tolerance levels, and portfolio construction approaches. Gold functions primarily as a portfolio stabiliser and hedge against currency debasement. In contrast, silver's dual characteristics create both higher risk and greater upside potential.
The 47.9% silver appreciation versus 25.1% gold gains during 2020 illustrates this risk-return trade-off. Silver's amplified upside comes with correspondingly greater downside volatility during adverse market conditions. This requires investors to match metal selection with risk tolerance and time horizons.
Investment Vehicle Preferences:
- Physical bullion storage for crisis protection
- Exchange-traded funds for liquidity and convenience
- Futures contracts for tactical trading strategies
- Precious metals IRAs for tax-advantaged accumulation
Pension funds and sovereign wealth funds typically favour gold for strategic allocations due to its stability characteristics. These institutions prioritise capital preservation and long-term purchasing power maintenance over maximum growth potential. Consequently, gold's lower volatility profile proves more suitable for their mandates.
Hedge funds and tactical allocation strategies often prefer silver during specific market conditions. This preference stems from silver's higher beta characteristics and technical trading opportunities. Moreover, the gold-silver ratio provides quantitative signals for rotation strategies between metals based on relative value assessments.
Family offices and high-net-worth individuals frequently maintain allocations to both metals. Gold provides portfolio insurance whilst silver offers growth potential. Physical storage considerations, tax implications, and liquidity requirements influence specific allocation decisions within this investor segment.
Retail investor behaviour demonstrates pronounced cyclical patterns. Buying interest typically accelerates during price appreciation phases rather than accumulation periods. This pattern creates feedback loops that can amplify price movements in both directions.
How Market Cycles Affect Precious Metals Demand
Understanding cyclical patterns in gold and silver supply and demand drivers requires examining how different market phases influence investor behaviour. During economic expansions, industrial silver demand typically strengthens whilst investment demand for both metals may moderate.
However, periods of economic uncertainty often trigger significant shifts in allocation patterns. The silver market squeeze phenomenon demonstrates how coordinated retail investor activity can dramatically affect supply-demand dynamics.
Recent market developments have highlighted potential scenarios where precious metals could experience unprecedented price movements. Analysis of gold's 3000 price milestone reveals the confluence of factors that could drive such significant appreciation.
Technical Analysis and Market Timing Indicators
The gold-silver ratio functions as one of the most reliable technical indicators for precious metals market analysis. It provides insights into relative valuation and potential rotation opportunities between metals. Year-end ratio values from 2014 to 2023 ranged between 70:1 and 85:1.
During the March 2020 market crisis, the ratio spiked briefly to approximately 120:1 before recovering sharply as silver prices surged with renewed investment demand. This extreme reading preceded one of silver's strongest performance periods.
Gold-Silver Ratio Analysis:
| Period | Ratio Range | Market Conditions | Interpretation |
|---|---|---|---|
| Normal Markets | 70:1 to 85:1 | Stable conditions | Historical average |
| Crisis Periods | 100:1+ | Market stress | Silver oversold |
| Recovery Phases | Below 70:1 | Risk appetite | Silver outperformance |
Moving average convergences and divergences provide additional technical signals for precious metals trend analysis. The 50-day and 200-day moving averages help identify momentum shifts and trend confirmations. Meanwhile, relative strength indicators measure overbought and oversold conditions.
Volatility measurements help investors assess risk-adjusted returns and position sizing decisions. Silver's higher volatility requires smaller position sizes to achieve equivalent risk profiles compared to gold allocations.
Currency correlation analysis reveals important relationships between precious metals and major currency movements. Dollar index strength or weakness often corresponds to inverse precious metals performance. However, this relationship can break down during periods of systemic stress.
The next major ASX story will hit our subscribers first
Seasonal Demand Cycles and Cultural Influences
Precious metals markets exhibit predictable seasonal demand patterns driven by cultural celebrations, religious festivals, and agricultural cycles in major consuming regions. These patterns create recurring opportunities and challenges for market participants who understand the timing and magnitude of seasonal influences.
Indian gold demand demonstrates pronounced seasonal variation tied to wedding seasons and religious festivals. The traditional wedding season spanning October through February generates substantial jewellery purchases. Additionally, festivals like Diwali and Dhanteras create concentrated buying periods that can affect global gold prices.
Chinese New Year celebrations typically generate increased gold and silver purchases for gift-giving and ceremonial purposes. The lunar calendar timing means these demand spikes occur at different times each year relative to Western calendar dates.
Key Seasonal Demand Periods:
- Indian wedding season: October – February
- Chinese New Year: January – February (variable dates)
- Western holiday seasons: November – December
- Ramadan celebrations: Variable lunar calendar timing
Industrial silver demand exhibits different seasonal patterns tied to manufacturing cycles rather than cultural celebrations. Electronics production often accelerates ahead of major consumer product launches. This creates predictable demand spikes during specific months.
Solar panel installation activity demonstrates weather-dependent seasonality. Peak installation periods occur during favourable weather months in major markets. This creates corresponding silver demand patterns that don't affect gold markets.
Construction industry silver demand follows similar weather-dependent patterns. Electrical infrastructure projects typically concentrate during months with optimal working conditions in major economic regions.
Future Market Drivers and Technological Disruption
The evolution of precious metals demand patterns reflects ongoing technological developments and policy initiatives that will reshape market dynamics over coming decades. Silver's industrial applications continue expanding into emerging technologies. Meanwhile, gold maintains its monetary role amid currency system uncertainties.
Nanotechnology applications requiring ultra-pure silver create new demand categories with specialised quality requirements. Space industry expansion generates demand for precious metals components that must perform under extreme operational conditions.
Projected Demand Growth Rates:
| Sector Category | Gold Growth (CAGR) | Silver Growth (CAGR) | Primary Drivers |
|---|---|---|---|
| Technology | 2.1% | 7.3% | AI infrastructure, 5G networks |
| Green Energy | 1.8% | 12.4% | Solar expansion, EV adoption |
| Investment | 4.2% | 5.7% | Currency debasement concerns |
Medical technology advancement creates growing demand for precious metals in biocompatible applications, surgical instruments, and antimicrobial treatments. Silver's natural antimicrobial properties generate expanding applications in healthcare settings and medical device manufacturing.
Energy storage system development requires silver components in battery technologies and grid-scale storage installations. As renewable energy adoption accelerates, these applications could generate substantial new demand that doesn't exist in gold markets.
Regulatory environment evolution affects mining operations through environmental, social, and governance requirements. These may constrain future supply expansion. Carbon pricing mechanisms increase operational costs for energy-intensive mining processes.
What Role Will Digital Currencies Play?
Digital currency adoption presents complex implications for precious metals demand. While cryptocurrency growth might reduce some monetary demand for physical metals, concerns about digital asset stability could simultaneously increase demand for tangible alternatives.
International trade agreement modifications and geopolitical tensions affect precious metals trade flows and pricing mechanisms. Strategic stockpiling by nations seeking currency alternatives could create sustained demand pressure similar to current central bank accumulation patterns.
These developments highlight the importance of understanding how evolving gold and silver supply and demand drivers will shape future market conditions. Furthermore, the interplay between traditional monetary factors and emerging technological applications continues to create new investment opportunities and risks.
Risk Assessment and Market Scenario Analysis
Precious metals markets face multiple risk factors that could significantly alter supply-demand dynamics and price trajectories. Understanding these potential scenarios helps investors prepare for various market conditions and adjust positioning accordingly.
Supply disruption scenarios represent significant upside price risks for both metals. Labour strikes at major mining operations, geopolitical conflicts in producing regions, and environmental disasters could temporarily constrain supply. Such events often generate sharp price appreciation.
Economic recession scenarios create complex effects that differ between gold and silver. While gold typically benefits from safe-haven demand during economic stress, silver faces conflicting pressures from reduced industrial consumption alongside increased investment interest.
Risk Factor Assessment:
- Mining supply disruptions: High impact, moderate probability
- Economic recession effects: Variable impact, cyclical probability
- Technological substitution: Moderate impact, low probability
- Monetary policy reversals: High impact, policy-dependent probability
Interest rate normalisation scenarios could create headwinds for precious metals if real yields rise substantially above historical averages. However, government debt levels may constrain monetary authorities' ability to maintain elevated rates for extended periods.
Currency crisis scenarios in major economies could generate massive precious metals demand as investors seek alternatives to unstable fiat currencies. The magnitude of such scenarios could overwhelm normal supply-demand analysis and create unprecedented price appreciation.
According to analysis from CME Group's research on gold-silver price ratios, several key factors will likely drive relative performance between the metals in coming years. These include monetary policy divergences, industrial demand growth, and supply constraints.
Investment Strategy Framework and Implementation
Developing effective precious metals investment strategies requires understanding each metal's distinct characteristics. Gold functions optimally as portfolio insurance and currency debasement protection. In contrast, silver offers greater growth potential with correspondingly higher volatility.
Strategic Allocation Considerations:
- Gold: 5-15% of investment portfolio for stability
- Silver: 1-5% of investment portfolio for growth potential
- Physical vs. paper exposure based on objectives
- Storage and insurance cost factors
- Tax implications across different structures
Dollar-cost averaging strategies help manage timing risk and volatility in precious metals accumulation programmes. Regular monthly purchases reduce the impact of short-term price fluctuations whilst building positions over extended periods.
Rebalancing strategies using the gold-silver ratio can enhance returns by rotating between metals based on relative value assessments. When the ratio exceeds historical averages substantially, tactical rotations toward silver may capture mean reversion opportunities.
Physical storage decisions affect both costs and accessibility of precious metals investments. Secure storage options range from home safes to professional vault facilities. Each presents distinct trade-offs between cost, convenience, and security considerations.
Tax-advantaged structures like precious metals IRAs allow for accumulation whilst deferring tax obligations. However, restrictions on storage and distribution must be considered in strategy development.
Why Professional Guidance Matters
The complexity of gold and silver supply and demand drivers requires thorough analysis and ongoing monitoring. Professional guidance can help investors navigate these intricate markets whilst avoiding common pitfalls.
Moreover, understanding the relationship between precious metals and broader economic conditions remains essential for successful long-term positioning. Research from Investopedia on gold price drivers provides additional insights into fundamental factors affecting precious metals valuations.
For investors seeking to understand how precious metals fit within diversified portfolios, the gold‐stock market guide offers valuable perspective on correlations and timing considerations.
Disclaimer: This analysis is provided for informational purposes only and should not be construed as investment advice. Precious metals investing involves substantial risks, including the potential for significant price volatility and loss of principal. Past performance does not guarantee future results. Investors should conduct their own research and consult with qualified financial advisors before making investment decisions. Market conditions, regulatory changes, and economic factors may significantly affect precious metals prices and investment outcomes.
Ready to Identify the Next Major Precious Metals Discovery?
Discovery Alert's proprietary Discovery IQ model delivers real-time notifications on significant ASX mineral discoveries, instantly transforming complex geological data into actionable investment insights. With historic discoveries generating substantial returns and industrial silver demand reaching record levels of 680.5 million ounces in 2024, understanding major mineral discoveries can provide crucial market advantages during volatile precious metals cycles.