July 29, 2026
When Volume Becomes a Defensive Weapon: Understanding Guidance Beats in Diversified Mining
In commodity cycles marked by price volatility and cost inflation, the ability of a diversified miner to exceed production targets across every operational pillar simultaneously is far rarer than most investors appreciate. Most guidance beats are isolated achievements, a single commodity division outperforming while others disappoint, or a favourable pricing window masking operational underperformance elsewhere. When a company simultaneously exceeds output targets across contract mining, bulk commodities, and battery materials in the same financial year, it signals something more structurally significant: that operational improvements are systemic rather than coincidental.
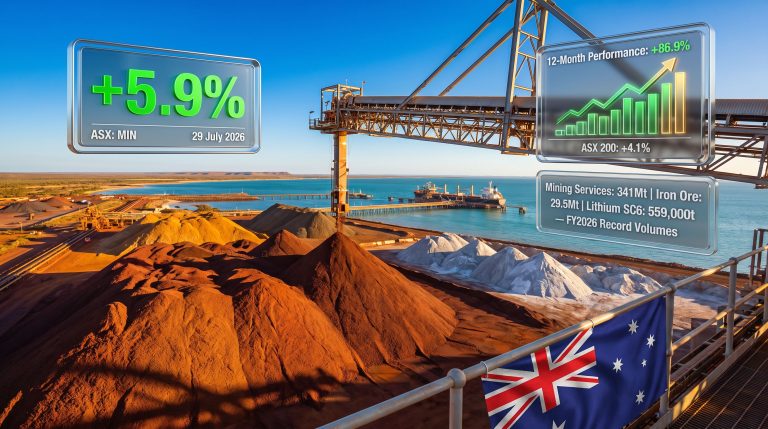
This is precisely the context in which Mineral Resources (ASX: MIN) closed out FY26. The Perth-based diversified miner delivered MinRes above guidance on record production results across all three of its major business segments, with actual volumes surpassing the top end of guidance in each case. For ASX investors tracking MIN as a Top 200 diversified resource company, the result offers a rare multi-dimensional data point on operational execution quality during one of the more challenging macro environments Australian mining has faced in recent years.
When big ASX news breaks, our subscribers know first
FY26 Production Results: What MinRes Actually Delivered
The headline numbers across all three segments tell a consistent story of outperformance. Rather than a single standout division carrying the result, each of MinRes's operating pillars contributed meaningfully to the guidance beat. According to MinRes's Q4 FY25 quarterly activity report, this broad-based outperformance reflects genuine operational depth across the business.
Mining Services: The 300 Million Tonne Milestone and Beyond
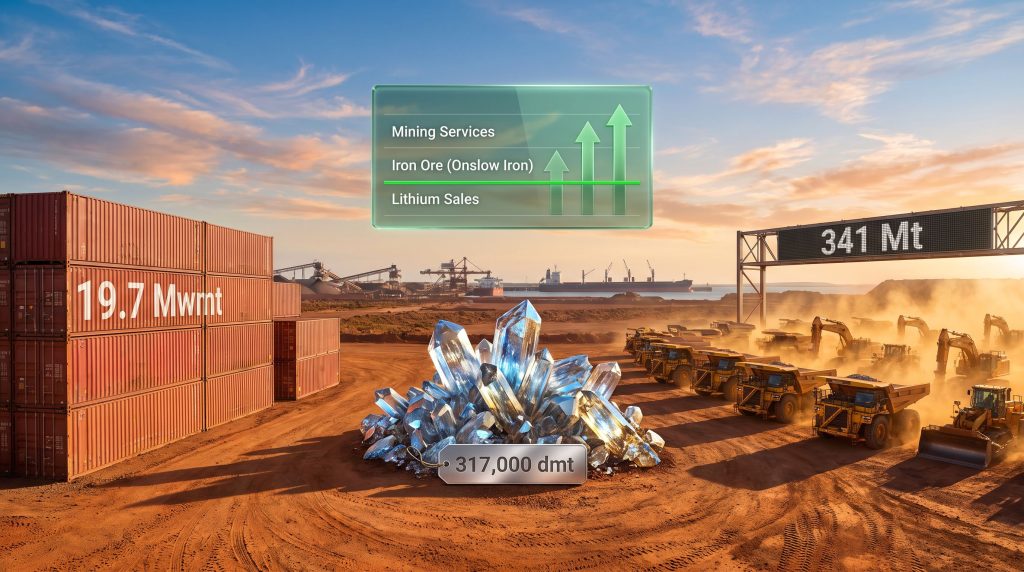
The mining services division delivered the most numerically striking result of the three, recording 341 million tonnes of material moved for FY26. This exceeded the already-upgraded guidance range of 320 to 330 million tonnes, representing a beat of approximately 11 million tonnes above the top end of that revised target.
Breaking the 300 million tonne barrier in contract mining is not a trivial operational achievement. Contract mining throughput at this scale depends on a complex interplay of factors:
- Fleet utilisation rates across multiple concurrent contracts
- Operational scheduling efficiency and shift productivity
- Equipment availability, maintenance cycles, and downtime management
- Contract diversity and the geographic spread of active work programs
The 341 Mt result positions MinRes's services arm among the more productive contract mining operations in the Australian market. What makes this figure particularly notable is that the guidance range had already been upgraded entering the final quarter, meaning the market had already revised its expectations upward once before the actual result came in higher still. This double-beat dynamic is relatively uncommon and suggests that operational momentum was building rather than fading as the financial year concluded.
In Australian contract mining, volumes above 300 million tonnes annually place an operator within a narrow group of high-capacity services providers capable of competing for large-scale, multi-year bulk earthworks contracts. Sustaining output at 341 Mt tests the upper boundaries of fleet capacity for most operators of similar scale.
Iron Ore (Onslow Iron): Infrastructure Maturity Unlocks Shipment Volume
MinRes's Onslow Iron project delivered 19.7 million wet metric tonnes (wmt) of attributable shipments for FY26, clearing the upgraded guidance ceiling of 17.7 to 19.4 million wmt by approximately 300,000 wmt.
The Onslow Iron operation represents one of the more capital-intensive infrastructure investments in MinRes's recent history. The project's logistics corridor, encompassing a purpose-built Onslow haul road, port facilities, and export chain infrastructure along the Western Australian coast, required substantial upfront investment before shipment volumes could scale meaningfully. The FY26 result indicates that this infrastructure has reached a level of operational maturity capable of sustaining high-volume export throughput.
Several factors influenced the final shipment tally:
- Port throughput capacity reaching designed operational parameters
- Haul road efficiency improvements as the corridor bedded in
- Vessel scheduling and loading rate optimisation at the export terminal
- Reduction in operational disruptions that characterised earlier ramp-up phases
Furthermore, the expansion of Onslow transhipper capacity played a meaningful role in enabling the 19.7 Mwmt outcome. The result validates the capital thesis behind Onslow Iron's infrastructure build and sets a meaningful benchmark for assessing the operation's trajectory toward potential annualised run rates above 20 million wmt in subsequent years.
Lithium: Volume Strategy Navigates a Suppressed Price Environment
MinRes's lithium division recorded 317,000 dry metric tonnes (dmt) of spodumene sales in FY26, clearing the original guidance band of 270,000 to 290,000 dmt by approximately 27,000 dmt above the top end. Notably, this beat was measured against the original guidance range rather than an upgraded target, making it the most substantial proportional outperformance of the three divisions.
The lithium result carries particular analytical weight given the backdrop against which it was achieved. The lithium market downturn through the FY25 to FY26 period saw the market absorbing the consequences of significant new supply entering from Australian and African hard-rock projects while downstream demand from Chinese battery manufacturers remained inconsistent. In this environment, maintaining high throughput volumes is a deliberate strategic choice with identifiable trade-offs.
The core logic of a volume-over-margin strategy during a lithium trough cycle involves:
- Unit cost dilution: Fixed operating costs spread across a larger sales volume improves the cost-per-tonne economics
- Market share preservation: Sustaining volumes keeps offtake relationships active during periods of soft demand
- Operational readiness: Maintaining processing throughput preserves the workforce capability and plant efficiency required for rapid scale-up when pricing recovers
MinRes's lithium production draws primarily from its Wodgina and Mt Marion operations in Western Australia. Wodgina, a joint venture asset with Albemarle, is one of the largest hard-rock lithium deposits globally by resource size, while Mt Marion has been a consistent production contributor since its commissioning phase.
FY26 Guidance vs. Actual: The Numbers in Full
| Business Segment | Guidance Range | Actual Result | Beat Margin |
|---|---|---|---|
| Mining Services | 320 to 330 Mt | 341 Mt | ~11 Mt above top end |
| Iron Ore (Onslow Iron) | 17.7 to 19.4 Mwmt | 19.7 Mwmt | ~300,000 wmt above top end |
| Lithium Sales | 270,000 to 290,000 dmt | 317,000 dmt | ~27,000 dmt above top end |
The table above highlights a defining characteristic of the FY26 result: MinRes did not merely reach the midpoint of its guidance ranges. It exceeded the upper end of its targets in all three segments, with the mining services and lithium divisions recording the largest proportional beats. As reported by the AFR, the result represents a meaningful operational milestone for the embattled miner.
What the Operational Machinery Actually Looks Like
Contract Mining at Scale: Why Fleet Economics Matter
The mechanics of achieving 341 million tonnes in a single financial year require a level of capital asset intensity that is often underestimated by investors unfamiliar with the contract mining model. Large-scale contract mining operations deploy fleets of heavy earthmoving equipment, including draglines, blast hole drills, rigid dump trucks, and hydraulic excavators, across multiple simultaneous client sites.
The efficiency gains that lift throughput from, say, 310 Mt to 341 Mt are rarely the product of adding more equipment alone. They typically reflect improvements in equipment availability through better maintenance scheduling, optimisation of dig-and-haul cycle times, and the ability to redeploy idle assets between contracts without extended mobilisation delays.
MinRes has historically differentiated its services model through vertical integration, manufacturing and assembling much of its own mining equipment through its PIRATE and other proprietary equipment programmes. This approach reduces lead times on fleet expansion, lowers capital costs per tonne of capacity, and provides greater control over maintenance standards than operators reliant entirely on third-party OEM supply chains. Consequently, this structural advantage in fleet economics is a plausible contributor to the throughput efficiency reflected in the FY26 result.
Spodumene Mineralogy and Why Grade Matters to Sales Volume
A dimension of the lithium volume result that receives limited mainstream coverage is the relationship between spodumene concentrate grade and sales volume. Understanding spodumene extraction basics is helpful context here, as spodumene is a lithium aluminium silicate mineral (LiAlSi₂O₆) processed from pegmatite ore bodies. The standard commercial product is a concentrate graded at approximately 5.5% to 6.0% lithium oxide (Li₂O), which is the benchmark specification accepted by most Chinese and Korean lithium chemical converters.
Maintaining consistent concentrate grade at or above specification is critical for two reasons. First, it determines the lithium yield per tonne of spodumene sold, which directly affects the revenue generated per unit of concentrate. Second, off-specification product can attract pricing penalties or be rejected by offtake counterparties, creating unsaleable inventory. The fact that MinRes achieved 317,000 dmt in sales rather than just production implies that product quality was sufficient to clear the market, a non-trivial operational achievement given that both Wodgina and Mt Marion are operating in a period of cost pressure.
How This Result Positions MinRes Within the ASX Resources Sector
The Rarity of a Tri-Segment Guidance Beat
Diversified miners that operate across structurally distinct commodity and services segments face a fundamental challenge: each business unit responds to different demand drivers, cost structures, and operational risks. Mining services revenue correlates with client capital expenditure cycles. Iron ore revenue tracks seaborne bulk commodity prices and Chinese steel demand. Lithium revenue is driven by EV adoption rates, battery chemistry trends, and the supply-demand balance in the spodumene-to-lithium-carbonate conversion chain.
For all three divisions to simultaneously exceed guidance requires either extraordinary luck across commodity markets, or genuine operational execution quality that is independent of external price factors. Given that FY26 was characterised by lithium price weakness and iron ore price volatility, the volume beats achieved by MinRes reflect operational rather than commodity-driven outperformance. This distinction matters enormously to long-term investors assessing management quality.
Balance Sheet Context: Why Volume Matters When Leverage Is Elevated
MinRes carries a debt profile that has been the subject of significant market scrutiny through the FY25 to FY26 period. In a high-leverage environment, operational cash flow generation becomes the primary mechanism for debt reduction, and cash flow is a direct function of volume multiplied by realised price minus operating costs. When prices are compressed, as they have been in lithium, volume outperformance becomes the lever that prevents cash flow from deteriorating further.
Record mining services volumes generate fee income that is relatively insulated from commodity price swings, providing a more stable cash flow base. The combination of record services throughput and above-guidance iron ore shipments creates a cash generation profile that, even under lithium price headwinds, supports MinRes's ongoing debt reduction programme. The FY26 result therefore carries balance sheet implications that extend well beyond the production figures themselves.
In a highly leveraged mining company, operational outperformance serves a dual purpose: it improves the headline revenue and cash flow numbers, but it also signals to debt markets and credit counterparties that the operational base supporting the balance sheet is sound. Volume records achieved in difficult conditions are arguably more credible than those achieved in commodity bull markets.
Forward Indicators: What FY27 Needs to Deliver
The Sustainability Question for Mining Services
Reaching 341 Mt in FY26 raises an important question for the year ahead: is this a new operational baseline, or does it represent a peak in a cycle that may moderate? The answer depends partly on the contract pipeline. If major mining clients across iron ore, gold, and other sectors continue to deploy capital into new and expanded operations, the demand for contract mining services will remain elevated. If capital expenditure cycles in these sectors contract, however, volumes could normalise below the FY26 record.
MinRes's ability to sustain volumes above 330 Mt on an annualised basis in FY27 will be a closely watched indicator of whether the FY26 result represents structural capacity or a high-watermark output.
Onslow Iron's Path Toward 20+ Mwmt
The 19.7 Mwmt FY26 result positions Onslow Iron within striking distance of a potential 20 million wmt annual run rate. Reaching and sustaining that threshold would represent a significant milestone for the operation's commercial profile within the Australian iron ore export hierarchy, a sector dominated by the Pilbara operations of BHP, Rio Tinto, and Fortescue.
Sustaining growth beyond 20 Mwmt will require continued investment in port capacity, haul road maintenance, and potentially fleet expansion at the mine face. The capital requirements for incremental capacity growth at this scale are not trivial, making cost discipline in the services and lithium divisions an important enabler of Onslow's longer-term expansion trajectory.
Cost Adherence: The Performance Test That Follows Volume
Volume records are necessary but not sufficient for earnings improvement. The critical metric that will determine whether FY26's operational outperformance translates into meaningful financial improvement is cost performance. Key metrics to track in FY27 include:
- C1 cash costs per tonne for Onslow Iron, benchmarked against Pilbara peers
- Unit costs per dmt for spodumene production across Wodgina and Mt Marion
- Cost per tonne moved within the mining services division
- Labour, fuel, and consumables cost trajectories under ongoing inflationary pressure in the Western Australian mining labour market
If MinRes can demonstrate that record volumes were achieved alongside cost discipline rather than at the expense of it, the FY26 result transitions from an impressive operational story to a genuinely compelling financial one. Indeed, the degree to which MinRes above guidance on record production translates into improved earnings will ultimately depend on how well the business manages its cost base in the year ahead.
The next major ASX story will hit our subscribers first
Frequently Asked Questions: MinRes FY26 Production Results
What does MinRes above guidance on record production mean for shareholders?
It means that the company's actual output across all three major divisions exceeded the production and sales volume targets communicated to the ASX during the financial year. For shareholders, this is a positive signal regarding management's operational execution capability and the health of the underlying asset base.
Which segment beat guidance by the largest proportional margin?
The lithium division recorded the largest proportional beat, delivering 317,000 dmt against an original guidance ceiling of 290,000 dmt, a margin of approximately 9.3% above the top end of the original range.
Why does the mining services result matter if MinRes is primarily thought of as a miner?
Mining services provides fee-based income that is more insulated from commodity price movements than direct mining revenue. Record services throughput diversifies MinRes's cash flow base and provides a buffer against the earnings volatility that commodity price swings create in the iron ore and lithium divisions.
Does achieving record lithium volumes offset the impact of weak spodumene prices?
Partially. Higher volumes spread fixed costs across a larger sales base, improving unit economics. However, if per-tonne realised prices fall faster than unit costs improve, net revenue can still decline despite volume growth. The degree of offset depends on the specific cost and price dynamics in each reporting period.
What are the primary risks to MinRes repeating this performance in FY27?
Key risks include a continuation of depressed spodumene prices, iron ore price deterioration driven by slower Chinese steel demand, cost inflation in the Western Australian labour and equipment markets, potential softening of the mining services contract pipeline, and the capital requirements needed to sustain Onslow Iron's growth trajectory.
Want to Track the Next Major ASX Mineral Discovery Before the Market Moves?
Discovery Alert's proprietary Discovery IQ model scans ASX announcements in real time, instantly identifying significant mineral discoveries and turning complex data into actionable investment insights — exactly the kind of edge that matters in a sector where timing is everything. Explore historic discoveries and the returns they generated, then start your 14-day free trial at Discovery Alert to position yourself ahead of the broader market.