June 20, 2026
Modern Drilling Efficiency Redefines American Energy Production
The U.S. oil rig count comeback reflects a fundamental shift from quantity-based drilling approaches to precision-driven operational methodologies. Advanced completion technologies have revolutionised how operators extract maximum value from each wellbore, enabling sustained production growth even as active rig counts remain significantly below historical peaks. This evolution demonstrates the industry's maturation from aggressive expansion cycles to strategic resource optimisation.
Current market dynamics reveal a sophisticated balance between technological capability and capital discipline. Operators now maintain production levels approaching all-time highs while deploying approximately 65% fewer rigs than during peak drilling periods of 2014-2016. This productivity enhancement reflects cumulative improvements in horizontal drilling techniques, hydraulic fracturing designs, and real-time monitoring systems that have fundamentally altered the economics of unconventional resource development.
When big ASX news breaks, our subscribers know first
Technological Innovation Drives Contemporary Rig Deployment Strategies
The relationship between commodity pricing and drilling activity has evolved beyond traditional boom-bust patterns that historically characterised the petroleum industry. Modern operators employ sophisticated economic models that incorporate long-term price forecasts, completion timing optimisation, and shareholder return obligations when making capital allocation decisions.
Furthermore, a comprehensive oil price rally analysis reveals how contemporary pricing mechanisms influence operational planning cycles and equipment deployment strategies.
Current Market Pricing Analysis:
West Texas Intermediate crude currently trades at $60.26 per barrel, representing a modest gain from previous trading sessions. Brent crude maintains premium pricing at $63.92 per barrel, reflecting global supply-demand fundamentals and geopolitical risk premiums. These price levels support steady drilling activity while encouraging operational efficiency improvements rather than aggressive capacity expansion.
| Price Range ($/barrel) | Operator Response Strategy | Expected Rig Deployment |
|---|---|---|
| $45-55 | Maintenance Operations | 400-450 active rigs |
| $55-65 | Selective Expansion | 450-550 active rigs |
| $65-75 | Accelerated Development | 550-650 active rigs |
| $75+ | Maximum Deployment | 650+ active rigs |
Energy Information Administration projections suggest West Texas Intermediate averaging $51 per barrel throughout 2026, representing approximately 21% decline from current levels. These forecasts influence operator planning cycles and equipment deployment schedules, encouraging continued emphasis on operational efficiency over volume-driven strategies.
Capital Allocation Philosophy Evolution
Contemporary drilling programmes reflect institutional memory from previous boom-bust cycles, with operators prioritising sustainable returns over market share expansion. Companies now balance drilling investment with dividend distributions and share repurchase programmes, maintaining financial flexibility while meeting production replacement requirements.
The lag time between price signals and actual rig deployment has extended as operators implement more rigorous economic evaluation processes. Typical response periods now range from 4-8 weeks, allowing companies to verify price sustainability before committing capital to new drilling projects.
Regional Production Centres Define America's Energy Geography
Basin-specific drilling activity reflects the heterogeneous nature of American unconventional resources, with each region offering distinct geological advantages and economic characteristics. Current rig deployment patterns demonstrate operators' strategic focus on core acreage areas where well productivity and infrastructure access provide optimal returns.
In addition, examining the OPEC production impact provides crucial context for understanding how international supply dynamics influence domestic drilling decisions.
Permian Basin Leadership:
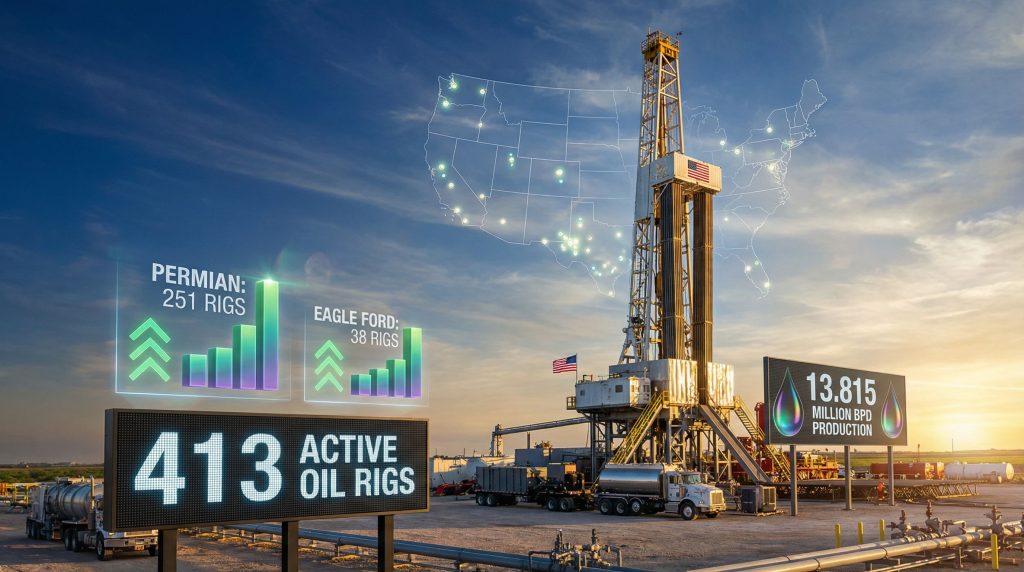
The Permian Basin maintains its position as America's premier unconventional oil province, supporting 251 active drilling rigs as of the latest reporting period. This concentration represents 61% of total oil-directed drilling activity nationwide, despite experiencing a 53-rig decline from year-ago levels.
Basin productivity advantages include multiple stacked pay formations (Spraberry, Wolfcamp, Bone Spring), established midstream infrastructure networks, and proximity to Gulf Coast refining capacity. These structural benefits enable Permian operators to maintain economic viability at lower commodity price levels compared to competing regions.
Eagle Ford Shale Characteristics:
Eagle Ford operations currently deploy 38 active rigs, representing 9% of national oil-directed drilling activity. The formation's light crude production characteristics and direct connection to Gulf Coast refining capacity provide natural market advantages, though the region faces increased competition from Permian production growth.
Regional Economics Comparison
Drilling costs vary significantly across major unconventional plays, influencing operator allocation decisions and regional activity levels:
- Permian Basin: $5.5-7.5 million per well (horizontal completions)
- Eagle Ford: $4.5-6.5 million per well (lower due to shallower depths)
- Bakken Formation: Maintaining steady activity levels with competitive economics
- Emerging Plays: Distributed development across secondary regions
Gas-directed drilling demonstrates different market dynamics, with 129 active rigs representing a modest increase from previous periods. This divergence from oil rig trends reflects strengthening natural gas fundamentals and seasonal demand patterns.
Completion Crew Activity Indicates Production Optimisation Focus
The relationship between drilling rigs and completion crews provides crucial insight into industry production timing strategies. Current data reveals 173 active completion crews, representing a decline from 201 crews at the beginning of 2025 but showing recent weekly increases.
This 28-crew reduction (13.9% decline) reflects strategic inventory management rather than capacity constraints. Operators have accumulated drilled-but-uncompleted well inventories, creating operational flexibility to time completion activities with favourable market conditions and service cost optimisation.
Operational Ratios Analysis:
The current ratio of 2.39 drilling rigs per completion crew indicates substantial DUC inventory accumulation. This represents a material shift from historical practices where drilling and completion occurred in close sequence, enabling operators to respond rapidly to price changes and service availability.
Modern completion strategies emphasise timing optimisation over continuous activity, allowing operators to reduce per-well costs through batch completion techniques and service provider negotiation leverage.
Service Industry Capacity Management
Completion service providers maintain conservative capacity expansion policies, balancing equipment investments against cyclical demand patterns. Major service companies operate at approximately 60-70% of historical peak utilisation rates, suggesting available capacity for activity increases if market conditions warrant expansion.
Completion costs range from $6-12 million per well depending on depth, lateral length, and proppant volumes. Typical frac spreads can complete 10-15 wells monthly, though current crews work below historical peak efficiency levels.
However, AI-driven drilling innovation continues revolutionising operational efficiency, enabling operators to achieve superior results with existing equipment configurations.
Production Achievement Defies Conventional Industry Metrics
Weekly crude oil production reached 13.815 million barrels per day during the week ending November 28, positioning American output just 47,000 barrels below all-time historical peaks. This achievement with 413 active oil rigs contrasts sharply with production levels during previous high-rig-count periods.
Historical Productivity Evolution:
| Time Period | Average Rigs | Production (MMbpd) | Barrels per Rig Daily |
|---|---|---|---|
| 2014-2016 | 1,200+ | 9.5 | 7,917 |
| 2020-2022 | 600-800 | 11.5 | 14,375-19,167 |
| 2025 Current | 413 | 13.8 | 33,414 |
The 33,414 barrels per rig daily productivity in 2025 represents a 322% increase from 2014-2016 levels and 74% improvement from 2020-2022 performance. This transformation reflects cumulative technological advancement and operational optimisation across the industry.
Well Productivity Enhancement Factors
Horizontal Drilling Improvements:
- Lateral lengths increased from 5,000-8,000 feet (2014) to 12,000-15,000 feet (2024)
- Multi-lateral well designs now standard in core acreage areas
- Enhanced geosteering enables optimal wellbore positioning within productive intervals
Advanced Hydraulic Fracturing:
- Stage density increased from 25-40 stages to 50-70+ stages per well
- Proppant loading expanded from 2-4 million pounds to 6-10+ million pounds per well
- Slickwater fluid systems improve conductivity and reduce completion times
Production Optimisation Technologies:
- Real-time downhole pressure monitoring systems
- Automated production choke management
- Predictive decline modelling enabling proactive intervention
Market Fundamentals Shape Future Activity Projections
Energy Information Administration forecasts provide framework for industry planning, though actual market conditions may deviate significantly from projected averages. The forecasted $51 per barrel WTI average for 2026 suggests continued emphasis on operational efficiency over aggressive expansion.
Current crude pricing at $60.26 per barrel supports steady drilling activity while encouraging technological innovation and cost reduction initiatives. Operators balance production growth objectives with shareholder return commitments, maintaining disciplined capital allocation approaches developed during previous market cycles.
Consequently, evaluating broader US economic trends provides essential context for understanding how macroeconomic conditions influence energy sector investment decisions and operational planning.
Investment Capital Availability Patterns
Modern energy companies prioritise financial flexibility through balanced capital allocation between drilling investment and shareholder returns. This approach reflects lessons learned from previous boom-bust cycles and institutional investor expectations for sustainable business models.
Debt-to-equity ratios among major operators remain conservative compared to historical levels, providing financial capacity for opportunistic drilling expansion if market conditions warrant increased activity. However, companies demonstrate reluctance to pursue aggressive growth strategies without clear long-term price support.
The next major ASX story will hit our subscribers first
Geopolitical Considerations Influence Domestic Energy Security
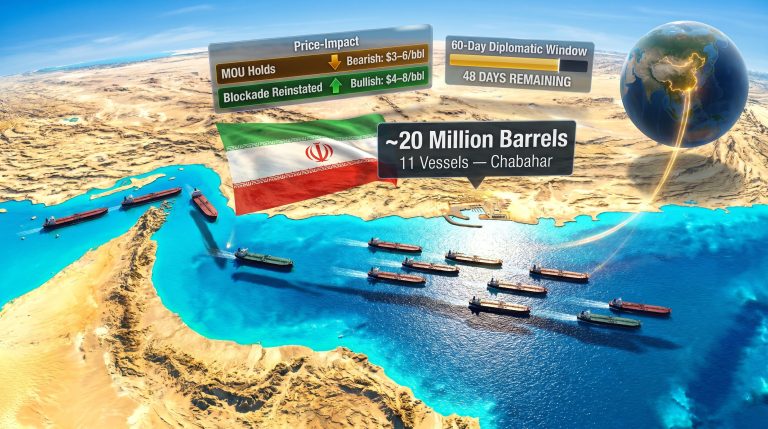
Recent international developments have reinforced the strategic importance of maintaining robust domestic oil production capabilities. Supply chain disruptions and geopolitical tensions highlight the value of energy independence and domestic resource development.
For instance, understanding the trade war oil impact remains crucial for operators planning long-term investment strategies and assessing market risk factors.
Policy frameworks supporting domestic energy production continue influencing operator confidence and long-term investment planning. Permitting efficiency, regulatory clarity, and infrastructure development remain crucial factors in drilling programme development and regional activity distribution.
Energy Security Infrastructure Development
Pipeline capacity expansions and processing facility investments support sustained production growth without proportional rig count increases. Recent infrastructure completions enhance market access for domestic production while reducing transportation costs and delivery time constraints.
Strategic petroleum reserve management and emergency response capabilities demonstrate the importance of maintaining adequate domestic production capacity during international supply disruptions.
Advanced Technologies Revolutionise Operational Efficiency
Digital transformation initiatives across the petroleum industry have fundamentally altered drilling and completion processes. Advanced data analytics, artificial intelligence applications, and automated drilling systems enable operators to optimise well placement, reduce drilling time, and maximise hydrocarbon recovery rates.
Furthermore, offshore drilling developments demonstrate how technological advancement enables operators to access previously uneconomic resources while maintaining competitive cost structures.
Digital Oilfield Implementation:
Modern drilling operations incorporate real-time data analysis, predictive maintenance protocols, and remote monitoring capabilities that reduce non-productive time and improve safety performance. These technologies enable operators to maintain production with fewer rigs while achieving superior well productivity.
Automation systems now handle routine drilling operations, allowing personnel to focus on optimisation and problem-solving activities. This technological advancement contributes significantly to the industry's improved efficiency metrics and reduced operating costs.
Environmental Technology Integration
Sustainable Drilling Practices Include:
- Advanced water recycling systems reducing freshwater consumption
- Lower-emission drilling equipment and power systems
- Enhanced leak detection and repair programmes
- Biodegradable drilling fluid alternatives
- Reduced surface footprint through multi-well pad development
These environmental improvements demonstrate the industry's commitment to responsible resource development while maintaining operational efficiency and economic competitiveness.
Supply Chain Dynamics Affect Equipment Deployment
Equipment availability and manufacturing capacity influence rig deployment timelines and activity expansion capabilities. Steel availability, specialised drilling equipment production, and skilled labour recruitment continue affecting operator ability to rapidly scale drilling programmes.
Service company capacity management reflects cautious approaches to equipment investment, with providers balancing expansion capital against cyclical demand uncertainty. This conservative methodology can create natural constraints on rapid rig count increases during price recovery periods.
Additionally, current rig count statistics provide valuable benchmark data for understanding industry capacity utilisation and deployment patterns across different operational regions.
Skilled Labour Considerations
The petroleum industry continues addressing workforce development challenges as experienced personnel retire and new workers require comprehensive training programmes. Technical skill requirements have increased with technological advancement, necessitating ongoing education and certification programmes.
Labour availability affects both drilling efficiency and expansion capability, with operators investing in training programmes and competitive compensation packages to attract and retain qualified personnel.
Industry Consolidation Shapes Operational Structure
Merger and acquisition activity has created larger, more efficient operators with superior technology access, capital resources, and operational expertise. This consolidation enables companies to maintain production levels with fewer rigs while achieving economies of scale in drilling and completion activities.
Consolidation Benefits Include:
- Enhanced technology development and deployment
- Improved capital allocation efficiency
- Superior operational expertise and best practice implementation
- Increased negotiating leverage with service providers
- Better access to capital markets and financing options
Infrastructure Investment Patterns
Pipeline capacity, processing facilities, and transportation networks continue expanding to support increased production from existing drilling programmes. This infrastructure development enables sustained production growth without proportional rig count increases.
Recent midstream investments focus on capacity optimisation and system reliability rather than purely volume expansion, reflecting the industry's mature approach to resource development and market access.
The U.S. oil rig count comeback represents more than statistical recovery; it demonstrates fundamental transformation toward sustainable, efficient production methodologies. Current trends indicate operators will continue prioritising technological innovation and operational excellence over pure volume expansion, positioning American energy production for long-term competitiveness and market leadership.
This strategic evolution ensures domestic energy security while maintaining economic viability across various market conditions, providing stable foundation for continued American energy independence and global market influence.
Looking to Capitalise on Energy Market Opportunities?
Discovery Alert's proprietary Discovery IQ model delivers real-time alerts on significant mineral discoveries across the ASX, helping investors identify actionable opportunities in the mining and resource sectors that complement energy market investments. Start your 30-day free trial today and gain the market-leading edge needed to stay ahead of major discovery announcements that could drive substantial returns.