
July 27, 2026
The Invisible Infrastructure Crisis Powering the AI Revolution
Every technological leap in history has carried an energy cost that only becomes visible once the infrastructure strains under the weight of adoption. The railroad era devoured timber. The automobile age reshaped crude oil markets for a century. Today, artificial intelligence is doing something similar to electricity grids, and the commodity sitting quietly at the centre of this transformation is natural gas demand from data centers.
The scale of what is coming is difficult to overstate. As capital floods into AI infrastructure, the energy systems underpinning that infrastructure are being stress-tested in ways that grid planners and utilities simply did not anticipate. The result is a structural demand shift for natural gas that is only beginning to register in commodity markets, yet the mechanics behind it are already locked in.
When big ASX news breaks, our subscribers know first
The Scale of the Power Problem: What AI Infrastructure Actually Consumes
Electricity Demand Is Entering Uncharted Territory
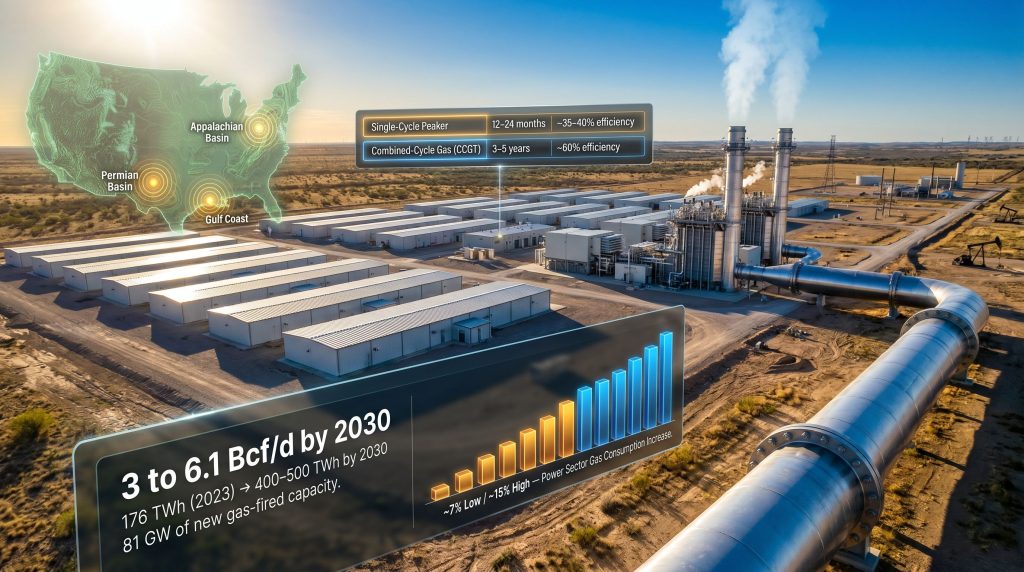
U.S. data centres consumed approximately 176 terawatt-hours (TWh) of electricity in 2023. By the end of this decade, that figure is projected to reach between 400 and 500 TWh annually, driven primarily by AI model training, large-scale inference workloads, and the continued expansion of hyperscale cloud platforms operated by Microsoft, Google, and Amazon.
To understand why this matters, consider that this projected growth represents roughly 2.3 times the current consumption level, compressed into a seven-year window. No other single sector is expected to drive electricity demand growth at this pace during the same period. Industrial electrification, electric vehicle charging, and residential demand growth are all meaningful trends, but the data centre expansion stands apart in both speed and concentration.
The comparison below illustrates the relative growth dynamics across major consumption sectors:
| Sector | 2023 Consumption Estimate | Projected 2030 Growth Rate |
|---|---|---|
| Data Centres | 176 TWh | ~150%–185% increase |
| Industrial (broad) | ~800 TWh | ~10%–15% increase |
| Residential | ~1,400 TWh | ~5%–8% increase |
| EV Charging | ~30 TWh | ~200%–300% increase |
Note: EV charging growth rate is high in percentage terms but starts from a much smaller base, limiting absolute impact relative to data centres.
Why the Existing Grid Cannot Absorb This Demand
The core problem is not a shortage of electricity generating potential in the abstract. It is a shortage of deployable, reliable baseload power that can be brought online within the 2–3 year development windows that hyperscale data centre developers require.
Grid interconnection queues across the United States now stretch five years or longer in many regions. Wind and solar projects, while increasingly cost-competitive, are inherently intermittent and depend on the same congested interconnection processes. Small modular nuclear reactors represent a promising long-term option but carry 10–15 year development timelines and unresolved cost structures at commercial scale.
According to the IEA's analysis of energy supply for AI, no zero-carbon energy source can be built, permitted, and connected fast enough to meet the power requirements that AI infrastructure will impose before 2030. Natural gas is not simply a preference among alternatives. It is the only option that fits the engineering timeline.
Behind-the-Meter Generation: The Workaround Reshaping Gas Markets
How Data Centers Are Bypassing the Grid Entirely
Faced with multi-year interconnection delays, data centre developers have increasingly turned to behind-the-meter (BTM) generation, a model in which onsite power plants are constructed directly at the facility campus. These plants generate electricity consumed entirely on-site, bypassing utility grid connections and the regulatory queues that come with them.
The technology most commonly deployed in BTM configurations includes aeroderivative gas turbines and single-cycle peaker plants. These units can be commissioned in 12 to 24 months, making them compatible with data centre development schedules in a way that no other power source currently matches.
However, this speed advantage comes with a significant thermal efficiency trade-off that has direct implications for total gas consumption volumes:
| Generation Type | Deployment Speed | Thermal Efficiency | Grid Dependency | Typical Use Case |
|---|---|---|---|---|
| Combined-Cycle Gas (CCGT) | 3–5 years | ~60% | Grid-connected | Utility-scale baseload |
| Single-Cycle Peaker | 12–24 months | ~35%–40% | BTM / Onsite | Data centre campuses |
| Solar + Battery Storage | 1–3 years | Variable | Grid or BTM | Supplemental/renewable |
| Nuclear (SMR) | 10–15 years | ~33% | Grid-connected | Long-term baseload |
The Efficiency Gap and Its Demand Amplification Effect
Single-cycle plants convert only 35% to 40% of fuel energy into usable electricity, compared to roughly 60% for combined-cycle gas turbines. This gap means that for every megawatt-hour of electricity a data centre consumes via BTM generation, it is burning significantly more gas than would be required through a conventional utility supply chain.
This efficiency discount is often overlooked in headline demand forecasts. Furthermore, it means that even conservative data centre growth scenarios generate disproportionately large gas volume requirements when BTM configurations are accounted for, pushing total consumption well above what raw capacity figures would suggest.
Breaking Down the Volume Forecasts: 3 to 6.1 Bcf/d by 2030
What the Analysts Are Projecting
The leading forecasting organisations covering this demand shift have arrived at strikingly consistent conclusions, despite using different methodological approaches:
-
East Daley Analytics projects incremental natural gas demand from data centers of 4.2 to 6.1 billion cubic feet per day (Bcf/d) by 2030, tied to approximately 81 gigawatts of new gas-fired power capacity across roughly 290 identified infrastructure projects.
-
S&P Global estimates a base-case addition of 3 Bcf/d, with an upside scenario approaching 6 Bcf/d depending on how quickly supporting infrastructure can be built out.
A useful per-unit benchmark for evaluating individual project impact: a single 1 gigawatt data centre consumes approximately 140 million cubic feet per day (MMcf/d) of natural gas under BTM configurations. This figure allows investors to scale demand estimates against specific development announcements.
| Metric | Low Scenario (3 Bcf/d) | High Scenario (6.1 Bcf/d) |
|---|---|---|
| % of Total U.S. Gas Production | ~2.5% increase | ~5% increase |
| % of Power-Sector Gas Use | ~7% increase | ~15% increase |
| Starting Baseline (today) | Near zero | Near zero |
| Implied New Gas Capacity | ~40–50 GW | ~81 GW |
Even under the conservative scenario, this represents one of the single largest sectoral additions to U.S. natural gas demand ever recorded in a comparable timeframe. This is not a cyclical fluctuation. It is a structural realignment. The US natural gas price forecast reflects the growing weight of these structural tailwinds in market projections.
Infrastructure Constraints: The Hidden Bottleneck in the Gas Supply Chain
Why Pipeline Capacity Determines Winners and Losers
A nuanced but critically important dynamic in natural gas markets is regularly misread by both financial media and general investors: negative regional gas prices do not signal weak demand. They signal trapped supply.
When gas producing regions lack sufficient pipeline takeaway capacity, the commodity becomes stranded. Prices collapse locally, not because demand has evaporated, but because molecules cannot physically reach the buyers who need them. This distinction matters enormously for evaluating infrastructure investment opportunities in the context of rising data centre demand.
Regions with abundant gas production but insufficient midstream infrastructure will not automatically benefit from the structural demand surge. The value capture will flow to operators who have built or are building the pipe, compression, and distribution lateral capacity needed to connect supply with consumption points.
The Midstream Opportunity Set
The midstream sector, encompassing pipelines, compression stations, processing facilities, and distribution laterals, sits at the intersection of supply and demand in a way that is increasingly difficult to ignore. As data centre development clusters around gas-rich corridors, the infrastructure connecting those gas molecules to onsite turbines becomes as strategically critical as the turbines themselves.
Key geographic zones combining gas production infrastructure with growing data centre development activity include:
-
The Appalachian Basin (Marcellus and Utica shale formations), which holds some of the highest-volume, lowest-cost gas production in North America.
-
The Permian Basin, where associated gas production from oil operations creates substantial supply volumes requiring takeaway solutions.
-
Gulf Coast production zones, which offer direct access to LNG export infrastructure alongside domestic consumption points. The broader LNG supply outlook remains a critical variable shaping how these corridors develop over the coming years.
Latin America: The Overlooked Piece of the Energy Equation
One dimension of this story that receives almost no attention in mainstream energy coverage is the emerging strategic role of Latin America. Several nations in South and Central America possess surplus energy capacity relative to domestic consumption, a structural attribute that is attracting serious attention from U.S. technology sector operators seeking long-term power sourcing solutions.
Cross-border energy partnerships between U.S. technology companies and Latin American energy producers are already forming in early stages. For investors with exposure to high-quality energy assets in the region, this structural demand pull from the north represents a long-duration tailwind that operates independently of commodity price cycles.
Bridge or Foundation? The Duration Debate for Natural Gas in AI Infrastructure
The Case for Structural, Not Just Transitional, Demand
Corporate sustainability narratives frame natural gas as a temporary necessity, a bridge to be crossed and discarded once renewable alternatives scale. The engineering and economic realities, however, tell a more complicated story.
Gas infrastructure being commissioned today carries 20 to 30 year economic lifespans. Hyperscaler net-zero commitments are typically framed around 2030 to 2040 target windows, but the pace of renewable buildout, grid interconnection approvals, and battery storage cost reduction has consistently disappointed relative to projections. Meanwhile, electricity demand from AI is compounding against a baseline that is already rising from EV adoption, industrial onshoring, and manufacturing electrification.
The result is a scenario in which demand growth outpaces renewable deployment capacity not just through 2030, but potentially through the entire decade of the 2030s as well.
| Scenario | Gas Demand Peak | Key Transition Driver | Primary Risk |
|---|---|---|---|
| Rapid Transition | 2028–2030 | Accelerated nuclear SMR deployment + grid-scale storage | Permitting failures, cost overruns |
| Moderate Transition | 2032–2035 | Gradual renewable buildout + efficiency improvements | Intermittency, storage cost gaps |
| Slow Transition | 2038+ | Policy reversal, cost escalation, persistent grid delays | Stranded renewable asset risk |
Natural gas currently accounts for approximately 43% of U.S. power generation. Displacing that share requires simultaneous renewable buildout at a pace that has never been achieved historically, while serving a demand base that is growing faster than at any point since post-WWII electrification.
The next major ASX story will hit our subscribers first
The Investment Case: Natural Gas as Both Opportunity and Portfolio Architecture
Why Gas Remains Underweighted Despite Structural Tailwinds
Energy sector allocation within the S&P 500 sits near historically low levels even as structural demand indicators strengthen. Much of the institutional capital that might otherwise flow into high-cash-flow gas producers has instead chased critical mineral themes, rare earth projects, and niche commodity plays, many of which carry weak fundamental economics relative to their valuations.
There is an important portfolio construction logic to natural gas exposure that goes beyond directional price bets. For investors concentrated in metals and mining, particularly those with exposure to open-pit operations carrying significant diesel cost profiles, energy assets function as a natural hedge against input cost inflation. Understanding commodity prices and mining performance is consequently essential for investors seeking to navigate this cross-sector dynamic.
When energy prices rise and compress mining margins, a long position in gas producers or midstream operators partially offsets that pressure. When energy prices fall and mining margins expand, the hedge gives up value, but the portfolio as a whole benefits. This symmetry is difficult to replicate through other asset classes.
Structuring a resource portfolio without energy exposure is analogous to running a long-only commodity position with no consideration for the primary input cost that drives the economics of every project in that portfolio.
Where the Opportunity Concentrates
The most actionable segments of the natural gas investment landscape in the context of data centre demand growth include:
-
North American gas producers with established pipeline access to high-growth data centre development corridors, particularly in Appalachian, Gulf Coast, and Permian Basin regions.
-
Midstream infrastructure operators positioned to build out distribution and compression capacity in supply-constrained areas where BTM data centre projects are clustering.
-
Latin American energy companies, particularly those with surplus generation capacity and proximity to U.S. technology sector partnership interest, which represent an underfollowed but structurally compelling segment.
-
Private and restructuring opportunities within the energy sector, which currently offer more attractive entry dynamics than publicly traded mining assets at comparable points in their respective cycles.
The LNG Fungibility Constraint: Why Geography Is Not a Minor Detail
Unlike crude oil, natural gas cannot be shipped globally without expensive liquefaction and regasification infrastructure. LNG export capacity is expanding, but the cost and complexity of that process means North American gas pricing dynamics remain largely decoupled from global benchmarks. Regional pipeline access, local supply-demand imbalances, and infrastructure development timelines determine realised prices in ways that have no equivalent in oil markets.
Investors evaluating gas exposure must assess not just production volumes but the specific infrastructure pathways connecting those volumes to consumption. A producer sitting on substantial reserves in a pipeline-constrained region may realise dramatically different economics than a peer with equivalent reserves connected to high-demand corridors.
A Note on Critical Minerals: The Misallocation Risk
One investing perspective worth incorporating into the broader energy and resource discussion is a growing concern that institutional capital is being drawn into critical mineral plays without adequate scrutiny of the underlying business economics. The relationship between critical minerals and energy security is undeniably important, yet markets like rare earths and tungsten are structurally small. The total addressable market for these materials cannot absorb large capital allocations without distorting valuations beyond any fundamental justification.
The lithium market offered a recent case study: institutional enthusiasm drove valuations to unsustainable levels while the fundamentals of individual projects remained challenged. When sentiment reversed, the correction was severe. The lesson is that the label of strategic criticality does not substitute for the operational and financial analysis that any commodity investment requires.
By contrast, copper, gold, and silver represent large, liquid markets with structural supply constraints and identifiable demand drivers that are durable across multiple economic cycles. For investors seeking a sound commodities diversification strategy, the disciplined focus on these core metals alongside energy positions in natural gas offers a more defensible framework than chasing critical mineral thematic momentum.
Frequently Asked Questions: Natural Gas Demand from Data Centers
How much natural gas will data centres consume by 2030?
Current forecasts project 3 to 6.1 Bcf/d of incremental natural gas demand by 2030, rising from a near-zero baseline today. This represents a 2.5% to 5% increase in total U.S. gas production volumes and a 7% to 15% increase in power-sector gas consumption, placing it among the largest single-sector demand additions in U.S. natural gas history.
Why can't renewable energy replace natural gas for data centres?
Wind and solar are intermittent by nature and cannot provide the continuous baseload power that data centres require around the clock. Utility-scale battery storage remains too costly at the volumes needed. Grid interconnection queues extend 5 or more years in many regions, while behind-the-meter gas generation can be deployed in 12 to 24 months. The timeline mismatch is the decisive constraint.
What is behind-the-meter gas generation and why does it matter for demand?
BTM generation refers to onsite power plants built directly at data centre facilities, enabling operators to generate their own electricity without grid connection. The critical detail for gas demand is that BTM configurations typically use single-cycle turbines operating at 35% to 40% thermal efficiency, compared to 60% for grid-connected combined-cycle plants. This efficiency gap means each unit of electricity consumed requires significantly more gas input, amplifying total demand beyond what raw capacity figures suggest.
Which North American regions are best positioned in the gas supply chain?
Regions combining high-volume gas production with emerging data centre development activity hold the strongest economic positioning. The Appalachian Basin, Permian Basin, and Gulf Coast production zones offer the most favourable supply logistics. Regions with abundant production but insufficient pipeline takeaway capacity face stranded supply dynamics that depress local prices regardless of broader demand strength.
Is natural gas demand from data centers temporary or structural?
While often framed as a transitional measure, the infrastructure being built today carries 20 to 30 year economic lifespans. Combined with the compounding electricity demand from AI, industrial onshoring, EV adoption, and manufacturing electrification, natural gas demand from data centers could remain elevated well into the 2030s and potentially beyond, particularly if renewable deployment continues to undershoot projections.
How does Latin America fit into the data centre energy story?
Several Latin American nations hold surplus energy generation capacity relative to domestic consumption. U.S. technology companies are actively exploring cross-border partnerships to tap these resources as long-term power sourcing solutions. This creates a geographic investment angle that remains substantially underfollowed by mainstream energy analysts and institutional capital.
Key Takeaways
-
U.S. data centre electricity consumption is projected to nearly triple between 2023 and 2030, creating a power sourcing challenge without modern precedent.
-
Natural gas, delivered through behind-the-meter onsite generation, is the only energy source deployable fast enough to meet this demand within relevant development timelines.
-
Incremental gas demand of 3 to 6.1 Bcf/d by 2030 constitutes a structural market shift, not a short-cycle event.
-
Pipeline and midstream infrastructure constraints will determine which producers and operators capture value from rising natural gas demand from data centers.
-
The investment opportunity spans upstream producers, midstream operators, and Latin American energy assets, each offering distinct risk-return profiles.
-
For resource sector investors, natural gas exposure also functions as a portfolio hedge against energy cost inflation in mining operations, particularly those with high diesel exposure.
-
Critical mineral themes carry meaningful misallocation risk, while large liquid markets in copper, gold, silver, and natural gas offer more defensible structural positioning across multi-year cycles.
This article is for informational and educational purposes only and does not constitute financial or investment advice. All forecasts, projections, and market estimates referenced are drawn from third-party analytical sources and are subject to material uncertainty. Readers should conduct independent research and consult a licensed financial adviser before making any investment decisions.
Want to Be First When the Next Major ASX Resource Discovery Hits the Market?
Discovery Alert's proprietary Discovery IQ model scans ASX announcements in real time, delivering instant alerts on significant mineral discoveries across more than 30 commodities — turning complex data into actionable opportunities for both short-term traders and long-term investors. Explore historic discoveries and their remarkable returns, then begin your 14-day free trial at Discovery Alert to position yourself ahead of the broader market.