May 20, 2026
Understanding Natural Gas Markets as Economic Barometers
Market volatility in energy commodities reveals fundamental structural vulnerabilities that extend far beyond immediate price movements. When natural gas markets experience extreme price swings during weather events, these disruptions cascade through interconnected global supply chains, affecting everything from residential heating costs to industrial production schedules. U.S. natural gas prices surge due to Arctic cold events demonstrate the complex interplay between physical infrastructure limitations, financial market positioning, and macroeconomic transmission mechanisms that amplify initial demand shocks.
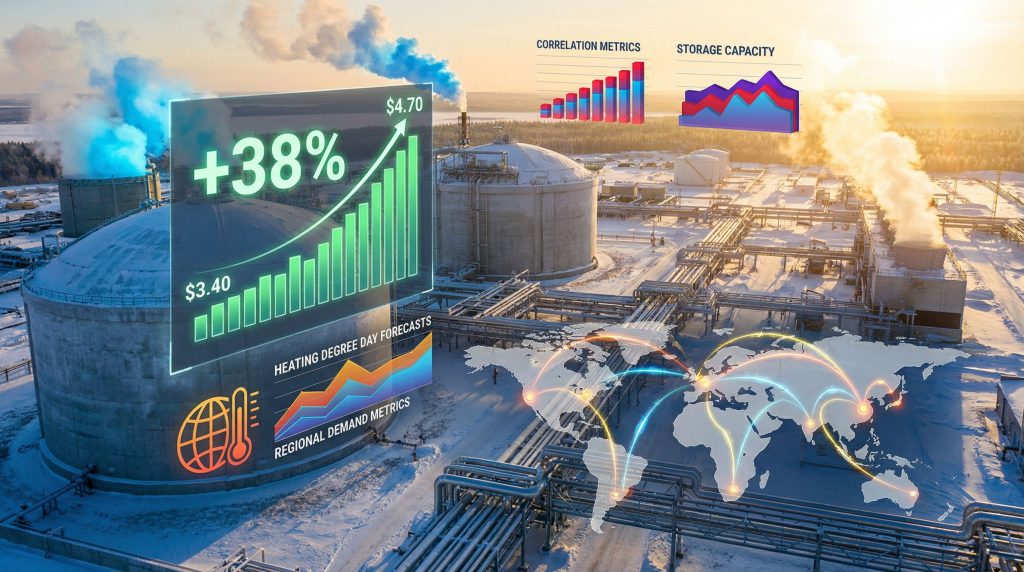
Natural gas futures serve as critical indicators of broader economic health, with price volatility often revealing underlying structural imbalances across energy infrastructure networks. The recent Arctic cold event demonstrated this relationship when U.S. natural gas prices surged from $3.40 per million British thermal units (MMBtu) on Monday to over $4.70 per MMBtu by early Wednesday, representing a total increase of approximately 38 percent over just two trading days. This price movement constituted the largest weekly gain in 35 years, according to market data, establishing new benchmarks for understanding weather-driven commodity price elasticity.
The Henry Hub pricing mechanism functions as the primary settlement point for NYMEX natural gas futures contracts, with price discovery at this Louisiana facility cascading through regional pricing hubs across North America. Weather forecasting data from the National Oceanic and Atmospheric Administration showed temperatures dropping to highs of 10s to 40s degrees Fahrenheit, with lows reaching -0s to 30s across the Midwest and East.
More concerning for supply systems, forecasts indicated lows of 0s-30s extending into North Texas, the South, and Southeast regions during the following week. The multiplier effect of financial positioning became evident through documented short covering activity, where traders who had previously bet on price declines were forced to purchase contracts at elevated levels to close positions.
This mechanism transformed an initial weather-driven demand surge into an accelerating price spiral, with Tuesday's 23 percent jump followed by an additional 22 percent increase early Wednesday. These dynamics illustrate how natural gas markets function not merely as physical commodity exchanges but as complex systems where financial architecture amplifies meteorological events.
Regional Infrastructure Vulnerabilities
Texas presents a particularly critical case study for understanding weather-related supply disruptions, given that the state contains approximately 25 percent of U.S. natural gas production capacity. The Permian Basin, located partially within Texas, represents one of the nation's largest natural gas-producing regions, making weather-related production interruptions at this location especially consequential for national price formation.
During extreme cold events, wellhead equipment faces physical risks from temperature conditions that can cause ice formation in separation equipment and pipeline systems. Natural gas production infrastructure operates within specific temperature design parameters, and when ambient conditions drop significantly below these specifications, water vapor in natural gas streams can form ice crystals through hydrate formation processes.
This physical phenomenon restricts flow through pipelines and processing equipment, potentially reducing or halting production entirely. Furthermore, compression equipment used for pipeline transportation may experience performance degradation or automatic shutdowns during extreme temperatures to prevent permanent equipment damage.
| Infrastructure Component | Cold Weather Risk | Typical Impact Duration |
|---|---|---|
| Wellhead equipment | Ice formation, flow restriction | 24-72 hours |
| Pipeline compressors | Performance degradation | 12-48 hours |
| Processing facilities | Shutdown protocols | 48-96 hours |
| Storage withdrawal systems | Capacity limitations | Extended periods |
Global Market Integration Through LNG Trade Flows
The transmission of price signals across geographically dispersed markets demonstrates the increasing integration of previously segmented natural gas regions through liquefied natural gas infrastructure. During the January cold event, Asian LNG spot prices reached $11 per MMBtu, representing a 40 percent increase from December lows, while European gas futures showed a 15 percent sympathy rally.
These correlations quantify the degree to which regional weather shocks now transmit across global market integration through LNG arbitrage mechanisms. Simultaneously occurring cold weather patterns across the Northern Hemisphere created synchronized demand surges that competed for limited global LNG supply capacity.
Winter weather drove heating demand higher in China, with the cold spell forecast to extend into February, according to Bloomberg reporting citing price data from the Shanghai Petroleum and Natural Gas Exchange. This global pattern suggests that Northern Hemisphere weather systems operate as correlated risk factors across LNG-importing regions, rather than isolated regional events.
The economic mechanics of LNG trade create price transmission channels between regional natural gas markets through arbitrage opportunities. When North American natural gas prices spike above certain thresholds, U.S. LNG export facilities become economically attractive destinations for gas that would otherwise supply domestic markets.
This shift in economic incentives means higher Henry Hub prices signal increased returns for LNG producers, encouraging maximum export production capacity utilization. However, these dynamics have significant LNG market implications for global supply chains and regional energy security.
Cross-Regional Demand Competition Dynamics
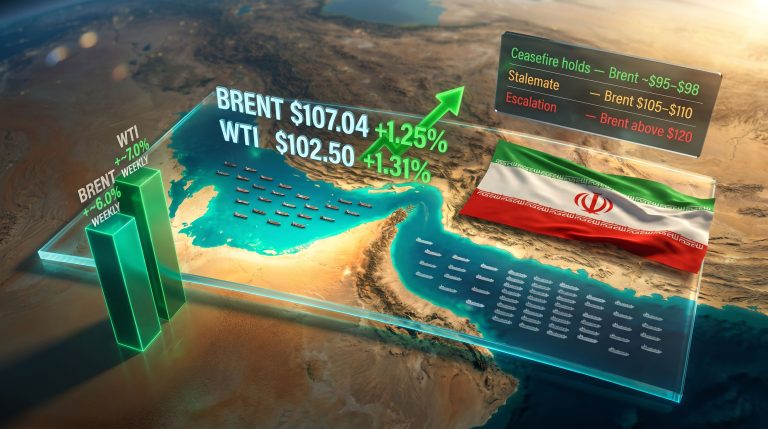
Market data revealed that crude oil prices remained relatively stable during the natural gas price surge, indicating that the commodity price shock was sector-specific rather than reflecting broad energy inflation pressures. This differential response provides insight into market structure characteristics, demonstrating that natural gas markets retain independence from broader petroleum complex movements despite increasing global integration through LNG trade.
The synchronized nature of Northern Hemisphere cold events created competition between regions for available LNG cargoes, with Asian importers competing directly with European buyers for spot market supplies. This competition mechanism explains how regional weather events in North America can influence pricing in markets thousands of miles away through the global LNG supply chain network.
Key Global Market Correlations:
- Asian LNG prices: $11/MMBtu (+40% from December lows)
- European gas futures: +15% sympathy rally
- North American exports: Maximum capacity utilisation
- Crude oil benchmarks: Relative stability maintained
Institutional Risk Management and Portfolio Implications
The magnitude of price volatility during weather events creates significant risk management challenges for institutional investors across multiple sectors. The documented 38 percent cumulative price movement over two trading days represents extreme volatility that energy-exposed portfolios must address through explicit volatility hedging strategies or face substantial profit-and-loss exposure from leveraged positions.
Utility companies operating gas-fired power generation facilities face immediate margin compression when input fuel costs spike during peak demand periods. Power generation gas consumption increased 25 percent week-over-week during the cold event, demonstrating the concentrated demand pressure that weather events impose on electricity generation systems dependent on natural gas for peaking power capacity.
Industrial consumers in price-sensitive sectors responded to elevated natural gas prices through demand curtailment programmes, with energy-intensive facilities such as aluminium smelters and fertiliser plants reducing operations when continued production became economically unviable. These operational decisions represent the economic response mechanism through which price signals influence institutional behaviour and industrial production schedules.
Financial Market Structure and Price Discovery
NYMEX natural gas futures contracts provide the primary risk management instruments for institutional energy sector exposure, with the Henry Hub contract serving as the benchmark for North American natural gas pricing. Options on these futures allow institutions to purchase price volatility protection, with put options increasing in value during price declines and call options gaining value during price increases.
Weather derivative instruments offer additional hedging mechanisms structured as index-based contracts that provide payoffs based on heating degree days (HDD) or cooling degree days (CDD) observed during specified periods. Utility companies may purchase HDD put options that increase in value when observed heating degree days fall below specified thresholds, offsetting revenue losses from lower-than-expected heating demand.
The role of algorithmic trading and high-frequency trading systems in amplifying initial weather-driven price movements has become increasingly significant in natural gas futures markets. These automated trading systems can execute thousands of transactions within seconds of meteorological forecast updates, creating additional volatility layers beyond fundamental supply-demand dynamics.
For investors seeking exposure to these markets, understanding the complexities outlined in an ETC investment guide becomes essential for navigating price volatility periods effectively.
Portfolio Risk Metrics During Volatility Events:
- Daily price range expansion: 200-300% of normal volatility
- Options implied volatility surge: 50-75% increase
- Margin call frequency: Significant increase for leveraged positions
- Cross-commodity correlation breakdown: Gas-oil price relationship weakened
Long-Term Economic Implications and Structural Changes
Weather-driven energy price volatility creates inflationary pressure transmission mechanisms that affect consumer purchasing power and monetary policy considerations. Residential heating cost escalation during extreme weather events reduces disposable income available for other consumption categories, while industrial input cost pass-through to manufactured goods pricing creates broader price level impacts across the economy.
The Federal Reserve monitors energy price movements as components of both headline and core inflation calculations, with natural gas price spikes potentially influencing interest rate policy decisions if volatility becomes persistent rather than temporary. Regional economic impact assessments become particularly important for energy-dependent states where natural gas production provides significant economic multiplier effects through employment and tax revenue generation.
International trade balance effects emerge from LNG export revenue fluctuations, with higher natural gas prices potentially improving trade balances for exporting nations while increasing energy import costs for consuming countries. These dynamics create macroeconomic feedback loops that extend beyond immediate energy market participants to influence currency exchange rates and capital flows.
Additionally, policy considerations around drilling policy shifts become more relevant as governments seek to balance energy security with environmental objectives during periods of market volatility.
Energy Transition Acceleration Factors
Extreme weather events and associated energy price volatility may accelerate renewable energy investment by highlighting the risks of fossil fuel price instability. Grid modernisation requirements for weather resilience become more economically justified when traditional energy sources demonstrate vulnerability to meteorological disruptions.
Energy storage deployment economics improve relative to gas peaker plant operations when natural gas prices experience frequent volatility spikes during peak demand periods. Battery storage systems and other grid-scale storage technologies provide price volatility hedging benefits beyond their technical grid stabilisation functions.
Geographic economic rebalancing patterns may emerge as businesses and residents consider energy cost stability when making location decisions. Manufacturing competitiveness shifts based on energy input cost differentials between regions, while population migration patterns could be influenced by long-term energy affordability considerations.
Long-Term Structural Implications:
- Renewable energy investment acceleration during price volatility periods
- Grid modernisation prioritisation for weather resilience
- Geographic industrial rebalancing based on energy cost stability
- Consumer behaviour adaptation to price volatility expectations
Risk Assessment Framework for Energy Market Volatility
Weather pattern predictability versus market positioning creates ongoing tension in natural gas futures markets, with meteorological forecasting improvements enabling better anticipation of demand surges while financial market positioning can amplify or dampen price responses to weather events. Storage inventory buffers relative to seasonal demand curves provide quantitative metrics for assessing whether price spikes reflect genuine physical scarcity or primarily speculative financial positioning.
Infrastructure capacity utilisation rates during peak demand periods offer insight into system resilience and bottleneck identification. Interstate pipeline capacity constraints, LNG export facility operational limits, and regional storage withdrawal capabilities all contribute to price formation during extreme demand events.
Opportunity identification mechanisms include volatility premium capture through options strategies, inter-market arbitrage between regional pricing hubs, and long-term supply contract valuations that may become attractive or unattractive during spot price spikes. These strategies require sophisticated understanding of both physical market fundamentals and financial market structure dynamics.
The complexity of modern energy markets means that Arctic cold events in North America can trigger price responses across global LNG markets, affecting economic stability in regions thousands of miles from the initial weather disturbance. Consequently, natural gas prices experienced their most dramatic surge in decades, with implications extending far beyond immediate commodity markets.
Market participants must recognise that weather-driven energy price shocks represent systemic risks that extend far beyond immediate commodity price movements, influencing everything from residential heating affordability to industrial competitiveness and monetary policy considerations.
Understanding these interconnected systems requires comprehensive analysis of physical infrastructure, financial market structure, and macroeconomic transmission mechanisms that transform meteorological events into economic disruptions with lasting implications for energy security and price stability. The recent surge in U.S. natural gas prices surge due to Arctic cold serves as a reminder of how weather events can rapidly transform market conditions across global energy systems.
Looking to Capitalise on Energy Market Volatility?
Discovery Alert's proprietary Discovery IQ model delivers real-time alerts on significant ASX mineral discoveries, including energy commodities that experience dramatic price movements similar to the natural gas volatility discussed above. Explore how major mineral discoveries can generate substantial returns by examining historic examples, then begin your 30-day free trial today to position yourself ahead of market-moving announcements across over 30 commodities.