
May 20, 2026
The Anatomy of an Oil Price Shock: When Words Become Weapons in Energy Markets
Energy markets have always been sensitive instruments, but the relationship between political language and crude oil pricing has grown more pronounced with each passing decade. Long before a single barrel is withheld from global supply chains, the threat of disruption alone is sufficient to move prices by hundreds of millions of dollars in aggregate market value. This dynamic sits at the heart of how modern oil markets function, and it explains why a single televised interview can trigger price movements that ripple across every economy on earth.
Understanding this mechanism matters now more than ever. As oil rises after Trump says he is losing patience with Iran, the events of May 15, 2026 offer a precise case study in how rhetoric, geography, and supply fundamentals intersect to create acute commodity market volatility.
When big ASX news breaks, our subscribers know first
How Geopolitical Language Becomes a Pricing Signal
Professional commodity traders operate within a framework that constantly weighs known supply and demand fundamentals against a more nebulous variable: the probability-weighted impact of future disruptions. This second category, commonly referred to as the geopolitical risk premium, does not require an actual supply shortfall to function. It requires only that market participants believe a shortfall is more likely than it was yesterday.
The mechanics are straightforward in theory but complex in practice. Furthermore, understanding these geopolitical oil price drivers helps clarify why verbal escalation so consistently precedes the most aggressive pricing responses:
- When a political leader issues statements that raise the perceived probability of military conflict, traders immediately reprice futures contracts to account for the possibility of supply disruption.
- This repricing happens in milliseconds through algorithmic systems that scan news feeds, social media, and official communications for predetermined trigger phrases.
- The initial move attracts momentum traders and short-covering activity, amplifying the directional move beyond what pure probability analysis would justify.
- Human traders then assess whether the move is technically or fundamentally supported and either reinforce or partially reverse it.
What this creates is a market structure where executive statements carry measurable economic consequences, regardless of whether the underlying events they describe ever materialise. Historical episodes, from the Gulf War of 1990–91 to the 2019 drone strikes on Saudi Aramco's Abqaiq facility, confirm that the verbal escalation phase of geopolitical crises consistently precedes the most aggressive pricing responses.
Brent, WTI, and the Week That Changed the Risk Calculus
The price movements recorded on May 15, 2026 were not isolated. They represented the culmination of a week-long repricing exercise as traders absorbed the implications of an ongoing conflict and a ceasefire that was generating more anxiety than confidence.
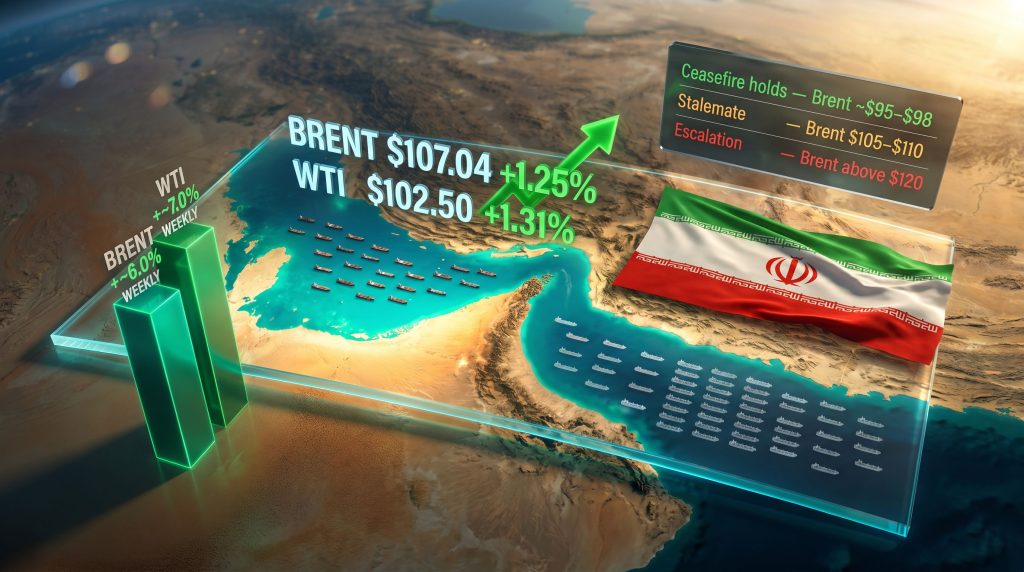
| Benchmark | Price at 7:25 a.m. Saudi Time | Daily Change (USD) | Daily Change (%) | Weekly Change (%) |
|---|---|---|---|---|
| Brent Crude Futures | $107.04/barrel | +$1.32 | +1.25% | ~+6.0% |
| WTI Crude Futures | $102.50/barrel | +$1.33 | +1.31% | ~+7.0% |
The weekly gain figures are arguably more instructive than the daily moves. A single-session spike of 1–1.3% can reflect algorithmic overreaction to a headline. A sustained weekly advance of 6–7% across both major benchmarks indicates that professional money managers have structurally reassessed their view of near-term supply risk and are holding, rather than fading, their long positions.
The specific catalyst on May 15 was Trump's appearance on Fox News, during which he communicated that his tolerance for the ongoing Iran negotiation process was approaching its limits. Markets interpreted this statement not as diplomatic pressure but as an escalation signal, raising the perceived probability that the existing ceasefire framework could collapse.
Compounding this were two maritime incidents that had occurred in the preceding 48 hours:
- A vessel was reportedly seized by Iranian personnel in waters near the UAE coast and directed toward Iranian territory.
- An Indian cargo ship transporting livestock from Africa to the UAE was sunk in waters off the coast of Oman.
These incidents were not abstract political events. They represented physical interference with commercial shipping, confirming that the threat environment was translating into real-world disruption.
The Strait of Hormuz: Geography as Destiny
No single geographic feature has a greater capacity to destabilise global energy markets than the Strait of Hormuz. This narrow passage, at its most constrained point measuring roughly 33 kilometres in navigable width, connects the Persian Gulf to the Gulf of Oman and from there to the broader Indian Ocean trading network.
Under normal operating conditions, the strait handles an extraordinary volume of global energy trade. The United States Energy Information Administration has historically estimated that approximately 20–21% of the world's total petroleum liquids and around 25–30% of globally traded liquefied natural gas transit through Hormuz annually. Consequently, disruptions to this corridor directly affect global LNG supply chains that span multiple continents. For the major Asian economies, the dependency is even more acute:
- Japan sources the overwhelming majority of its crude oil imports through Hormuz passage.
- South Korea faces comparable structural dependency.
- China and India, despite diversifying supply sources in recent years, remain heavily reliant on Gulf producers whose export infrastructure is anchored to Hormuz transit.
What makes Hormuz strategically irreplaceable is the absence of adequate alternative routing. The Suez Canal handles different vessel classes and tonnages and cannot absorb Hormuz-level throughput. Saudi Arabia's East-West pipeline (Petroline) can redirect some crude from Gulf terminals to Red Sea export points, but its capacity, at approximately 5 million barrels per day, covers only a fraction of normal Hormuz throughput.
The transit data cited by Iran's Revolutionary Guards during the conflict period illustrates just how severe the disruption had become. Approximately 30 vessels had crossed the strait since Wednesday evening, set against a pre-conflict daily average of roughly 140 vessels. Even accepting that partial recovery was underway, the gap between those two figures represents a structural supply shock already embedded in market pricing.
The significance of the 30-versus-140 vessel comparison extends beyond simple arithmetic. Each vessel transiting Hormuz typically carries between 1 and 2 million barrels of crude. The difference between 30 and 140 daily transits therefore implies a potential daily supply shortfall measured in the tens of millions of barrels, a figure that would exhaust strategic petroleum reserve release mechanisms within weeks if sustained.
Why Did Oil Prices Hold Near Session Highs Despite Partial Transit Recovery?
An important and frequently overlooked market dynamic emerged on May 15: oil prices held near their session highs even after Iran's reported vessel transit figures were released. This behaviour is technically significant.
Yang An, analyst at Haitong Futures, observed that while partial reopening of the strait provided some market relief, it was insufficient to reverse the directional trend driven by tight underlying supply conditions. The fact that prices swung multiple times intraday yet ultimately closed near daily highs reflects a market structure in which bears lacked sufficient fundamental justification to press prices lower.
The geopolitical risk premium was not the only fuel driving prices; it was acting as an accelerant on an already tight supply base. This distinction matters enormously for traders and policymakers alike. A geopolitically-driven rally built on pure fear tends to unwind rapidly once the precipitating threat recedes. A rally underpinned by structural supply tightness is far more durable and requires genuine fundamental change, not just diplomatic progress, to correct meaningfully.
The US-China-Iran Axis: Diplomatic Geometry and Market Implications
The geopolitical landscape shaping oil prices in May 2026 was not a simple bilateral confrontation. It involved a triangular dynamic between Washington, Beijing, and Tehran, with each leg of that triangle carrying distinct market implications. In addition, broader US-China trade tensions were adding a further layer of complexity to an already fraught diplomatic environment.
Trump's two-day state visit to Beijing provided the backdrop against which the oil market's most acute anxieties were playing out. The summit featured significant commercial activity and diplomatic symbolism, with Trump indicating that China had expressed interest in purchasing American oil as part of broader trade discussions.
US Trade Representative Jamieson Greer characterised China's posture toward Iran as pragmatic, noting in a Bloomberg interview that Beijing regarded open access to the Strait of Hormuz as a strategic priority. China is not merely a passive observer of the Iran conflict; it is a major consumer of crude oil that transits Hormuz, and it maintains established energy trade relationships with Iran.
Despite this apparent alignment of US and Chinese interests around Hormuz accessibility, the Beijing summit did not produce a breakthrough on the Iran situation. Vanda Insights' Vandana Hari characterised the situation precisely, noting that market focus had returned to the fundamental tension between a stalled diplomatic process and the possibility of military escalation intensifying.
The White House did confirm that Trump and Xi had reached agreement on the general principle of keeping the shipping lane open. However, in energy markets, agreement on principles and the operational reality of 30 daily vessel transits against a baseline of 140 are very different things.
Three Scenarios and Their Price Implications
| Diplomatic Scenario | Market-Implied Probability | Estimated Brent Impact |
|---|---|---|
| Durable ceasefire, Hormuz normalises | Moderate | Brent retreats toward $95–$98/barrel |
| Stalemate continues, partial disruption persists | Elevated | Brent holds $105–$110/barrel range |
| Ceasefire collapses, military escalation intensifies | Lower but rising | Brent could spike well above $120/barrel |
Disclaimer: These scenario projections are illustrative estimates based on available market commentary and analyst assessments. They do not constitute financial advice. Oil price forecasting involves significant uncertainty, and actual outcomes may differ materially from any modelled scenarios.
Supply Fundamentals: The Engine Beneath the Headline
One of the most important analytical points to extract from the May 15 market session is that geopolitics was functioning as a multiplier rather than the primary driver of the crude price rally. The underlying supply-demand balance in global oil markets had already tightened considerably before the Iran conflict introduced acute Hormuz risk into the equation.
This distinction has direct implications for how the market will behave under different diplomatic outcomes:
- If diplomacy succeeds and Hormuz normalises, the geopolitical risk premium will unwind, but the structural supply tightness will keep a floor under prices. Brent retreating to $95–$98/barrel under this scenario would still represent historically elevated pricing.
- If the stalemate persists, tight fundamentals and continued partial disruption reinforce each other, sustaining the current price range with upside bias on any escalation headline.
- If military escalation resumes, the combination of fundamental tightness and acute physical supply loss creates conditions for genuinely disorderly price movement, with Brent potentially breaching $120/barrel or beyond.
The concept of backwardation in the oil futures curve offers an additional technical signal. When near-term futures contracts trade at a premium to longer-dated contracts, it indicates physical market tightness and immediate supply concern. A steeply backwardated Brent curve in this environment would confirm that traders are not merely pricing in future risk but responding to present scarcity.
The next major ASX story will hit our subscribers first
What Key Indicators to Watch Going Forward
For investors, energy businesses, and policymakers monitoring this situation, several leading indicators will determine whether the current oil price environment stabilises, escalates, or corrects. Furthermore, geopolitical trade risks beyond the Hormuz corridor are also worth monitoring closely, as they could compound existing supply concerns.
- Daily Hormuz vessel transit counts: Any sustained move back toward 100+ daily transits would represent a meaningful risk premium reduction trigger.
- Ceasefire status communications: Official statements from Iranian and US negotiating teams carry immediate market-moving potential.
- US House Iran war powers vote: The US House narrowly rejected an attempt to constrain Trump's Iran war powers, keeping executive options open and preserving the geopolitical risk premium.
- UK-France Hormuz naval mission: A planned joint UK-French naval presence in the Hormuz region could, if operationalised, provide some additional security assurance to commercial shipping operators.
- OPEC+ production policy response: OPEC market influence will be critical to watch. If prices remain sustainably above $105/barrel, member nations face conflicting incentives between short-term revenue maximisation and the long-term demand destruction risk of sustained high prices.
- US-China oil purchase agreements: Any formal commitment by China to increase US crude purchases would carry symbolic and structural significance for global trade flows.
As ABC News reported, oil rises after Trump says he is losing patience with Iran, reflecting how quickly presidential rhetoric translates into measurable commodity market consequences. However, the more durable lesson from May 15, 2026 is that while geopolitical language ignites price action, it is the structural supply-demand balance that ultimately determines how far and how long that price movement is sustained. The oil market, in this respect, remains as much a barometer of global stability as it is a commodity.
This article reflects publicly available information and analyst commentary as of May 15, 2026. It does not constitute investment or financial advice. Oil markets involve significant volatility and uncertainty. Readers should conduct independent research and consult qualified financial advisors before making investment decisions based on commodity market conditions.
Want to Stay Ahead of Significant Commodity Discoveries Before the Broader Market?
While geopolitical tensions drive oil price volatility, savvy investors know that real wealth is often built by identifying major mineral discoveries the moment they are announced — Discovery Alert's proprietary Discovery IQ model delivers real-time ASX discovery alerts, turning complex commodity data into actionable opportunities, and you can explore how historic discoveries have generated substantial returns on the dedicated discoveries page before starting your 14-day free trial to gain an immediate market edge.