May 20, 2026
When Energy Markets Collide With Geopolitical Reality
Global energy markets operate on a foundational assumption: that the physical infrastructure underpinning international trade remains accessible. For decades, that assumption held, even through wars, financial crises, and pandemic-era demand collapses. What the events of early 2026 have demonstrated is that this assumption carries a fragility few market participants had fully priced.
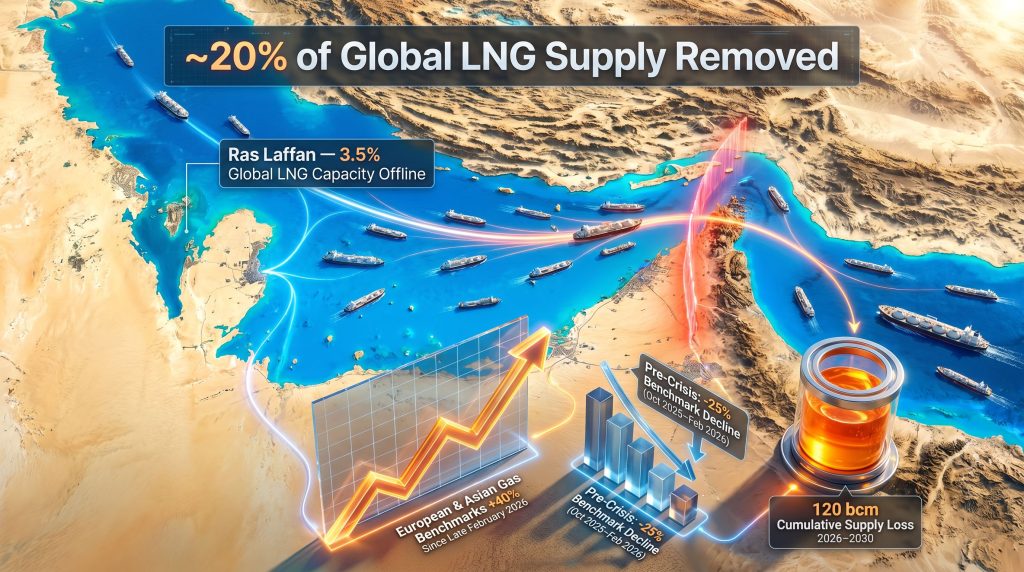
When a single maritime corridor accounts for roughly one-fifth of the world's traded liquefied natural gas, the closure of that corridor does not merely inconvenience importers. It restructures the entire supply architecture of global gas markets, potentially for years.
Understanding how the Middle East crisis disrupts international natural gas markets requires more than tracking price movements. It demands a layered analysis of infrastructure vulnerabilities, the mechanics of LNG trade, the cascading effects on secondary industries, and the medium-term investment implications for a commodity that underpins power generation, industrial production, and food security across multiple continents.
When big ASX news breaks, our subscribers know first
The Strait of Hormuz: Why One Waterway Holds the World's Gas Markets Hostage
The Strait of Hormuz is a narrow passage between Iran and the Arabian Peninsula, stretching approximately 39 kilometres at its narrowest navigable point. What makes it categorically different from other global shipping chokepoints is the concentration of LNG export infrastructure that depends on it exclusively.
Qatar's Ras Laffan Industrial City, the largest LNG export complex on the planet, sits on the Persian Gulf coastline. The UAE's export infrastructure similarly depends on Gulf access. Combined, these facilities have historically contributed a disproportionate share of global LNG supply, particularly for Asian buyers in Japan, South Korea, India, and China.
Critically, the largest LNG vessels — specifically the Q-Max and Q-Flex class ships that carry between 210,000 and 266,000 cubic metres of LNG — are too large to transit the Suez Canal fully laden. This means that when the Hormuz Strait becomes unavailable, these vessels have no viable alternative routing. The closure eliminates transit pathways rather than merely lengthening them.
Since early March 2026, the Strait has been effectively closed to LNG tanker traffic as a consequence of escalating conflict in the region. According to the International Energy Agency's Gas Market Report, Q2-2026, published on 24 April 2026, the disruption has removed close to 20% of global LNG supply from the market, representing one of the most severe shocks in the history of international gas trade.
What Percentage of Global LNG Supply Has Been Removed From the Market?
The 20% headline figure requires careful disaggregation to understand its full implications. It reflects two distinct but compounding disruption mechanisms operating simultaneously.
The first is the transit disruption: LNG cargoes that cannot physically move through the Strait from Gulf export terminals to global markets. This affects the full breadth of Qatari, UAE, and Saudi Arabian LNG export flows that would ordinarily transit this route.
The second is the infrastructure damage component: direct damage to LNG liquefaction facilities, most significantly at Qatar's Ras Laffan complex, where two liquefaction trains have been taken offline. This layer of the disruption persists independently of whether the Strait eventually reopens, because damaged production infrastructure requires multi-year repair programmes regardless of geopolitical resolution.
The table below summarises the disruption profile across affected supply sources:
| Disrupted Source | Estimated Supply Impact | Recovery Timeline |
|---|---|---|
| Strait of Hormuz closure (LNG transit) | ~20% of global LNG flows halted | Dependent on conflict resolution |
| Qatar Ras Laffan (two liquefaction trains) | ~3.5% of global LNG capacity offline | Multi-year repair window |
| UAE Fujairah terminal | Partial reduction in non-Strait export capacity | Months to years |
| Saudi Arabia Yanbu terminal | Reduced alternative export routing | Months to years |
| Israeli Eastern Mediterranean exports | Halted; Egypt and Jordan forced to spot markets | Conflict-dependent |
The IEA reports that global LNG production declined by 8% year-on-year in the immediate aftermath of the March disruption, with declines in Qatari and UAE exports only partially offset by increased output from other regions. Importantly, the agency noted that a more pronounced decline emerged in April, as disruptions cascaded through global supply chains, suggesting the initial 8% figure understated the developing severity of the shock.
The Ras Laffan Infrastructure Damage: Why This Is Not a Short-Term Problem
The distinction between a shipping route disruption and physical infrastructure damage is critical for understanding recovery timelines. Shipping route closures can theoretically resolve within days of a ceasefire or diplomatic breakthrough. Physical damage to LNG liquefaction trains, however, requires engineering assessments, procurement of specialised components, contractor mobilisation, and systematic recommissioning processes that cannot be compressed regardless of political will.
LNG liquefaction trains are among the most technically complex energy infrastructure assets in existence, involving cryogenic processing systems that cool natural gas to approximately -162 degrees Celsius. Damage to heat exchangers, compressor systems, or refrigerant circuits creates repair challenges that routinely extend into multi-year programmes even under optimal conditions. Ras Laffan's damaged trains represent a persistent capacity reduction that will suppress Qatari LNG export volumes regardless of how quickly the broader geopolitical situation evolves.
How Have Natural Gas Prices Responded to the Strait of Hormuz Disruption?
Price responses in both European and Asian gas benchmarks have been swift and substantial. According to the IEA, natural gas prices across key hubs surged more than 40% from late February 2026 levels during the peak volatility period in March, reaching their highest points since January 2023.
Furthermore, the current natural gas price trends place Europe in the historically unusual position of experiencing its second severe energy pricing shock within four years. The first followed Russia's invasion of Ukraine in 2022, which severed pipeline gas flows that had underpinned European energy economics for decades. The current disruption arrives before European markets had fully normalised from that earlier episode.
This compressed structural recovery period has re-exposed vulnerabilities that were only partially addressed through LNG import terminal expansion and supply diversification efforts.
The IEA has characterised the price response as reflecting genuine supply adequacy concerns rather than speculative positioning, noting that demand destruction measures implemented during the crisis have moderated further price escalation without resolving the underlying supply deficit.
What Moderated the Price Surge?
Three factors prevented prices from accelerating further beyond the 40% spike:
- Demand destruction: European natural gas demand contracted by approximately 4% year-on-year in March 2026, as industrial users reduced consumption in response to higher prices
- Renewable generation substitution: Stronger renewable electricity output in European markets displaced some gas-fired generation, reducing demand on the gas system
- Milder weather: Below-average cold weather conditions in some import markets reduced residential and commercial heating demand during portions of the disruption period
These moderating factors reflect important structural dynamics. However, the 4% demand decline should not be interpreted as a solution to the supply shortfall. A 20% supply removal cannot be offset by a 4% demand reduction without persistent price pressure and ongoing market tightness.
The Egypt and Jordan Case Study: Spot Market Exposure Amplified
Egypt and Jordan represent a particularly instructive case study in spot market vulnerability. Both countries had relied on Israeli Eastern Mediterranean gas exports as a primary supply source. The simultaneous halt of those exports during the broader regional conflict, combined with the Hormuz disruption driving LNG spot prices to multi-year highs, has created a compounding cost crisis for both nations.
Egypt's LNG import bill effectively tripled in March 2026 as the country was forced to procure emergency spot market cargoes at peak prices. This outcome illustrates a broader structural lesson: nations with high spot market dependency, or those relying on geographically concentrated supply sources without diversification optionality, face disproportionate exposure when supply shocks materialise.
The Fertiliser Industry: An Underappreciated Second-Order Impact
Natural gas is not solely an energy commodity. It is also the primary feedstock for nitrogen fertiliser production through the Haber-Bosch process. Gulf natural gas underpins approximately 12% of global nitrogen fertiliser production, meaning that the Hormuz disruption has transmitted price and availability shocks directly into agricultural input costs.
This linkage between LNG supply disruption and food production costs is rarely foregrounded in energy market analysis but carries significant implications for food price inflation in import-dependent developing nations.
What Was the State of Global LNG Markets Before the Crisis Struck?
The March 2026 disruption arrived at a moment when global LNG markets were transitioning toward their most favourable conditions in several years. The October 2025 to February 2026 heating season had been characterised by a notable confluence of supply growth and price easing, establishing a trajectory toward market surplus that has since been fully reversed.
| Pre-Crisis Market Indicator | Metric |
|---|---|
| LNG trade growth (Oct 2025 – Feb 2026) | +12% year-on-year |
| European and Asian benchmark price decline (same period) | ~25% reduction |
| Primary driver of supply growth | New North American liquefaction capacity |
| Pre-crisis market trajectory | Progressive rebalancing toward surplus |
According to the IEA, global LNG trade increased by 12% year-on-year during the October-to-February period, driven primarily by new liquefaction capacity entering service in North America. Simultaneously, benchmark prices in Europe and Asia declined by approximately 25% over the same five-month window, reflecting a market that was absorbing new supply more readily than demand growth could absorb.
The Renewable Energy Paradox in Gas Market Dynamics
An underappreciated dynamic from the pre-crisis period challenges a common assumption about the relationship between renewable energy deployment and natural gas demand. The IEA specifically noted that major winter storms across North America, Europe, and East Asia created strong demand spikes during the heating season, underscoring that rising renewable energy penetration does not reduce the requirement for gas supply flexibility.
The mechanism is counterintuitive to many observers. As power grids integrate higher shares of wind and solar generation, they become more exposed to periods when weather conditions simultaneously suppress renewable output and elevate heating demand. Natural gas remains the primary dispatchable backup for these conditions. Consequently, even amid accelerating energy transition pressures, gas supply flexibility requirements increase rather than decrease during periods of weather-dependent demand spikes.
How Is the Middle East Conflict Structurally Altering the Medium-Term LNG Supply Outlook?
The crisis has fundamentally altered the medium-term supply trajectory in ways that extend well beyond the immediate disruption period. The IEA's assessment identifies two compounding mechanisms driving the medium-term market tightness.
The combined effect of short-term supply losses and slower liquefaction capacity growth is projected to result in a cumulative loss of approximately 120 billion cubic metres (bcm) of LNG supply between 2026 and 2030, a figure that will sustain tighter-than-expected market conditions throughout this period.
The anticipated global LNG expansion wave, which was expected to progressively ease market tightness from 2026 onward, has been pushed back by at least two years. This delay reflects not only the direct loss of Qatari capacity but also the broader investment and planning disruptions created by the regional conflict, which affect project development timelines across the Gulf region. For further context, the LNG supply outlook had already signalled structural constraints before these disruptions materialised.
Can Alternative LNG Producers Fill the Gap?
The realistic assessment of alternative supply regions reveals a structural mismatch between the speed of the supply loss and the speed of potential replacement:
| Alternative Supply Region | Current Capacity Position | Ability to Offset Middle East Losses |
|---|---|---|
| North America (USA, Canada) | Expanding; new projects online | Partial offset over medium term |
| Australia | Mature capacity; limited near-term upside | Limited incremental contribution |
| Africa (Mozambique, Nigeria) | Developing; constrained by project delays | Modest contribution post-2027 |
| Eastern Mediterranean | Disrupted by regional conflict | Effectively offline near-term |
While North American LNG capacity expansion represents the most credible medium-term offset, the IEA confirms that replacement volumes from alternative regions will arrive too slowly to prevent sustained tightness through 2026 and 2027. The mismatch between the immediacy of supply loss and the multi-year lead times required to bring new capacity online is the defining characteristic of the current market environment.
The next major ASX story will hit our subscribers first
Which Importing Regions Face the Greatest Exposure to the Supply Crisis?
Not all importing regions face equivalent exposure. The distribution of vulnerability reflects structural differences in supply portfolio composition, contract arrangements, storage capacity, and demand-side flexibility.
Europe faces compounding structural exposure. Having already restructured its supply portfolio away from Russian pipeline gas following 2022, European buyers have progressively increased LNG's share of their supply mix. This diversification succeeded in replacing Russian volumes but simultaneously increased exposure to LNG spot market pricing and Hormuz-dependent supply. In addition, the European gas price pressures that preceded this crisis have further compressed the region's capacity to absorb new shocks.
Asian LNG importers, particularly Japan, South Korea, India, and China, face acute near-term exposure given the historically Asia-oriented nature of Gulf LNG export flows. Several Asian governments activated fuel-switching protocols and demand-reduction policy frameworks during the March 2026 volatility period. Japan's experience with supply security shocks, dating to the post-Fukushima LNG demand surge of 2011, provides some institutional context for managing disruption, though the scale of the current shock differs significantly.
Eastern Mediterranean importers, primarily Egypt and Jordan, face the most acute near-term cost pressures, absorbing the simultaneous loss of Israeli pipeline gas supply and the elevated spot market pricing of LNG alternatives.
Demand Destruction as a Market Balancing Mechanism
When supply shortfalls cannot be resolved through additional supply, markets balance through demand contraction. The demand-side response observed during March 2026 includes:
- European natural gas demand contracted by approximately 4% year-on-year in March 2026
- Stronger renewable electricity generation partially substituted for gas in European power systems
- Multiple Asian nations activated fuel-switching protocols and demand-reduction policy frameworks
- Milder weather in some import markets provided limited additional relief
Demand destruction is not a neutral market outcome. It typically manifests first in industrial gas users, where curtailment affects production levels, employment, and output across energy-intensive sectors including chemicals, steel, glass, and ceramics.
What Are the Geopolitical Factors Extending the Duration of Market Disruption?
The conflict escalation that triggered the Hormuz closure in early March 2026 originated in tensions involving the United States, Israel, and Iran, culminating in military actions that drew in Gulf regional infrastructure as secondary and tertiary targets. The specific sequence of events from late February 2026 onward created the operational conditions for LNG shipping disruption.
Iran's domestic political dynamics following recent leadership transitions have resulted in a hardline governance posture that reduces the probability of near-term diplomatic resolution. Energy security analysts have assessed that any further military actions targeting major Gulf LNG infrastructure could materially amplify the current supply shock beyond existing projections.
Qatari liquefaction infrastructure, UAE export terminals, and Saudi Arabian processing facilities remain within the geographic scope of potential future targeting. Analysis from the Institute for Energy Economics and Financial Analysis underscores that infrastructure vulnerability across the Gulf region remains a central risk variable in all medium-term supply projections.
The Eastern Mediterranean dimension adds a further complication for European supply security planning. Europe had identified Eastern Mediterranean gas development — including Cypriot, Israeli, and Egyptian offshore fields — as a strategic alternative to both Russian pipeline gas and Hormuz-dependent LNG. Regional conflict has disrupted that development pathway, removing what was expected to be a meaningful supply diversification option from Europe's medium-term planning horizon.
What Policy and Investment Responses Are Required to Stabilise Global Gas Markets?
The IEA's analysis identifies a clear set of structural responses required at both the policy and investment levels. The agency specifically highlights the advantages of diversified long-term contract portfolios for gas importers and calls for continued adequate investment across the LNG value chain.
The following framework summarises the key policy levers available to gas-importing nations:
- Accelerate long-term contract diversification: Reducing reliance on spot markets that amplify price exposure during acute supply shocks requires pre-committing to contracted volumes from geographically distributed supply sources
- Expand strategic gas storage capacity: Building buffer reserves that can absorb future disruption periods without forcing immediate spot market purchases at peak prices
- Invest in demand-side flexibility: Enabling rapid fuel-switching capabilities at industrial and power generation scale reduces the market impact of supply-side shocks by creating responsive demand reduction mechanisms
- Deepen bilateral and multilateral energy security agreements: Formalising supply assurance frameworks between producers and consumers creates institutional shock-absorbers for market disruptions
- Advance alternative supply corridor development: Accelerating project approvals and infrastructure development for non-Gulf LNG supply sources reduces the systemic concentration risk exposed by the Hormuz disruption
How Does the 2026 Hormuz Crisis Compare to Historical LNG Supply Disruptions?
Historical energy disruptions provide important context for evaluating the severity and duration of the current crisis:
| Disruption Event | Supply Removed | Duration | Primary Market Impact |
|---|---|---|---|
| 1973 Arab Oil Embargo | ~7% of global oil supply | ~6 months | Severe oil price shock; global LNG market nascent |
| 2011 Fukushima (Japan LNG surge) | Demand-side shock; ~30 bcm additional LNG demand | Multi-year | Asian LNG price premium sustained for years |
| 2022 Russia-Ukraine Gas Cutoff | ~150 bcm of European pipeline gas | Ongoing | European energy crisis; accelerated LNG infrastructure build |
| 2026 Hormuz LNG Disruption | ~20% of global LNG supply | Ongoing | Dual Asia-Europe price shock; 120 bcm projected loss 2026-2030 |
Several distinguishing characteristics set the 2026 Hormuz disruption apart from its predecessors. Unlike the 1973 oil embargo, which affected a market where LNG trade was minimal, the 2026 crisis hits a global gas market where LNG represents the primary mechanism for balancing regional supply deficits. Unlike the 2011 Fukushima shock, which was a demand-side increase rather than a supply-side loss, the current crisis removes existing supply from a market that was already operating without significant spare capacity buffers.
Unlike the 2022 Russia-Ukraine disruption, which primarily affected a single importing region through a single supply route, the Hormuz closure simultaneously impacts Asian and European buyers through the same supply mechanism. This simultaneity of impact across multiple major importing regions is the defining feature that makes the 2026 disruption structurally more complex than prior energy shocks of comparable magnitude. Understanding the broader US natural gas forecast is, furthermore, increasingly relevant as North American producers emerge as a partial counterweight to Gulf supply losses.
Frequently Asked Questions: Middle East Crisis and Global Natural Gas Markets
What Is the Strait of Hormuz and Why Does It Matter for LNG?
The Strait of Hormuz is a narrow maritime passage between Iran and the Arabian Peninsula through which approximately 20-25% of the world's LNG supply transits annually. Its effective closure to LNG tanker traffic beginning in March 2026 represents one of the most severe disruptions to global gas trade flows in the history of the LNG industry.
How Long Could the LNG Supply Disruption Last?
Based on the IEA's assessment, the disruption is expected to sustain tight market conditions through at least 2026 and 2027, with full recovery of damaged Qatari liquefaction infrastructure potentially extending well beyond that window given multi-year repair timelines. The Strait transit component could resolve faster than the infrastructure damage component if geopolitical conditions allow.
Which Countries Are Most Exposed to the Gas Supply Shock?
Nations with high dependence on Middle Eastern LNG imports, particularly in Asia (Japan, South Korea, India, China) and across Europe, face the greatest near-term exposure. Egypt and Jordan are experiencing the most acute spot market cost pressures due to the simultaneous disruption of Israeli Eastern Mediterranean gas exports.
Will New LNG Projects From the United States and Other Regions Fill the Gap?
New North American and other non-Middle Eastern LNG capacity is expected to provide partial relief over the medium term, primarily post-2027, but cannot fully substitute for the volume and speed of supply loss created by the Hormuz disruption within the immediate 2026-2027 timeframe. The lead times required for new capacity to enter production create an unavoidable gap period.
How Are Governments Responding to the Supply Crisis?
Governments across Asia and Europe are activating combinations of fuel-switching mandates, demand-reduction programmes, emergency storage draws, and accelerated bilateral supply negotiations to manage the near-term impact on energy systems and consumer prices.
Key Takeaways: The Structural Shift in Global Gas Market Dynamics
- The Strait of Hormuz closure has removed approximately 20% of global LNG supply from markets since March 2026
- Natural gas prices in Europe and Asia reached their highest levels since January 2023 during peak March 2026 volatility, surging more than 40% from late February baseline levels
- Qatar's Ras Laffan infrastructure damage accounts for approximately 3.5% of global LNG capacity offline with multi-year repair timelines
- A cumulative LNG supply loss of ~120 bcm between 2026 and 2030 is projected under current disruption scenarios
- The pre-crisis trajectory of market rebalancing, including 12% LNG trade growth and ~25% benchmark price declines during October 2025 to February 2026, has been fully reversed
- Gulf natural gas underpins approximately 12% of global nitrogen fertiliser production, extending the crisis's impact into agricultural input cost inflation
- Long-term contract diversification and enhanced international energy security cooperation are identified by the IEA as the primary structural responses required
- Rising renewable energy integration does not reduce gas supply flexibility requirements; it increases them during weather-driven demand spikes
This article incorporates data and analysis from the International Energy Agency's Gas Market Report, Q2-2026, published 24 April 2026. Readers seeking additional institutional context can explore the IEA's dedicated analysis at iea.org, including the agency's topic page on The Middle East and Global Energy Markets. This article contains forward-looking assessments based on current disruption scenarios; actual market outcomes will depend on geopolitical developments, infrastructure repair timelines, and demand-side responses that remain subject to material uncertainty.
Want to Stay Ahead of the Commodity Shifts Reshaping Resource Markets?
When supply shocks of this magnitude restructure global energy economics, the downstream effects ripple across exploration budgets, commodity valuations, and ASX-listed resource companies in ways that create both risk and opportunity. Discovery Alert's proprietary Discovery IQ model scans ASX announcements in real time, delivering instant alerts on significant mineral discoveries so subscribers can act before the broader market catches up — explore historic discovery returns on the dedicated discoveries page and start your 14-day free trial today.