
August 4, 2026
The Pricing Mechanism That Reveals Everything About Copper Supply
The copper market contains a largely overlooked pricing instrument that cuts through the noise of tariff-driven inventory shifts, geopolitical stockpiling, and headline price movements to reveal the true state of raw material availability. Treatment and refining charges, known collectively as TC/RCs, sit at the intersection of the mining and smelting industries and function as one of the most reliable real-time indicators of concentrate scarcity in global commodity markets. When these charges turn negative, the signal is unambiguous: the processing side of the copper supply chain is competing for insufficient raw material, and the balance of economic power has decisively shifted upstream toward the mines.
Understanding why negative copper treatment charges have become one of the defining features of the 2025 to 2026 copper market requires examining the mechanics of how copper moves from ore body to refined cathode, why the current structural mismatch between smelting capacity and mine output developed, and what the implications are for project valuations, investor positioning, and the medium-term supply outlook. Furthermore, the copper supply crunch has amplified the urgency of understanding these dynamics for investors at every level.
When big ASX news breaks, our subscribers know first
What TC/RCs Actually Measure and Why They Matter
The Mechanics of Concentrate Pricing
When a copper mine produces ore, the material undergoes flotation processing to create copper concentrate, typically containing between 25% and 35% copper along with recoverable quantities of gold, silver, and other payable metals. That concentrate is then shipped to a smelter, which processes it into refined copper cathode through smelting and electrolytic refining stages.
Historically, miners paid smelters for this processing service. The fee structure has two components:
- Treatment charges (TCs): Denominated in US dollars per dry metric tonne of concentrate, representing the smelter's base processing fee
- Refining charges (RCs): Denominated in US cents per pound of payable copper recovered, covering the electrolytic refining stage
Together, TC/RCs determine how the processing margin is divided between concentrate producers and smelters. The critical insight is that these charges are not set by regulatory bodies or fixed contracts; they emerge from the negotiating dynamic between miners with concentrate to sell and smelters with capacity to fill.
Market Signal Framework: When smelting capacity exceeds available concentrate, smelters compete for feed by accepting lower TC/RCs. When concentrate supply exceeds smelting capacity, miners accept higher TC/RCs to secure processing slots. The sign and magnitude of TC/RCs at any point in time therefore encode the underlying supply-demand balance with unusual clarity.
Annual Benchmarks Versus Spot Pricing
The TC/RC market operates on two parallel tracks. Annual benchmark rates are negotiated between major miners and smelters, typically at the start of each calendar year, and set the commercial baseline for long-term concentrate supply agreements. Spot rates reflect real-time transactions in the physical concentrate market and respond immediately to changes in concentrate availability.
The divergence between these two rates in 2025 and 2026 tells its own story. In addition, Codelco production trends have played a significant role in shaping how these benchmarks have evolved over recent years:
| Year | Annual Benchmark TC (US$/t) | Spot TC Range | Market Signal |
|---|---|---|---|
| 2021 | Positive (elevated) | Positive | Smelter-favourable conditions |
| 2022-2023 | Declining | Declining | Concentrate tightening |
| 2024 | Near-zero territory | Approaching zero | Structural shift underway |
| 2025 | Very low | -$40 to -$70/t | Negative territory confirmed |
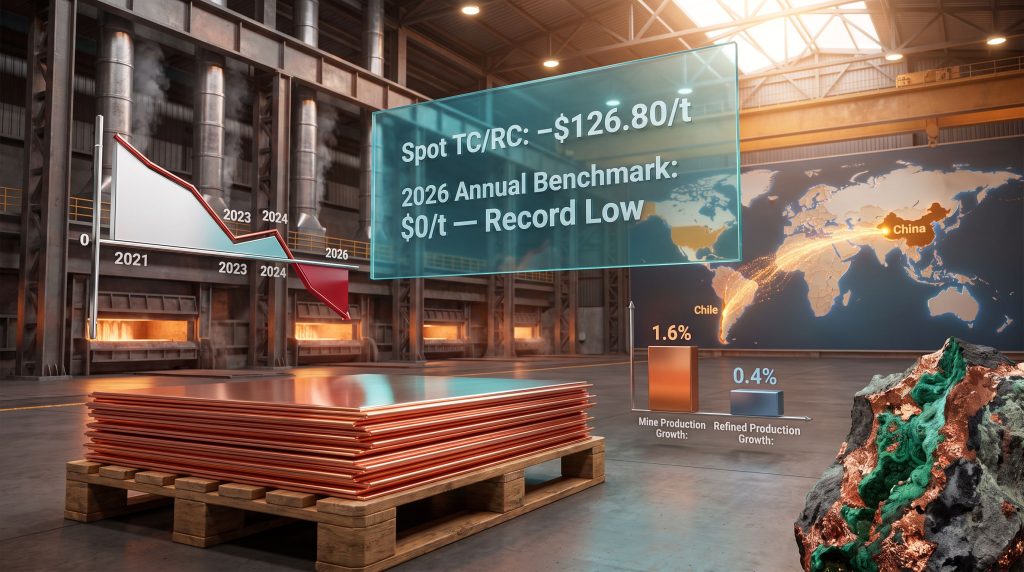
| 2026 | $0/t (record low) | -$126.80/t | Miners hold full pricing power |
The 2026 annual benchmark settling at zero dollars per tonne, agreed between Antofagasta and Chinese smelters, represents the lowest annual benchmark on record according to data tracked by S&P Global and the Shanghai Metals Market. The spot rate reaching -$126.80 per dry metric tonne by the end of June 2026 is a settled market transaction, not a projection or estimate. Reuters has reported extensively on the dual pricing crises now confronting copper smelters globally.
How Smelting Overcapacity Created a Structural Trap
China's Capacity Expansion and Its Unintended Consequences
The pathway to negative copper treatment charges began not with a sudden supply shock but with a decade-long expansion of Chinese copper smelting capacity that systematically outpaced the growth of global mine output. China added smelting capacity at a pace that assumed mine supply would grow proportionally, a reasonable assumption during periods of elevated commodity investment but one that failed to account for the capital cycle dynamics of copper mining.
This mismatch created what can be described as the smelter squeeze: as the ratio of available concentrate to processing capacity deteriorated, smelters faced falling capacity utilisation rates and rising fixed costs per tonne processed. Even before TC/RCs turned negative, many Chinese smelters were operating on thin margins supplemented by byproduct credits from gold, silver, and sulfuric acid recovery.
By 2026, the structural consequences became acute. China's largest smelters cut production by more than 10% in response to uneconomic processing fees, according to analysis from the Center on Global Energy Policy at Columbia University's School of International and Public Affairs. The Chinese government subsequently paused approvals for new smelter construction, an industrial policy response to an overcapacity problem that market pricing alone was not resolving quickly enough.
Shanghai Metals Market reported China's July 2026 copper cathode production at 1.1268 million tonnes, down 1.59% month on month and approximately 39,200 tonnes below projections, with difficulties procuring scrap anodes and scheduled maintenance contributing to the shortfall. Cumulative output for January through July 2026 reached 8.148 million tonnes, up 4.9% year on year, yet the International Copper Study Group forecasts refined production growth of just 0.4% for full-year 2026, a figure that underscores how constrained the upstream raw material pipeline has become.
Why Byproduct Credits Cannot Rescue Smelter Economics
A frequently misunderstood aspect of smelter economics is the role of byproduct revenue. Gold and silver credits recovered during smelting, along with sulfuric acid produced as a processing byproduct, partially offset operating costs. At moderately negative TC/RCs, these credits can sustain marginal profitability for smelters with favourable byproduct profiles.
At spot TC/RCs of -$126.80 per tonne, however, byproduct credits are mathematically insufficient to restore positive margins for standalone smelters without captive concentrate supply. This creates a two-tier smelting industry: integrated mining and smelting companies with their own concentrate feed remain viable, while independent smelters face structural losses that can only be resolved by either securing concentrate at the prevailing negative rates or reducing throughput. Bloomberg has documented China's strong opposition to zero or negative treatment fees, adding a geopolitical dimension to what is fundamentally a structural supply issue.
Chile's Production Ceiling and the Mine Supply Arithmetic
The Capital Intensity Problem in the World's Largest Copper Nation
Chile produces approximately one quarter of global copper output, making its production trajectory the single most important variable in the medium-term concentrate supply equation. The data from 2024 illustrates the challenge with unusual clarity: after deploying over US$50 billion in capital investment, Chile's incremental output growth amounted to approximately 100,000 additional tonnes from a base of roughly 5.43 million tonnes.
The return on invested capital for marginal tonnes of Chilean copper production has deteriorated significantly as ore grades decline and operations push into more geologically complex zones. Consequently, the Chile copper outlook for the medium term has become increasingly cautious among market analysts and institutional investors.
Codelco, the state-owned producer that accounts for a substantial share of Chilean output, has effectively retired its long-standing target of 1.7 million tonnes of annual production by 2030 from credible market expectations. The company is now managing toward output levels consistent with its 2025 production of approximately 1.33 million tonnes, with Cochilco conducting a preliminary audit of Codelco's 2025 reporting that introduces further uncertainty into the supply baseline. That audit, expected to conclude in September 2026, may revise the production figures that underpin current ICSG modelling.
Antofagasta, one of Chile's major private copper producers, reported first-half 2026 copper output declining 9.5% to 285,000 tonnes, with cash cost guidance raised to US$2.40-$2.60 per pound, partly reflecting disruptions in oil and feedstock markets. The company has also moved to spot-indexed concentrate sales contracts with some Chinese smelters, with a guaranteed price floor, a structural change in commercial relationships that would have been commercially inconceivable during periods of smelter-favourable pricing.
The Global Cash Cost Spectrum
Producer economics in 2026 are highly asymmetric across the cost curve, meaning copper price movements affect individual operators very differently:
| Cost Category | Cash Cost Range (US$/lb) | Margin Sensitivity |
|---|---|---|
| Low-cost producers | ~$1.90/lb | Profitable across most price environments |
| Mid-cost producers | ~$2.20/lb | Sensitive to price corrections below ~$3.50/lb |
| High-cost producers | ~$2.60/lb | Margin pressure intensifies below ~$4.00/lb |
This spread means that portfolio construction decisions within the copper sector require attention to individual cost profiles rather than assuming uniform exposure to copper price movements.
ICSG Supply Forecasts and the 2027 Surplus Question
The International Copper Study Group revised its 2026 mine production growth forecast downward to 1.6% from an earlier projection of 2.3%, with refined production growth of just 0.4% reflecting the limited concentrate reaching smelters. For 2027, the ICSG projects refined production growth accelerating to 3.0% if scheduled new mine supply delivers as planned, with an overall refined market surplus of 377,000 tonnes contingent on this supply materialising.
That 2027 surplus projection is the critical variable for investors evaluating the duration of the current concentrate scarcity premium. It is, however, a conditional forecast, not a guaranteed outcome.
The Concentrate Scarcity Premium in Project Valuations
Why the Valuation Framework Has Shifted
When smelting capacity exceeds concentrate supply, the incremental value of each additional tonne of concentrate increases because it is the binding constraint on refined output. This dynamic reprices copper development assets: the relevant question for investors is no longer simply how large a resource is, but how quickly that resource can become deliverable concentrate under current market conditions.
Investor Framework: In a concentrate-constrained market, development velocity matters as much as resource scale. A project that can advance from resource estimate to pre-feasibility study within an 18-month window may command a higher market premium than a larger but more distant project, even if the latter has greater ultimate scale.
Resource Classification and Its Financing Implications
Not all resource tonnes are equal in their capacity to attract project financing. The classification system matters enormously:
- Measured and Indicated resources can support mine planning, bankable feasibility studies, and project debt financing from institutional lenders
- Inferred resources require additional drilling before most financing institutions will underwrite project debt, representing a meaningful development hurdle
Selkirk Copper's 2026 Mineral Resource Estimate for the Minto Project in Yukon established 47.8 million tonnes in the measured and indicated categories, a 280% increase in tonnage from the 2025 estimate. The underground measured and indicated resource totals 26.0 million tonnes grading 1.14% copper, with a mine plan targeting 4,100 tonnes per day over 12 to 15 years. Roughly half of the increase in indicated resources reflects higher metal price assumptions and revised mine design parameters, with the balance attributable to drilling results.
The Minto Project also illustrates an increasingly important but underappreciated dimension of concentrate value: metallurgical quality. The operation produces a high-quality copper concentrate with meaningful gold and silver credits and low levels of deleterious elements such as arsenic, bismuth, and antimony. In a market where smelters are competing for scarce feed, concentrate quality and chemical cleanliness influence which projects attract offtake interest and financing.
Abitibi Metals has advanced the B26 copper-gold deposit in Quebec to a 2026 mineral resource estimate of 25.3 million tonnes grading 2.1% copper equivalent, containing 775 million pounds of copper, 471,000 ounces of gold, 16 million ounces of silver, and 376 million pounds of zinc. The company holds approximately C$44 million in cash with funding secured for up to 80,000 meters of drilling through 2027.
Copper-gold deposits of this character, combining scale with meaningful precious metal credits, represent an increasingly rare class of development asset in a market where major producers have publicly identified copper-gold as their most sought-after acquisition category.
The Four Criteria Determining Which Projects Capture the Scarcity Premium
- Resource confidence: Measured and Indicated classification versus Inferred, with the former commanding a financing and valuation premium
- Development pathway clarity: Existence of or defined timeline to a Pre-Feasibility Study or Preliminary Economic Assessment
- Capital intensity: Projects with lower upfront capital requirements are more accessible to a broader pool of financing institutions
- Jurisdiction and permitting certainty: Regulatory stability, existing infrastructure, and year-round site access determine development velocity
Fitzroy Minerals has completed 78 diamond drill holes totalling 13,036 meters at its Tenorita project, targeting completion of the drill-out program in August 2026 to support a Pre-Feasibility Study. When interpreting drill results from projects like Tenorita, the capital investment required to establish a copper operation in Chile benefits from existing regional infrastructure and a well-understood regulatory framework, factors that reduce development risk compared with projects in frontier jurisdictions.
New Supply on the Horizon: The Case for Near-Term Easing
Grasberg's Ramp-Up and Its Market Significance
The most consequential near-term variable in the concentrate supply equation is the Grasberg Block Cave operation in Indonesia, operated by Freeport-McMoRan. Production rates approximately doubled from around 34,000 tonnes per day in April 2026 to approximately 69,000 tonnes per day in June 2026. The operation is targeting approximately 65% of full district capacity in the second half of 2026, approximately 80% by mid-2027, and near full capacity by year-end 2027.
If this ramp-up trajectory holds, Grasberg alone represents a material addition to global concentrate availability within the ICSG's forecast window. The potential restart of Cobre Panama, subject to regulatory authorisation, would provide further incremental supply that could contribute to the projected 2027 refined surplus.
The Case for Structural Tightness Persisting Beyond 2027
Against the near-term supply recovery case, structural factors point to concentrate tightness persisting over a longer horizon:
- Declining ore grades at mature copper mines require rising capital expenditure per recoverable tonne, elevating the long-run marginal cost of supply
- The development timeline from discovery to production for a new copper mine typically spans 15 to 20 years, meaning exploration activity today cannot address a supply deficit within the current decade
- The energy transition's demand trajectory continues to add incremental copper requirements that existing mine pipelines may not fully satisfy
- Major new copper deposits of meaningful scale have been exceptionally rare discoveries; the Filo del Sol system in the Vicuna district represents one of the few large-scale discoveries in recent decades, attracting significant strategic interest from major mining companies including Rio Tinto, which agreed to a US$15 million strategic investment in Mogotes Metals in July 2026 to advance exploration at the Filo Sur project
| Scenario | Key Trigger | TC/RC Outlook | Refined Market Balance |
|---|---|---|---|
| Supply recovery (base case) | Grasberg ramp-up + Cobre Panama restart | Gradual return toward zero | 377,000t surplus (ICSG, 2027) |
| Extended tightness | Chilean underperformance + permitting delays | Spot rates remain deeply negative | Deficit persists into 2028 |
| Demand acceleration | EV adoption + grid investment above forecasts | Negative TC/RCs deepen further | Structural deficit scenario |
The next major ASX story will hit our subscribers first
Reading the Signals: What Investors Should Monitor
Five Indicators That Track Concentrate Market Direction
- Spot TC/RC levels (currently -$126.80/t): the most direct real-time measure of concentrate availability, reflecting actual settled transactions for physical feed
- Annual benchmark TC/RC settlements: set the commercial baseline for long-term concentrate supply agreements and signal the structural direction of the market
- SMM Imported Copper Concentrate Index: tracks Chinese import pricing for concentrate; a recovery above approximately -$50 per dry metric tonne would indicate improving supply conditions and potential for Chinese smelters to increase utilisation rates
- ICSG mine production growth and refined market balance forecasts: the authoritative medium-term supply-demand modelling framework, updated quarterly
- LME and SHFE refined copper stocks: LME stocks at 255,400 tonnes (down 6,900 tonnes at end of July 2026) and SHFE stocks below 70,000 tonnes provide a cleaner read on non-US market tightness than COMEX, which currently holds a record 644,465 tonnes reflecting metal relocated ahead of a potential US Section 232 tariff decision rather than genuine market abundance
Why COMEX Inventory Should Not Be Misread
The record COMEX stockpile represents one of the more significant analytical pitfalls in current copper market analysis. Metal moved to the United States ahead of a potential Section 232 tariff decision constitutes a geographic redistribution of existing refined inventory, not new mine supply entering the market. Interpreting this stockpile as evidence of global copper abundance would systematically mislead any supply-demand assessment.
TC/RCs measure transactions for physical concentrate feed and are therefore structurally resistant to this kind of policy-driven distortion. A smelter paying -$126.80 per tonne for concentrate is not doing so because global copper is abundant; it is doing so because the raw material it needs to operate is genuinely scarce.
The Capital Cycle Dimension
Underinvestment, Lag Effects, and the Current Moment
The negative copper treatment charges environment of 2025 to 2026 did not emerge from a single supply disruption. It is, however, a symptom of a capital cycle that has been building for over a decade. Underinvestment in copper mine development during the 2010s, driven by lower prices and elevated project risk aversion, created a structural supply gap that is now manifesting in processing economics.
The capital cycle in mining operates with a 10 to 20-year lag between investment decisions and production outcomes. This means the concentrate shortage currently visible in TC/RCs reflects investment decisions, and non-decisions, made years ago. The pricing environment, if sustained, should in theory incentivise new mine investment, but permitting timelines, capital costs, and jurisdictional risk continue to compress the supply response rate.
For developers advancing projects toward feasibility, this creates a timing imperative. Definitive feasibility studies have become increasingly pivotal in determining which projects can reach financing milestones before the ICSG's projected 2027 refined surplus materialises and TC/RCs ease back toward less negative or potentially positive territory. Projects that miss that window face a more competitive capital environment and a less compelling fundamental narrative.
Disclaimer: This article is intended for informational purposes only and does not constitute financial advice. Forward-looking statements, supply forecasts, and project timelines involve significant uncertainty. Mineral resource estimates, production guidance, and cost projections referenced herein are sourced from public company disclosures and independent research organisations and may change materially. Investors should conduct their own due diligence and seek independent financial advice before making investment decisions in the mining sector.
Want to Track the Next Major Copper Discovery Before the Market Does?
Discovery Alert's proprietary Discovery IQ model delivers real-time alerts on significant ASX mineral discoveries — cutting through market noise to surface actionable opportunities the moment they are announced, whether you are a short-term trader or a long-term investor positioning ahead of the copper supply crunch. Explore how historic mineral discoveries have generated substantial returns on Discovery Alert's dedicated discoveries page, and begin your 14-day free trial today to secure a genuine market-leading edge.