
August 24, 2026
Why Open-Pit Scale and Dual-Commodity Design Define Tier-One Gold Mining
Large-scale open-pit gold operations occupy a unique position in the global mining hierarchy. Their ability to process enormous volumes of ore at relatively low operating costs per tonne gives them an economic resilience that underground or smaller surface operations struggle to replicate. When a porphyry-hosted orebody also carries meaningful copper mineralisation alongside gold, the structural advantages compound further, creating a cost profile that can remain competitive even when gold prices soften.
This is the architecture underpinning Newmont Boddington mine gold production, and it explains why the Western Australian operation attracts close attention from investors, analysts, and industry observers whenever Newmont reports quarterly results.
When big ASX news breaks, our subscribers know first
Boddington's Geological Foundation and Structural Advantages
The Porphyry System Beneath the Darling Range
Boddington sits within the Saddleback Greenstone Belt in Western Australia's Darling Range, approximately 130 kilometres southeast of Perth. The deposit is a gold-copper porphyry system, a geological classification that distinguishes it from the shear-hosted lode gold deposits that define much of the broader Western Australian goldfields. Porphyry systems form when mineralised fluids associated with magmatic intrusions cool and precipitate metals across large, disseminated volumes of rock.
This geological character has two important consequences for the mine's operating model:
- Ore tonnage over grade: Boddington processes very high volumes of relatively low-grade ore rather than chasing high-grade, narrowly defined mineralisation. The plant treats tens of millions of tonnes annually to generate its gold and copper output.
- Dual-metal extraction: Gold and copper are both extracted through a combined flotation and carbon-in-leach processing circuit, with copper concentrate produced alongside gold doré. This dual-stream output is a defining feature that separates Boddington from single-metal Australian gold producers.
The porphyry classification also means that Boddington's resource base is genuinely large-scale, supporting decades of open-pit mining without requiring the kind of deep underground transition that constrains mine life at many high-grade operations. Indeed, large-scale open-pit mines of this type are among the most capital-efficient in the world.
Gold Equivalent Ounces and Why Reporting Methodology Matters
Investors evaluating Newmont Boddington mine gold production data need to understand the distinction between gold-only output and gold equivalent ounce (GEO) reporting. Newmont has stated that Boddington consistently delivers over 800,000 gold equivalent ounces annually when copper production is converted to its gold equivalent using prevailing commodity prices. However, gold-only production figures sit in the 560,000 to 800,000 ounce range depending on mine sequencing and grade.
The copper by-product credit mechanism operates through the all-in sustaining cost (AISC) calculation. Revenue generated from copper concentrate sales is subtracted from the total cost of gold production, reducing the reported AISC per gold ounce. Furthermore, at copper prices above $4.00 per pound, this credit is meaningful enough to push Boddington's reported AISC well below the unhedged cost of comparable gold-only Australian operations.
Newmont Boddington Mine Gold Production: A Decade in Review
Year-by-Year Output Trends (2016 to 2026)
The production trajectory at Boddington over the past decade reveals a story of cyclical performance driven by mine sequencing, ore grade variability, and processing optimisation rather than any fundamental decline in reserve quality.
| Year | Gold Production (approx.) | Context |
|---|---|---|
| 2016 | ~800,000 oz | Peak historical output |
| 2018 | ~709,000 oz | Moderate grade normalisation |
| 2020 | ~670,000 oz | Operational continuity maintained through COVID-19 |
| 2021 | ~696,000 oz | Recovery phase begins |
| 2022 | ~798,000 oz | Near-peak resurgence |
| 2023 | ~745,000 oz | Gradual output normalisation |
| 2024 | ~590,000 oz | Notable step-down driven by sequencing |
| 2025 (guidance) | ~560,000 oz | Lowest guidance band in recent years |
| 2026 (guidance) | ~580,000 oz | Modest second-half weighted recovery |
The output step-down between 2022 and 2024 reflects planned pit progression through lower-grade zones, not reserve depletion. This distinction is critical for investors interpreting production guidance reductions as structural impairment rather than sequencing-driven variability.
Understanding the Grade-Volume Trade-Off in Open-Pit Mining
A concept that is often underappreciated by investors outside the technical mining community is the grade-volume trade-off inherent in large open-pit operations. As an open pit deepens and expands laterally, miners inevitably cycle through zones of varying ore quality. At Boddington, ore grades across different bench levels within the pit vary considerably, and the sequence in which these zones are accessed is planned years in advance.
When a mine plan requires accessing lower-grade transitional material to reach higher-grade ore at depth, annual output dips even while long-term reserve quality remains intact. The guidance reduction from approximately 800,000 oz in 2022 to around 560,000 oz in 2025 aligns with this sequencing dynamic. The modest recovery projected in 2026 guidance, toward approximately 580,000 oz, is consistent with the mine plan beginning to access improved-grade ore domains. Moreover, those interested in interpreting drill results will recognise how block model data informs these sequencing decisions.
Q2 2026 Performance: What the Numbers Actually Reveal
A 44% Quarterly Surge and Its Operational Drivers
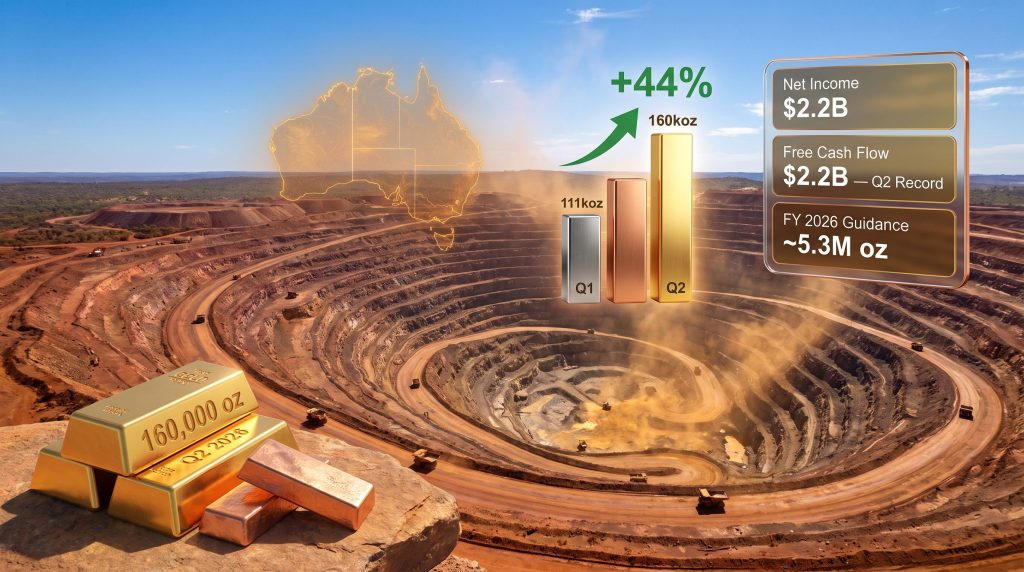
Newmont Boddington mine gold production reached 160,000 ounces in the June 2026 quarter, rising from 111,000 ounces in the March quarter — a gain of 49,000 ounces representing a 44% quarter-on-quarter increase. Copper output moved from 3,000 tonnes to 5,000 tonnes over the same period, a 67% uplift in by-product volume.
The drivers behind this acceleration are multi-layered:
- Improved ore feed grade as the mine plan progressed into higher-grade zones within the active pit stages during Q2.
- Processing plant throughput recovery following any maintenance or operational interruptions in Q1.
- Metallurgical recovery improvements where ore type and mineralisation character allows more efficient gold and copper extraction through the processing circuit.
- Copper mineralisation distribution within the porphyry system, which does not always mirror gold grade distribution, explaining why copper output can surge proportionally more than gold in certain quarters.
Boddington as a Portfolio Stabiliser During the Cadia Crisis
The broader significance of Boddington's Q2 2026 output surge becomes apparent when examined alongside Newmont's Cadia operation in New South Wales. Cadia gold production collapsed from 94,000 ounces to 34,000 ounces quarter-on-quarter, while copper output fell from 21,000 tonnes to 7,000 tonnes, following seismic events that disrupted underground operations. Newmont confirmed that Cadia returned to normal operating levels by mid-June.
Boddington's 49,000 oz sequential gain absorbed a significant portion of this shortfall. Combined with Tanami's contribution of 90,000 ounces in Q2, up from 82,000 ounces in Q1, Newmont's Australian assets collectively functioned as a production buffer for the global portfolio. In addition, understanding the gold price impact on miners helps contextualise why this output buffer carried significant financial weight during the period.
Global Portfolio Context: Where Boddington Sits in Newmont's Production Architecture
Q2 2026 Australian Asset Comparison
| Asset | Location | Mine Type | Q2 2026 Gold Output | Quarter Change |
|---|---|---|---|---|
| Boddington | Western Australia | Open-pit | 160,000 oz | +44% |
| Tanami | Northern Territory | Underground | 90,000 oz | +10% |
| Cadia | New South Wales | Underground | 34,000 oz | -64% |
Across Newmont's entire global portfolio, attributable gold production reached approximately 1.29 million ounces in Q2 2026, down just 1% sequentially despite the Cadia disruption. Full-year 2026 guidance remains intact at approximately 5.3 million attributable ounces, with 51% of annual output weighted toward the second half of the year.
Boddington vs. Tanami: Two Fundamentally Different Operating Models
While both Boddington and Tanami serve as foundational Australian contributors to Newmont's production base, they operate under entirely different geological and cost frameworks.
| Metric | Boddington | Tanami |
|---|---|---|
| Mine type | Open-pit | Underground |
| By-product | Copper (concentrate) | None |
| AISC structure | Reduced by copper credits | Higher, no by-product offset |
| Grade character | Low-grade, high-volume porphyry | Higher-grade, narrower lode |
| Q2 2026 output | 160,000 oz | 90,000 oz |
Underground operations like Tanami carry inherently higher unit costs due to development expenditure, ground support requirements, ventilation infrastructure, and the cost of accessing ore at depth. Boddington's open-pit model distributes these capital costs differently, and the copper credit benefit further compresses reported AISC to levels that underground peers cannot easily match. Furthermore, the copper market trends driving by-product pricing add an additional layer of financial resilience to Boddington's cost structure, and copper market trends in 2025 and beyond are expected to remain favourable for operations with significant by-product exposure.
Financial Performance and Cost Structure in Q2 2026
Record Free Cash Flow Against a Rising Cost Backdrop
Newmont's Q2 2026 financial results demonstrated the revenue leverage available when gold prices remain elevated even as operating costs increase. Key metrics included:
| Financial Metric | Q2 2026 Result |
|---|---|
| Net Income | $2.2 billion |
| Cash from Operating Activities | $2.9 billion |
| Free Cash Flow | $2.2 billion (Q2 record) |
| Capital Returned to Shareholders | $1.9 billion |
| Gold By-product AISC | $1,621 per ounce |
Gold by-product AISC increased 58% from Q1 to Q2 2026, reaching $1,621 per ounce. The primary contributors were elevated sustaining capital expenditure across the portfolio and incremental costs associated with the Cadia shutdown and recovery. It is important to note that this is a portfolio-level AISC figure, not an asset-level Boddington-specific cost, meaning Boddington's individual AISC — benefiting from copper credits — sits within a different and typically lower range than the consolidated group figure.
Newmont's President and Chief Executive Officer Natascha Viljoen described Q2 2026 as a period of strong operational and financial performance, noting that the company "produced approximately 1.3 million attributable gold ounces, generated record second-quarter free cash flow of $2.2 billion, and remained on track to achieve full-year guidance." She also noted that the company "returned $1.9 billion to shareholders through quarterly dividends and ongoing share repurchases while continuing to invest in the long-term strength of the business."
The next major ASX story will hit our subscribers first
Capital Investment and the Tailings Infrastructure Question
Why H2 2026 Capital Weighting Matters
Capital expenditure at Newmont is heavily skewed toward the second half of 2026, with 58% of total sustaining expenditure and 63% of total development expenditure concentrated in H2. For Boddington specifically, this includes confirmed tailings infrastructure investment alongside equivalent works at Cadia and Tanami. You can find further detail on Newmont's extension plans for the mine, including how capital is being deployed to extend operational longevity.
Tailings Storage: The Silent Constraint on Mine Longevity
At large-scale open-pit operations processing tens of millions of ore tonnes annually, tailings management is one of the most consequential infrastructure challenges. The volume of processed rock material that must be safely stored grows continuously, and tailings storage facility (TSF) capacity constraints can become a binding production limit if not proactively managed.
Key considerations for Boddington's tailings investment include:
- Regulatory compliance: Western Australia's Department of Mines, Industry Regulation and Safety applies strict standards to TSF design, monitoring, and staged heightening approvals. Proactive investment ahead of capacity thresholds maintains regulatory compliance and avoids production interruptions.
- Long-term operational continuity: For a mine with Boddington's multi-decade reserve base, TSF capacity is a genuine long-term constraint. Investment now extends the usable life of existing facilities before more capital-intensive new cell construction becomes necessary.
- ESG and community expectations: Post the Brumadinho and Samarco tailings failures in Brazil, global standards for TSF management have elevated significantly. Tier-one operators like Newmont face heightened scrutiny on tailings governance, and proactive capital investment in this area carries reputational as well as operational value.
The H2 2026 allocation for Boddington tailings work, combined with deferred Cadia Panel Cave 1-2 expenditure now reintegrated into H2 plans, reflects a capital programme that was partially disrupted in H1 by the seismic events and is now being executed at an accelerated pace in the second half.
Long-Term Outlook: Scenario Analysis for Boddington's Production Recovery
What Could Drive a Return to Higher Output Levels?
| Scenario | Key Enablers | Assessment |
|---|---|---|
| Grade recovery through mine sequencing | Access to higher-grade pit zones in later stages | Moderate probability, plan-dependent |
| Throughput expansion via processing upgrades | Capital investment in mill capacity or efficiency | Moderate-low without formal commitment |
| Copper price uplift improving GEO metrics | Sustained copper prices above $4.50/lb | Market-dependent, not mine-specific |
| Gold price above $3,000/oz enabling marginal ore | Sub-economic ore zones become viable to process | High probability if prices hold |
A factor that deserves particular attention is the interaction between gold price and cut-off grade economics. In open-pit mining, the cut-off grade — the minimum ore grade that is economically worth processing rather than sending to the waste dump — is dynamically recalculated as metal prices change. When gold sustains prices above $3,000 per ounce, ore that would previously have been classified as waste at Boddington may become economically processable, effectively expanding the ore inventory available without requiring any new drilling or resource declaration.
This mechanism, sometimes called dynamic cut-off grade optimisation, is a speculative but analytically credible pathway through which elevated gold prices could push Newmont Boddington mine gold production back toward or above the 650,000 to 700,000 oz range even without new capital investment in mill capacity.
Frequently Asked Questions: Newmont Boddington Mine Gold Production
How much gold does Boddington produce annually?
Annual gold production at Boddington has ranged from approximately 560,000 to 800,000 ounces over the past decade. The 2025 guidance of approximately 560,000 oz represents the lower end of this historical range, while the 2026 guidance of approximately 580,000 oz anticipates a modest sequential recovery.
Is Boddington Australia's largest gold mine?
Boddington is consistently ranked among the top two or three largest gold-producing mines in Australia by annual output. Its combination of scale, open-pit operating model, and dual gold-copper production distinguishes it from other major Australian gold operations. However, those interpreting drill results from emerging Australian projects will note that several challengers are developing rapidly.
What is Boddington's copper production?
Copper is produced as a by-product concentrate alongside gold. Q2 2026 saw copper output reach 5,000 tonnes, up from 3,000 tonnes in Q1 2026. Annual copper production varies alongside gold output and ore grade variability within the porphyry system.
Why did Boddington's production jump in Q2 2026?
The 44% quarter-on-quarter increase in Q2 2026 reflected improved ore feed grades as mine sequencing progressed into higher-grade pit domains, combined with stronger processing plant performance and throughput recovery.
What is Newmont's full-year 2026 gold production guidance?
Newmont has maintained full-year guidance of approximately 5.3 million attributable gold ounces globally, with 51% of this output weighted toward the second half of 2026. Boddington and Tanami are among the assets expected to contribute to H2 growth alongside Lihir, Cerro Negro, and Brucejack.
This article contains forward-looking statements and scenario analysis based on publicly available information and general industry knowledge. Production guidance figures and financial results are sourced from Newmont's Q2 2026 earnings release. Readers should not rely on this content as financial or investment advice. Past production performance is not a reliable indicator of future output. Investors should conduct independent due diligence before making any investment decisions.
Further reporting on Newmont's Australian operations and broader developments across the gold and copper mining sectors is available through Australian Mining.
Want to Catch the Next Major ASX Gold or Copper Discovery Before the Market Does?
Discovery Alert's proprietary Discovery IQ model delivers real-time alerts on significant ASX mineral discoveries — instantly translating complex geological and commodity data into actionable investment insights for both short-term traders and long-term investors. Explore Discovery Alert's dedicated discoveries page to understand how historic mineral discoveries have generated substantial returns, and begin a 14-day free trial to position yourself ahead of the broader market.