July 11, 2026
The Price Level That Rewrites the Rules
Few numbers in global commodity markets carry the weight that US$100 per barrel does for crude oil. It is not simply a psychological milestone — it is a threshold that historically triggers a cascade of economic consequences far beyond the energy sector itself. When oil sustains itself above this level, inflation forecasts are revised upward, central bank policy paths narrow, and equity capital begins rotating with urgency from growth-sensitive sectors toward commodity-leveraged ones.
Understanding whether oil is preparing for another US$100 breakout requires more than tracking a headline price. It demands a structural reading of supply architecture, geopolitical risk concentration, and the buffer mechanisms that have historically absorbed shocks before they become crises. Right now, several of those buffers are thinner than they have been in decades.
When big ASX news breaks, our subscribers know first
What the Last Surge Revealed About Market Fragility
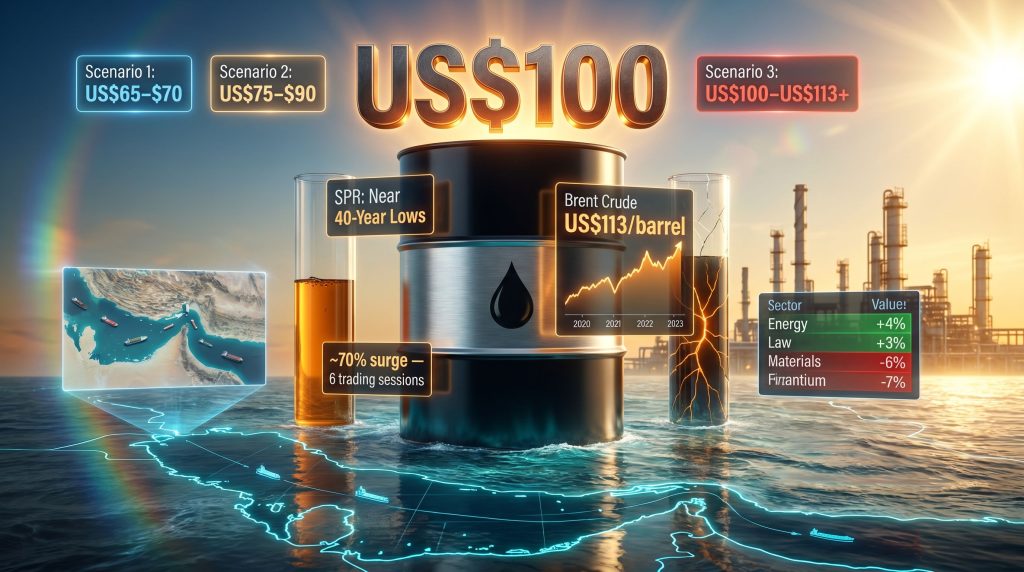
Earlier in 2026, crude oil delivered one of the most compressed and violent price accelerations in recent commodity market history. Within fewer than six trading sessions, prices surged by more than 70% — a move that, under the right positioning framework, transformed modest capital into extraordinary returns. The scale and speed of that event were not random.
Commodity markets have a well-documented tendency to enter periods of low volatility and compressed price ranges before releasing energy in a single, decisive directional move. Traders describe this as coiling — the longer and tighter the compression, the more powerful the eventual breakout. What the 2026 surge demonstrated is that when a genuine physical supply threat intersects with thin speculative positioning and depleted buffer capacity, repricing can occur faster than most retail participants can respond.
The most significant lesson from the 2026 move is not the magnitude of the gain — it is the speed. Preparation before price confirmation, not reaction after it, separates those who benefit from those who watch.
This is why the current setup deserves careful analysis. The crude oil price trends show that oil has since retraced sharply, returning to approximately US$70 per barrel after its earlier peak. That mean reversion is a textbook pattern following geopolitically-driven spikes. However, beneath the surface, the structural drivers that ignited the original move have not been resolved.
What Is Driving the Renewed Push Toward US$100 Oil in 2026?
The Strait of Hormuz: Chokepoint Economics
The Strait of Hormuz is not merely a strategic waterway — it is the single most consequential chokepoint in the global energy system. Approximately 20% of the world's daily oil and LNG supply transits through this narrow corridor between Iran and Oman. There is no viable alternative route for much of this volume, particularly from Persian Gulf producers including Saudi Arabia, the UAE, Kuwait, and Iraq.
Iran's renewed obstruction of commercial vessel movement through the Strait beginning in late February 2026 introduced structural uncertainty into forward pricing curves that had previously assumed relatively unimpeded flow. Insurance premiums for vessels transiting the region escalated sharply, and spot pricing responded accordingly. Furthermore, the critical distinction for investors is that disruptions at a chokepoint of this magnitude do not simply raise prices — they alter the entire risk architecture of the global oil market.
The Military Escalation Premium
Following renewed attacks on commercial shipping, the United States executed strikes against more than 80 Iranian targets. The response from Tehran and the broader geopolitical signalling that followed embedded a substantial risk premium into Brent crude. At the peak of the escalation cycle, Brent briefly touched US$113 per barrel — confirming that market participants regard the US$100 threshold not as a ceiling but as a staging point under genuine supply shock conditions.
Perhaps more significant from a supply disruption perspective is the strategic status of Kharg Island, which handles the overwhelming majority of Iran's crude export throughput. Any military action targeting this facility would not simply reduce Iranian supply at the margin — it would remove a major node from the global oil system with limited near-term replacement capacity. Analysts examining oil market impacts note this risk remains severely underpriced by many retail investors.
The Strategic Petroleum Reserve Problem
The United States Strategic Petroleum Reserve (SPR) represents the government's primary tool for dampening oil price shocks through emergency supply releases. In 2022, coordinated SPR releases played a meaningful role in capping crude's upside following Russia's invasion of Ukraine. That tool is now significantly impaired.
The SPR currently sits near its lowest level since the early 1980s — a multi-decade low that fundamentally limits Washington's capacity to intervene in the market if disruptions deepen. This structural weakness is often underappreciated by investors focused on current price levels rather than the institutional mechanisms that have historically provided a price ceiling.
Russia's Compounding Supply Constraints
The Middle Eastern disruption risk does not exist in isolation. Ongoing attacks on Russian refinery infrastructure and energy logistics have been progressively compressing global refined product availability throughout 2026. In addition, questions surrounding global LNG supply have added further complexity. When dual-front supply pressure from both the Persian Gulf and Russian export channels is considered together, the global supply environment is materially tighter than headline inventories suggest.
Has Oil Done This Before? A Historical Pattern Analysis
Three Precedents That Defined the US$100 Oil Playbook
| Historical Event | Timeframe | Crude Price Trajectory | Key Supply Trigger |
|---|---|---|---|
| 2008 Global Commodity Boom | 2007–2008 | Rose above US$140/barrel | Demand surge + speculative positioning |
| Arab Spring and Iran Sanctions | 2011–2012 | Sustained US$100–$120 range | MENA supply disruption + sanctions |
| Russia-Ukraine Conflict | Feb–Mar 2022 | Spiked to approximately US$130/barrel | Russian export uncertainty |
| 2026 Middle East Escalation | Early 2026 | Approximately 70% surge in 6 trading days | Strait of Hormuz obstruction |
Each of these episodes shares a defining structural characteristic: a credible physical supply threat colliding with insufficient buffer capacity. In 2008, it was record-low spare OPEC capacity. In 2011, it was the simultaneous removal of Libyan barrels during Arab Spring. In 2022, it was the SPR being drawn down precisely because Russia's supply was being sanctioned out of the market.
In every prior episode, crude oil's gravitational pull toward the US$100 to $110 range proved powerful once the triggering condition became entrenched. Whether prices sustained that level depended entirely on whether the supply threat was resolved or deepened.
What Are the Scenarios for Oil Prices From Here?
Scenario 1: Diplomatic Resolution (Bearish for Oil)
If a verified ceasefire between the US and Iran is established, Hormuz shipping lanes are confirmed open, and diplomatic channels produce binding commitments on Iranian nuclear and maritime behaviour, the geopolitical risk premium embedded in crude would unwind rapidly. Under this scenario:
- Brent crude likely retreats toward the US$65 to $70 range
- Speculative long positions built during the escalation phase would be unwound
- Energy sector equity outperformance would reverse, with capital rotating back toward growth sectors
Scenario 2: Sustained Standoff (Range-Bound Oil)
A prolonged diplomatic stalemate, with neither major escalation nor resolution, would likely produce a consolidation environment in crude. Under this scenario:
- Crude settles in the US$75 to $90 range with elevated intraday volatility
- Energy producers benefit from sustained prices above cash cost thresholds
- Uncertainty suppresses capital expenditure decisions from major oil companies, gradually tightening future supply
Scenario 3: Full Supply Disruption Escalation (Bullish for Oil)
Military action targeting Kharg Island, a full or near-full closure of the Strait of Hormuz, or a significant additional deterioration of Russian export capacity could drive a second major price surge. Under this scenario:
- Brent crude tests and potentially sustains above US$100 to $113
- Inflation re-accelerates globally with a 4 to 8 week lag into headline CPI
- Central banks face an acute policy dilemma between fighting energy-driven inflation and supporting slowing growth
How Energy Markets Signal a Breakout Before It Happens
Reading the Price Structure
The fact that oil has returned to approximately US$70 per barrel following its earlier surge is itself analytically significant. Mean reversion of this nature — where an explosive geopolitical move is subsequently fully retraced — creates what technical analysts call a re-accumulation zone. These are price regions where the market tests whether the underlying supply concern was temporary or structural.
Traders experienced in commodity cycles often treat the retest of pre-event levels not as a signal that the threat has passed, but as a second entry window before the next directional move confirms itself. The discipline required is to wait for price to confirm before committing capital — not to anticipate what feels inevitable. For a broader perspective, Proactive Investors provides analysis on whether oil is genuinely positioned for another US$100 breakout.
The Futures Curve as a Supply Signal
The shape of the crude oil futures curve carries information that spot prices alone cannot convey. When the curve trades in backwardation — where near-term contracts are priced higher than later-dated ones — it signals that physical supply is tight right now. Deepening backwardation during a geopolitical escalation period is one of the strongest leading indicators that a sustained price move is building from a fundamental rather than speculative foundation.
Sector Rotation as a Leading Indicator
Perhaps the most accessible signal for equity investors is sector performance itself. During the week in review, the Energy sector rose more than 4% while Materials fell more than 6% — one of the sharpest single-week divergences between these two sectors in recent memory. Within the ASX top 100, Santos advanced more than 7% and Woodside Energy climbed more than 5%, both substantially outperforming the broader index.
This kind of sector leadership shift is not noise — it reflects institutional capital making deliberate allocation decisions based on a forward view of commodity prices. When energy equities begin leading while the broader index struggles, it frequently precedes further commodity price confirmation. Consequently, the market volatility reset currently underway is amplifying these sector rotation signals considerably.
The next major ASX story will hit our subscribers first
What a US$100 Oil Breakout Means for the Broader Economy
Sector Winners and Losers in a High-Oil Environment
| Sector | Typical Impact | Key Mechanism |
|---|---|---|
| Energy (Oil and Gas) | Strongly Positive | Direct revenue uplift from higher commodity prices |
| Airlines and Transport | Strongly Negative | Fuel cost surge compresses operating margins |
| Consumer Discretionary | Moderately Negative | Disposable income erosion from higher fuel costs |
| Industrials | Mixed | Input cost pressure offset by energy capex demand |
| Utilities | Mixed | Gas price linkage varies significantly by market |
| Materials (Gold) | Potentially Positive | Inflation hedge demand increases |
Sustained crude prices above US$100 per barrel historically feed into headline consumer price indices with a 4 to 8 week lag. For central banks already navigating elevated core inflation in several major economies, an energy-driven price shock of this magnitude would severely complicate the rate-cutting calculus that many market participants had been pricing in for late 2026. Furthermore, gold safe-haven demand typically strengthens in parallel as investors seek inflation protection during sustained energy price shocks.
The Australian Context
Australia occupies a nuanced position in this dynamic. As a significant LNG exporter, higher crude and gas prices benefit major domestic producers including Woodside and Santos directly. However, Australia is a net importer of refined petroleum products, meaning sustained Strait of Hormuz disruption elevates domestic fuel costs, contributes to imported inflation, and increases operating costs across transport, agriculture, and logistics sectors simultaneously. The BBC has reported extensively on the broader geopolitical dimensions shaping these energy market dynamics.
Five Key Indicators to Monitor Before the Next Breakout
- Strait of Hormuz vessel transit data — real-time shipping volumes and war-risk insurance premiums serve as the most immediate gauge of physical supply risk
- US SPR inventory reports — weekly EIA data that quantifies the remaining emergency buffer available to dampen price spikes
- Iranian crude export flows — satellite tanker tracking services monitoring throughput from Kharg Island provide independent verification of export disruption
- Brent crude futures curve shape — deepening backwardation signals tightening physical supply ahead of spot price moves
- Energy sector equity momentum relative to the broader index — sustained outperformance, as seen with Santos and Woodside in the current week, frequently precedes commodity price confirmation
Frequently Asked Questions: Oil and the US$100 Breakout Threshold
Could oil realistically reach US$100 again in 2026?
Current structural conditions — including active Strait of Hormuz disruption risk, near-40-year lows in the US SPR, and ongoing Russian supply constraints — are materially similar to prior episodes that drove Brent into the US$100 to $110 range. The fact that Brent briefly reached US$113 during the 2026 escalation peak confirms the market's demonstrated capacity to reach these levels when supply assumptions shift rapidly.
What would prevent oil from reaching US$100?
A verified diplomatic resolution between Washington and Tehran, confirmed reopening of Hormuz shipping lanes, or a coordinated emergency release from major consuming nations' strategic reserves could all rapidly unwind the geopolitical risk premium embedded in current pricing.
Why did oil fall back to US$70 after the initial surge?
Geopolitically-driven commodity spikes routinely experience full mean reversion once the immediate supply threat is partially priced in and diplomatic signals emerge. Speculative positions built during the escalation phase are unwound systematically, pulling prices back toward pre-event levels. This pattern has repeated across every major oil shock episode since 2008. However, the retracement does not necessarily signal the underlying risk has disappeared.
This article is general in nature and does not constitute financial advice. Past performance and historical price patterns are not reliable indicators of future results. Readers should consider their own circumstances and consult a licensed financial adviser before making investment decisions. Commodity markets involve significant risk, including the potential loss of capital.
Want to Position Yourself Ahead of the Next Major Commodity Move?
When energy markets shift as rapidly as they did during the 2026 crude surge, timing is everything — Discovery Alert's proprietary Discovery IQ model delivers real-time alerts on significant ASX mineral discoveries, instantly translating complex commodity signals into actionable opportunities for both short-term traders and long-term investors. Explore how historic discoveries have generated substantial returns on Discovery Alert's dedicated discoveries page, and begin your 14-day free trial today to secure a market-leading edge before the next major move confirms itself.