August 9, 2026
When Energy Chokepoints Become Weapons: The New Architecture of Global Oil Risk
The history of commodity markets is punctuated by moments when a single geographic bottleneck transforms from an infrastructure feature into the most consequential variable in global economic forecasting. The Strait of Hormuz has occupied that role intermittently for decades, but what is unfolding in mid-2026 represents something categorically different from previous episodes of Persian Gulf tension. This is no longer a risk premium layered onto an otherwise functioning market. It is a fundamental repricing of the structural fragility embedded in global energy supply chains, one that carries direct consequences for everything from crude benchmarks to mining sector margins.
When big ASX news breaks, our subscribers know first
Oil Above $85 on Middle East Crude Flow Risks: Understanding the Inflection Point
For most of the second quarter of 2026, oil markets were grinding lower under the weight of demand uncertainty and softening forward curves. That narrative collapsed within the span of three trading sessions. Brent crude surged 12% across just three days, crossing above $85 per barrel on July 16, 2026, and in doing so erased approximately 30% of a quarterly price decline in a matter of days.
WTI simultaneously traded at $80.27/bbl, with the spread between the two benchmarks narrowing sharply as both reflected an identical underlying catalyst: a geopolitical disruption severe enough to override demand fundamentals entirely.
The $85 threshold is not arbitrary. It represents the boundary between a market pricing normal supply-demand oscillation and one incorporating what analysts call a structural risk premium — a persistent elevation in price that reflects systemic vulnerability rather than transient tightness. When oil above $85 is driven by geopolitical oil market dynamics of the current magnitude, historical analogies begin pointing toward the 1973 embargo era rather than the Gulf War or the COVID supply shock.
When a commodity recovers three months of losses within a single week, the market is communicating something more fundamental than a short-term supply squeeze. It is signalling a re-evaluation of the entire architecture through which that commodity reaches global consumers.
The Strait of Hormuz: From Geographic Feature to Geopolitical Weapon
How the Strait Functions Under Normal Conditions
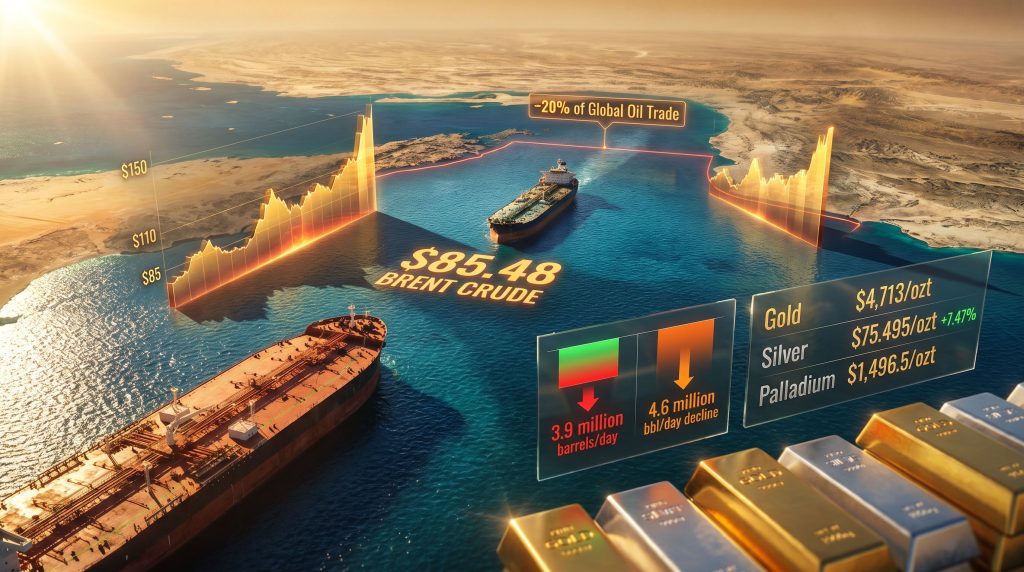
The Strait of Hormuz is a narrow waterway approximately 33 kilometres wide at its narrowest navigable point, separating the Persian Gulf from the Gulf of Oman. Under peacetime conditions, it functions as the primary export corridor for Saudi Arabia, Iraq, the UAE, Kuwait, and Qatar, collectively accounting for roughly 20% of all global oil trade that transits this single passage daily.
What makes the Strait uniquely irreplaceable is the absence of scalable alternatives. Saudi Arabia's East-West pipeline and the UAE's Abu Dhabi Crude Oil Pipeline provide partial bypass capacity, but neither system can absorb the full volume of Persian Gulf exports. For most Gulf producers, the Strait is not a preferred route; it is the only route. The IEA's analysis of Middle East energy markets provides further context on just how structurally critical this corridor remains for global supply stability.
The Collapse in Traffic: What the Data Shows
The quantitative evidence of disruption is stark. Since hostilities resumed, the seven-day moving average of oil flows through the Strait has fallen by 4.6 million barrels per day, arriving at just 3.9 million barrels per day. Tanker traffic has collapsed by more than 95% from pre-conflict baselines.
| Metric | Data Point |
|---|---|
| Share of global oil trade through the Strait | ~20% |
| Pre-conflict estimated daily flow | ~8.5 million barrels/day |
| Post-escalation 7-day average flow | 3.9 million barrels/day |
| Net daily barrel reduction | 4.6 million barrels/day |
| Estimated tanker traffic decline | More than 95% |
An important complication in assessing the true scale of disruption is the prevalence of vessels operating without Automatic Identification System (AIS) transponders, a practice known in maritime intelligence as running dark. Dark shipping has been a defining feature of sanctions-related crude movements for years, meaning that even pre-conflict traffic data likely understated actual throughput. This makes the post-disruption decline potentially even more severe than official flow estimates suggest.
US Central Command confirmed that American naval assets were providing escort for a double-digit number of commercial vessels crossing the Strait in a single overnight period, a detail that illustrates how fundamentally military logistics and energy logistics have become intertwined.
The Bab el-Mandeb: A Second Front Emerges
While global attention has concentrated on Hormuz, a second maritime chokepoint is now directly in play. The Bab el-Mandeb strait, connecting the Red Sea to the Gulf of Aden, had been functioning as a partial relief valve for Saudi Arabian exports diverted away from Hormuz. Iran reportedly communicated to Yemen's Houthi movement that the Red Sea route should be closed in response to further strikes on Iranian power infrastructure.
If both chokepoints were restricted simultaneously, the global oil market would lose access to two of its five major maritime energy arteries at the same time. No planning scenario in modern energy security history has had to grapple with this combination. Strategic petroleum reserve frameworks, OPEC+ contingency protocols, and IEA emergency coordination mechanisms were all designed to handle single-point disruptions, not concurrent closures of the two most critical export corridors from the world's largest hydrocarbon-producing region.
A dual-chokepoint closure scenario carries no viable short-term rerouting solution for Persian Gulf producers. Cargo rerouting around the Cape of Good Hope adds weeks of transit time and significantly increases freight costs, but more critically, it does not solve the problem of getting oil out of the Gulf itself if both exits are restricted.
Scenario Analysis: Quantifying the Range of Crude Flow Outcomes
Three Trajectories and Their Price Implications
The current market environment supports a structured scenario framework rather than a single price forecast. Three distinct trajectories have emerged from analyst modelling, each with materially different price implications. Furthermore, understanding the oil market trade war impact alongside these disruption scenarios helps clarify just how many simultaneous pressures are converging on crude pricing.
Scenario 1: Partial Disruption (Current State, July 16, 2026)
- Daily Hormuz flows reduced by 4.6 million barrels/day to approximately 3.9 million barrels/day
- Brent trading at $85.48/bbl; WTI at $80.27/bbl
- ING strategists assess WTI is unlikely to fall below $85 before 2027 absent a significant demand shock
- Iraqi oil loadings resumed at Basrah following a temporary suspension after a drone strike on a tanker during loading operations
Scenario 2: Sustained Blockade Without Full Closure
- Prolonged Gulf export delays without formal Strait closure
- Goldman Sachs projects Brent could exceed $110/bbl in Q4 2026 under this scenario
- IEA modelling suggests regional output could contract by at least 10 million barrels/day under sustained conflict conditions
- Insurance and freight premiums on tankers continue escalating, embedding a structural cost layer into every barrel reaching market
Scenario 3: Complete Strait Closure (Tail Risk)
- Full one-month obstruction drives Brent toward $150/bbl in worst-case analyst modelling
- Total disruption estimates range from 16 to 18 million barrels per day under complete closure
- SPR releases from IEA member nations would be deployed but cannot substitute for volumes of this magnitude
| Scenario | Daily Barrels Lost | Brent Price Range | Primary Driver |
|---|---|---|---|
| Partial Disruption (Current) | ~4.6 million bbl/day | $85–$95/bbl | Active conflict, no formal closure |
| Sustained Blockade | ~10 million bbl/day | $95–$110/bbl | Prolonged US-Iran military standoff |
| Full Strait Closure (1 month) | 16–18 million bbl/day | $130–$150/bbl | Iranian enforcement of formal blockade |
| De-escalation / Ceasefire | Minimal | $75–$85/bbl | Diplomatic resolution |
The Structural Risk Premium: Why Mean Reversion Is No Longer the Base Case
Abandoning the Return-to-Normal Assumption
Perhaps the most significant analytical shift occurring in real time is the abandonment of the mean-reversion assumption that has underpinned oil market modelling for decades. The conventional framework assumed that geopolitical disruptions, however severe, would eventually normalise and prices would return toward marginal production cost equilibria.
John Woods, Chief Investment Officer at Lombard Odier, articulated the new framework: markets should expect recurring, semi-permanent disruption to Hormuz oil flows rather than anticipating a restoration of pre-war conditions. This represents a fundamental reframing of the analytical baseline.
RBC Capital Markets analysts, including Helima Croft, reached a parallel conclusion. Even if US military operations were scaled back, Hormuz traffic would not recover to pre-conflict levels while commercial operators face the ongoing threat of mines, missiles, drones, and Iranian-imposed transit fees on vessels using the waterway. The risk architecture, in other words, outlasts any specific military episode.
IEA Executive Director Fatih Birol warned that without a swift and credible resolution, the global economy faces mounting structural difficulties rather than a manageable short-term commodity price event. Indeed, energy supply risks under prolonged conflict are increasingly becoming a baseline planning assumption rather than a tail risk for many institutional investors.
The $5–$15 Brent Premium: What Permanent Risk Repricing Costs the Global Economy
Lombard Odier's analysis suggests Brent could carry a lasting risk premium of $5 to $15 per barrel as the new equilibrium baseline, even after active hostilities subside. The economic implications of this range are substantial:
- At the $5/bbl lower bound: Global oil import bills increase by approximately $1.8 billion per day relative to pre-conflict pricing
- At the $15/bbl upper bound: The annualised additional cost to oil-importing economies exceeds $2 trillion, a figure comparable in magnitude to the economic output contraction seen during major global recessions
- Asian economies including China, Japan, South Korea, and India face the most direct exposure as the primary importers of Persian Gulf crude
- European nations face secondary exposure through benchmark price transmission and competition for alternative Atlantic Basin barrels
The market debate has structurally shifted. Analysts are no longer asking whether a risk premium exists. The question is now how large and how durable that premium will be, a fundamentally different analytical posture that has significant implications for long-term capital allocation decisions.
The Compounding Factor: Russia and Iraq Add Simultaneous Disruption Vectors
Ukraine's Strikes on Russian Energy Infrastructure
One of the less-discussed dimensions of the current oil shock is the simultaneous pressure being applied to Russian energy export capacity. Near-daily Ukrainian drone and missile strikes on Russian oil refineries and Black Sea tankers are degrading Russian export volumes independently of the Middle East conflict. This matters enormously for the global supply picture because Russian crude has historically functioned as a partial buffer during Persian Gulf disruptions.
The convergence of a Persian Gulf supply shock with concurrent degradation of Russian export capacity represents a supply compression dynamic not seen since the 1970s oil embargo era, when Arab producers and broader geopolitical forces simultaneously restricted supply from multiple directions. The compounding effect means that the typical market mechanism of substituting Russian barrels for disrupted Gulf volumes is substantially impaired.
Iraq's Basrah Terminal: A Third Concurrent Disruption Point
The temporary suspension of Iraqi oil loadings at Basrah following a drone strike on a tanker during loading operations added a third simultaneous disruption vector to the global supply picture. Iraq is one of OPEC's largest producers, and Basrah serves as its primary export terminal, handling the vast majority of the country's seaborne crude exports.
While loadings subsequently resumed, the incident exposed the fragility of the entire Persian Gulf export infrastructure under active conflict conditions. Any sustained interference at Basrah would compound the Hormuz flow reduction, potentially pushing the effective barrel deficit toward the upper ranges of the scenario framework above.
The next major ASX story will hit our subscribers first
Mining Economics Under Sustained Oil Price Elevation
The Energy Cost Transmission Mechanism
For the mining sector, the implications of oil above $85 on Middle East crude flow risks extend well beyond fuel pump prices. Energy typically represents 15–30% of total operating costs for large-scale mining operations, with diesel fuel, explosives manufacturing (which uses diesel as a feedstock), and ore processing energy as the primary consumption categories.
BMO Capital Markets has flagged that a sustained oil price shock could push mining costs sharply higher, with energy-intensive operations most exposed. Open-pit copper mines, large-scale iron ore operations, and aluminium smelters face the greatest cost pressure given their disproportionate energy intensity relative to underground or lower-throughput operations. In addition, understanding commodity prices and mining margins in this environment has become essential for investors reassessing sector exposure.
When Brent sustains above $85/bbl, mining operators face immediate margin compression unless commodity prices for their output rise proportionally. The critical question for mine operators and investors is whether the commodity price increases driven by the same geopolitical forces elevating energy costs will be sufficient to offset the cost inflation.
Commodity Market Responses: A Bifurcated Landscape
The commodity market response to the current oil shock has been far from uniform, reflecting the different demand and supply dynamics of each metal:
| Commodity | Price Level | Session Change | Oil Price Sensitivity | Key Dynamic |
|---|---|---|---|---|
| Gold Futures | $4,713.3/ozt | +3.84% | Moderate | Safe-haven demand surge, systemic stress pricing |
| Micro Gold | $4,713.1/ozt | +3.80% | Moderate | Consistent with main contract, broad market buying |
| Silver Futures | $75.495/ozt | +7.47% | Moderate-High | Dual safe-haven and industrial supply chain concern |
| Micro Silver | $75.48/ozt | +7.54% | Moderate-High | Solar and electronics manufacturing supply concerns |
| Platinum | $1,973.85/ozt | +4.22% | Moderate | Supply chain risk premium, South African logistics |
| Palladium | $1,496.5/ozt | +5.39% | Moderate | Autocatalyst demand uncertainty, Russia supply risks |
| Copper | $5.6358/lb | +2.72% | High | Energy-intensive smelting; supply constraint support |
| Aluminum Futures | $3,314.25/ton | -1.21% | Very High | Smelting cost pressure outweighs demand support |
Gold's move to $4,713/ozt simultaneously with Brent crossing $85 is a market signal worth examining carefully. Gold does not typically react to oil price spikes unless markets are pricing in systemic economic stress that transcends the energy sector. The concurrent surge across gold, silver, platinum, and palladium suggests that what is being priced is not merely a commodity supply event, but a broader reassessment of geopolitical stability and its downstream effects on global trade flows. Consequently, gold safe-haven dynamics are once again taking centre stage in portfolio risk discussions.
Silver's 7.47% single-session gain deserves particular attention. Silver carries dual exposure as both a safe-haven asset and a critical industrial input for solar panel manufacturing and electronics. Supply chain disruptions affecting shipping routes that connect Middle Eastern and Asian manufacturing hubs would materially impact silver's industrial demand profile, amplifying the safe-haven bid with a genuine supply disruption premium. For a broader view of precious metals positioning, the gold and silver outlook provides useful additional context for investors navigating this environment.
Aluminium's -1.21% decline against a backdrop of broadly rising metals is an important counter-signal. Aluminium smelting is among the most energy-intensive industrial processes in the global economy, and a sustained $85+ oil environment transmits directly into smelting electricity costs. The market appears to be pricing in the probability that demand destruction and cost-driven output cuts will weigh on aluminium more than supply chain disruption fears will support it.
Strategic Positioning in a Persistent High-Oil Environment
Investment Framework Considerations
For investors assessing exposure in a world where oil above $85 driven by Middle East crude flow risks is the new baseline, several structural portfolio dynamics come into focus:
- Energy sector equities have historically outperformed broad indices when oil sustains above $85 for more than 30 consecutive days, as upstream producers benefit from price leverage while integrated majors capture refining margin expansion
- Inflation-linked fixed income instruments gain structural appeal as elevated energy costs transmit into broader consumer price indices with a typical 6-12 week lag
- Tanker operator equities benefit from elevated freight rates and premium escort fees in restricted-transit environments, though the same conflict that drives rates higher also increases asset risk
- Precious metals function as the most liquid hedge against the systemic economic stress associated with persistent energy price elevation, as evidenced by the gold-oil correlation observed during the current episode
- Mining sector cost modelling requires updating to incorporate a $5-$15/bbl structural risk premium into long-term project economics, particularly for remote operations dependent on diesel power generation
The Policy Response Gap
A critical and often underappreciated dimension of the current situation is the mismatch between the scale of the potential disruption and the capacity of available policy tools to address it:
- Strategic petroleum reserve releases provide short-term price dampening but cannot substitute for the 4-18 million barrels per day at risk from various Hormuz disruption scenarios. Global SPR capacity is finite, and sustained deployment accelerates depletion toward a point where the reserve buffer itself becomes inadequate
- OPEC+ production flexibility is constrained by the fact that Saudi Arabia's primary export alternative (the Red Sea route) is itself under threat, limiting the cartel's ability to compensate for Persian Gulf flow reductions with increased production that cannot reach market
- Military escort operations can partially restore commercial traffic flow, but they introduce escalation dynamics, cannot scale to pre-conflict volumes, and create a permanent cost premium for every barrel escorted through contested waters
No combination of reserve releases, cartel production adjustments, and naval escort programmes can fully replace a sustained Hormuz blockade. The only durable resolution mechanism is diplomatic, which makes geopolitical negotiation the single most consequential energy policy instrument currently available to global leaders.
Frequently Asked Questions: Oil Above $85 and Middle East Crude Flow Risks
What is causing oil prices to stay above $85 per barrel?
The primary driver is the US-Iran military conflict that has materially reduced crude oil flows through the Strait of Hormuz. The seven-day moving average flow through the Strait has fallen by 4.6 million barrels per day since conflict resumed. Simultaneous pressure from Ukrainian strikes on Russian export infrastructure and the temporary disruption at Iraq's Basrah terminal compound the supply deficit.
Could oil prices reach $150 per barrel?
In a tail-risk scenario where the Strait of Hormuz is completely obstructed for approximately one month, analyst modelling suggests Brent could approach $150/bbl. This scenario would require Iran to successfully enforce a formal blockade removing an estimated 16-18 million barrels per day from global supply simultaneously.
What would bring oil prices back below $85?
A credible ceasefire between the US and Iran combined with the reopening of the Strait to unrestricted commercial traffic represents the primary de-escalation pathway, with base-case forecasts placing Brent in a $75-$85 range under this outcome. However, RBC Capital Markets analysts note that even post-ceasefire, traffic recovery is unlikely while mine, missile, and drone threats persist.
Which countries are most exposed to Hormuz disruption?
Asian economies face the most direct exposure as the primary importers of Persian Gulf crude. China, Japan, South Korea, and India collectively absorb the majority of Gulf production. European nations face secondary exposure through elevated benchmark pricing. The United States, as a net oil exporter, faces less direct import exposure but remains vulnerable through refined product price transmission and global economic contagion effects.
What is the Bab el-Mandeb, and why does it matter?
The Bab el-Mandeb is a narrow maritime passage connecting the Red Sea to the Gulf of Aden. It serves as the primary transit route for Persian Gulf oil moving toward Europe via the Suez Canal. It had been functioning as a partial export relief route for Saudi Arabia during Hormuz disruption. Iran has signalled that Yemen's Houthi movement could be directed to close this route under certain conditions, potentially creating concurrent dual-chokepoint closure with no modern precedent.
Disclaimer: This article contains forward-looking statements, analyst price forecasts, and scenario modelling outputs that are inherently speculative. Commodity price projections involve significant uncertainty and do not constitute investment advice. Readers should conduct independent research and consult qualified financial advisors before making investment decisions based on geopolitical risk assessments or commodity price forecasts.
Want to Track the Next Major ASX Discovery Before the Market Moves?
While geopolitical disruptions reshape global energy and commodity markets, Discovery Alert's proprietary Discovery IQ model delivers real-time alerts on significant ASX mineral discoveries — instantly translating complex commodity data into actionable opportunities for both traders and long-term investors. Explore how historic discoveries have generated substantial returns on Discovery Alert's discoveries page, and begin your 14-day free trial today to position yourself ahead of the broader market.