August 9, 2026
When Chokepoints Fail: Understanding the Architecture of Global Energy Resilience
Every energy system carries within it a hidden hierarchy of vulnerabilities. At the apex of that hierarchy sits a narrow strip of water between Iran and Oman, roughly 33 kilometres wide at its most constrained point. U.S. energy cushions Hormuz supply shock is not merely a headline — it describes an active, structurally significant response to one of the most consequential maritime disruptions in decades. The Strait of Hormuz is not simply a geographic feature; it is the load-bearing column of the global oil and gas supply structure, and when it fractures, the reverberations move faster than most policy frameworks can respond.
Under normal operating conditions, approximately 20% of globally traded crude oil and liquefied natural gas transits through Hormuz daily, according to the U.S. Energy Information Administration. That single corridor serves as the exit ramp for the combined export volumes of Saudi Arabia, the UAE, Kuwait, Iraq, Iran, and Qatar. When transit through Hormuz drops sharply, as vessel tracking data confirmed in recent weeks, the downstream consequences are not hypothetical. They are immediate, structural, and unevenly distributed across the world's economies.
The asymmetry of vulnerability is one of the least discussed dimensions of this crisis. Nations with robust domestic production or diversified import portfolios absorb the shock at cost. Nations that are structurally dependent on Hormuz-transiting supply — including India, Japan, South Korea, and much of Europe — face a qualitatively different risk exposure. India, for instance, remains dependent on imports for approximately 90% of its oil demand, and its crude output has declined for three consecutive years. That structural fragility concentrates the pressure of any Hormuz disruption in ways that aggregate statistics tend to obscure. Furthermore, the oil trade geopolitics driving these vulnerabilities have been building for years.
When big ASX news breaks, our subscribers know first
The Shale Foundation: How Decades of Capital Built Today's Buffer
The capacity of the United States to absorb and partially offset a Hormuz-scale supply disruption did not materialise spontaneously. It is the cumulative product of sustained capital deployment stretching back through the shale revolution, a period during which the American oil and gas industry invested approximately $150 billion per year in upstream production alone, according to the American Petroleum Institute (API). That figure excludes the billions more directed toward midstream pipelines, LNG export terminals, and refinery upgrades, each of which now serves as critical infrastructure in the current crisis response.
The transformation that investment created is structurally significant. The United States shifted from being a net crude oil importer to becoming the world's largest crude oil producer — a reversal that would have seemed implausible to energy analysts writing in the early 2000s. The mechanism driving that transformation was hydraulic fracturing combined with horizontal drilling, technologies that unlocked tight rock formations across the Permian Basin, Eagle Ford, and Bakken plays. The productivity gains were compounding. Initial shale wells that might have produced 200 barrels per day in 2010 were being replaced by completions yielding multiples of that figure by the early 2020s, as operators refined well spacing, lateral length, and completion design.
What this investment trajectory produced, from a crisis-response perspective, is a system with three interlocking capabilities:
- Production depth sufficient to maintain domestic supply security while simultaneously elevating export volumes
- LNG export infrastructure, including facilities such as Cameron LNG in Louisiana, capable of redirecting gas supply to markets cut off from Middle Eastern LNG — a dimension well captured in the broader LNG supply outlook for 2025 and beyond
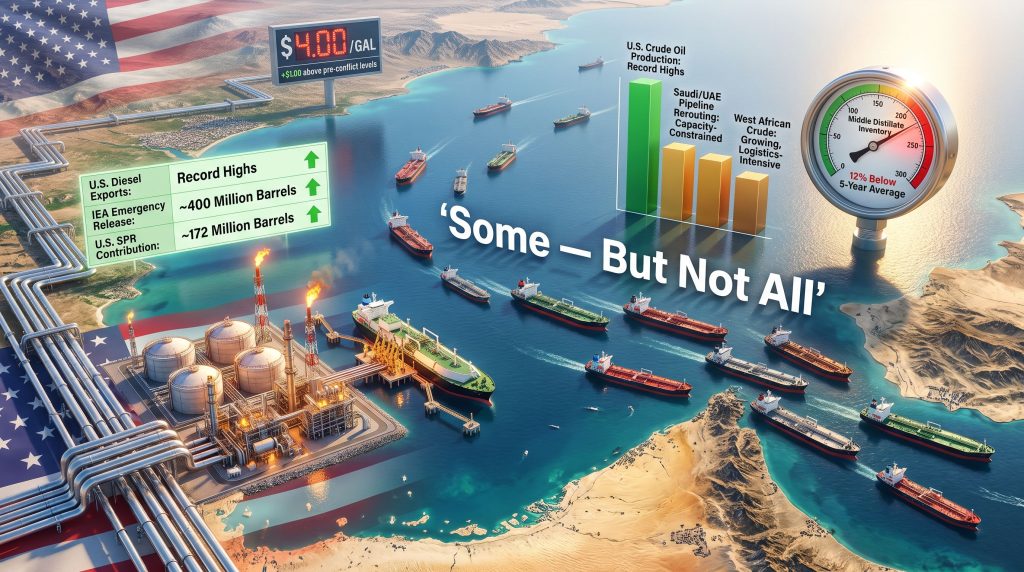
- Refinery capacity running at very high utilisation rates to convert crude into exportable fuel products, with U.S. diesel exports recently reaching record highs as global middle distillate markets tighten
The Grade Compatibility Problem: A Structural Constraint on Full Substitution
One dimension of the Hormuz disruption that receives insufficient attention is the crude grade mismatch problem. Middle Eastern producers, particularly Saudi Arabia, Kuwait, and Iraq, predominantly export medium-to-heavy sour crude grades, characterised by higher sulphur content and greater density. Many Asian refinery systems, particularly in China, Japan, and South Korea, were specifically designed and configured to process these grades efficiently.
U.S. shale production, by contrast, is predominantly light sweet crude — a fundamentally different feedstock with different processing requirements. While light sweet crude commands premium pricing and is highly sought in some markets, it cannot simply substitute barrel-for-barrel into refinery systems engineered for heavy sour processing without operational adjustments, blending requirements, or significant capital expenditure. This grade incompatibility is one of the less visible reasons why full substitution of Hormuz volumes remains structurally impossible in the near term, regardless of how high U.S. production climbs. However, this challenge sits alongside the broader concern of U.S. oil production decline, which adds further complexity to the outlook.
Record Output, Record Exports, and the Domestic Cost of Stabilisation
The numerical picture of U.S. energy cushions Hormuz supply shock is striking when viewed in aggregate. Crude oil production has reached record levels, LNG exports have been redirected toward Asian and European markets scrambling for alternative supply, and U.S. diesel exports have hit record highs as the global middle distillate market tightens under the strain of lost Hormuz volumes.
| Supply Metric | Pre-Disruption Baseline | Current Status |
|---|---|---|
| U.S. Crude Oil Production | Near-record levels | Record highs |
| U.S. LNG Exports | Rising trajectory | Elevated, redirected to Asia/Europe |
| U.S. Diesel Exports | Moderate | Record highs |
| Refinery Utilisation | High | Very high |
| Middle Distillate Inventories | Near five-year average | ~12% below five-year average |
The performance metrics are genuinely impressive. But they carry a domestic cost that the aggregate export data tends to understate. Record export volumes are drawing down U.S. crude and petroleum product inventories at an accelerating rate. According to the latest EIA petroleum status report, middle distillate inventories are running approximately 12% below the five-year seasonal average — a level that signals structural tightness in diesel and heating oil supply chains rather than merely cyclical fluctuation.
At the consumer level, that tightness has translated into direct price pressure. The national average gasoline price has risen to approximately $4.00 per gallon, roughly $1.00 above pre-conflict levels established before military operations against Iran commenced in late February, and approximately $0.90 above the equivalent period in the prior year, according to AAA fuel price data. U.S. motorists are, in effect, absorbing a portion of the Hormuz disruption cost through their fuel bills — a domestic price signal that underscores the real limits of the stabiliser role. According to Wood Mackenzie, the Strait of Hormuz closure risks the greatest global energy supply shock in decades.
"The trade-off embedded in the U.S. stabiliser role is rarely made explicit: every barrel exported to stabilise a foreign refinery is a barrel that is not building domestic inventory buffers. At below-average inventory levels, the margin for error against a secondary domestic shock narrows considerably."
Refinery System Stress: The Hidden Vulnerability
High refinery utilisation rates are conventionally read as a positive indicator, reflecting strong demand and operational efficiency. In the current context, however, they represent a double-edged condition. Running refineries at very high utilisation leaves compressed windows for scheduled maintenance, reduces operational flexibility, and eliminates the capacity slack that would otherwise absorb unplanned outages.
The risk amplification scenario that energy analysts watch closely involves a convergence of existing stress with a secondary shock — specifically a major Gulf Coast hurricane, a significant refinery fire, or a pipeline disruption occurring while inventories are already running below seasonal norms. Historical precedent, including the refinery disruptions associated with Hurricanes Katrina, Harvey, and Ida, demonstrates how quickly physical damage to refining infrastructure can translate into fuel price spikes and supply shortages, even under normal inventory conditions.
Emergency Buffers: Design, Deployment, and Diminishing Returns
The Strategic Petroleum Reserve was designed as a finite bridge instrument — a mechanism to stabilise markets during short-to-medium-term supply disruptions while diplomatic or commercial solutions are pursued. The IEA coordinated an emergency stock release of approximately 400 million barrels in response to the Hormuz closure, with the United States contributing an estimated 172 million barrels, the largest single-nation contribution to the release.
That deployment has provided meaningful near-term price support. But repeated drawdowns carry their own structural consequences. Each release reduces the reserve's future capacity to respond to the next disruption. If the Hormuz closure extends significantly beyond the initial buffer window, markets face a progressively tighter environment with fewer remaining shock absorbers available to deploy.
"Emergency reserve releases are bridge instruments, not structural solutions. Their value lies in buying time for diplomatic resolution or alternative supply development. They are not engineered to permanently replace Hormuz-transiting volumes."
The Parallel Buffer System: Non-U.S. Mechanisms Operating Simultaneously
It is important to recognise that the United States is not acting as the sole stabilising force. Several parallel supply mechanisms are operating concurrently, each contributing partial offsets to the displaced Hormuz volumes. The oil price shock has, furthermore, accelerated the search for these alternative mechanisms across global markets.
| Buffer Mechanism | Capacity/Scale | Duration Viability |
|---|---|---|
| U.S. Crude and Fuel Exports | Record levels, finite production ceiling | Medium-term |
| IEA Emergency Stock Release | ~400 million barrels coordinated | Short-term |
| U.S. SPR Contribution | ~172 million barrels | Short-to-medium-term |
| Saudi/UAE Pipeline Rerouting | Partial bypass via East-West Pipeline and Fujairah terminal | Ongoing, capacity-constrained |
| West African Crude Diversification | Growing, logistics-intensive | Medium-term |
| Iraq-Syria Pipeline Revival | Potential bypass route | ~3-year development timeline |
Saudi Arabia's East-West Pipeline and the UAE's pipeline connecting Abu Dhabi fields to the Fujairah terminal on the Gulf of Oman both represent genuine bypass capacity. However, both operate at or near their practical throughput ceilings, and neither can fully compensate for the volume of Hormuz-transiting supply under a prolonged closure scenario.
Indian refiners have responded to the Hormuz bottleneck by pivoting aggressively toward West African crude grades, including Bonny Light from Nigeria and Angolan grades such as Girassol. This market adaptation is commercially rational but logistically intensive. West African cargoes require longer voyage times and more complex shipping arrangements, introducing lead time and cost differentials that compress refinery margins.
The Iraq-Syria pipeline revival scenario represents the most speculative medium-term bypass option. Pipeline infrastructure connecting Iraqi production to Syrian Mediterranean terminals exists in degraded form, and preliminary assessments suggest a development timeline of approximately three years to reach operational readiness — a horizon that offers no near-term relief but matters significantly for longer-duration scenario planning.
Scenario Analysis: How Long Can the Buffer Hold?
The duration of the Hormuz disruption is the single most consequential variable in any forward-looking assessment. The oil market impacts of a prolonged closure, moreover, extend well beyond the energy sector into broader economic and geopolitical territory.
Scenario A: Resolution Within 3 to 6 Months
- U.S. export pressure eases gradually as Hormuz transit resumes
- SPR and IEA emergency releases prove sufficient to bridge the supply gap
- Domestic fuel prices retreat toward pre-conflict levels over subsequent months
- Global oil markets stabilise without entering a structural supply deficit
- Inventory rebuild begins, reducing vulnerability to secondary domestic shocks
Scenario B: Closure Extending Beyond 6 to 12 Months
- SPR and IEA emergency reserves approach depletion thresholds
- U.S. domestic inventories remain critically below seasonal averages with limited recovery
- Fuel price pressure intensifies for American consumers and industrial users
- Refinery system vulnerability to secondary shocks increases materially
- Alternative supply routes must absorb a structurally larger share of displaced volume
Iran's stated position — that the strait will remain closed until the United States meets a set of sweeping demands — suggests that near-term diplomatic resolution is not guaranteed. According to the IMF, the oil market has absorbed the war shock, but buffers are running low. Markets have periodically priced in peace deal scenarios that have not materialised, a pattern of sentiment-driven price volatility that creates both risk and opportunity for energy market participants.
The next major ASX story will hit our subscribers first
Investment and Policy Implications: What Sustains Resilience Beyond the Current Crisis
The API's framing of U.S. energy resilience as the product of long-term investment decisions rather than reactive policy choices has implications that extend well beyond the current disruption cycle. The infrastructure and production capacity that is currently functioning as a global buffer was not built in response to the Hormuz closure. It was built incrementally over more than two decades — through upstream capital expenditure, midstream build-out, and LNG export terminal development.
Infrastructure gaps in the U.S. energy system — including LNG export capacity constraints, pipeline bottlenecks in key producing regions, and refinery configuration limitations relative to the grade profile of domestic production — represent the areas where sustained investment would most directly enhance future crisis response capability. Whether the policy environment continues to incentivise that investment, across changing administrations and market conditions, is the central long-term question for U.S. energy security positioning.
Frequently Asked Questions: U.S. Energy and the Hormuz Supply Shock
How much oil normally flows through the Strait of Hormuz?
Under normal operating conditions, the EIA estimates that approximately 20% of globally traded oil and LNG transits through Hormuz, making it the world's most strategically critical maritime energy corridor.
Can U.S. oil production fully replace Hormuz supply losses?
No. The API has indicated that U.S. production can offset some but not all of the supply displaced by the Hormuz closure. Grade incompatibility between U.S. light sweet shale crude and the heavy sour grades that Middle Eastern producers export, combined with logistics constraints and production ceiling limits, prevents full substitution.
What is the current state of U.S. oil inventories?
U.S. crude and petroleum product inventories have fallen below the five-year seasonal average. Middle distillate stocks are running approximately 12% below that benchmark, reflecting the strain of record export volumes on domestic supply.
How much has the IEA released from emergency reserves?
A coordinated IEA emergency stock release of approximately 400 million barrels has been deployed, with the U.S. contributing an estimated 172 million barrels — the largest single-nation contribution to the release.
What is the impact on U.S. gasoline prices?
The national average gasoline price has risen to approximately $4.00 per gallon, roughly $1.00 above pre-conflict levels and about $0.90 higher than the equivalent period in the prior year, according to AAA data.
What alternative supply routes exist if Hormuz remains closed?
Key alternatives include Saudi and UAE overland pipeline rerouting to Red Sea and Gulf of Oman terminals, West African crude diversification for Asian refiners, and a potential Iraq-Syria pipeline revival with an estimated three-year development timeline.
Disclaimer: This article is intended for informational and educational purposes only and does not constitute financial, investment, or trading advice. Forecasts, scenario projections, and market assessments involve inherent uncertainty. Readers should conduct their own due diligence before making any investment or commercial decisions related to energy markets.
Want to Track the Investment Opportunities Emerging From Global Energy Disruptions?
Discovery Alert's proprietary Discovery IQ model delivers real-time alerts on significant ASX mineral discoveries, instantly translating complex resource data into actionable insights for both short-term traders and long-term investors — explore historic discoveries and their returns to understand the scale of opportunity, then begin your 14-day free trial at Discovery Alert to position yourself ahead of the market.