July 15, 2026
When Geopolitics Overrides Economics: The 2026 Oil Demand Collapse Explained
Every major commodity cycle in modern history has been shaped by one of two forces: demand-side collapse or supply-side disruption. The COVID-19 pandemic of 2020 was a textbook demand shock, where consumer activity evaporated almost overnight. What the global oil market is experiencing in 2026 is something structurally different and, in many ways, more complex to model and navigate. A geopolitically-induced supply shock has propagated through refinery systems, product pipelines, and trade networks with such force that it has destroyed demand from the supply side inward, producing an outcome that few analysts had placed in their base-case scenarios at the start of the year.
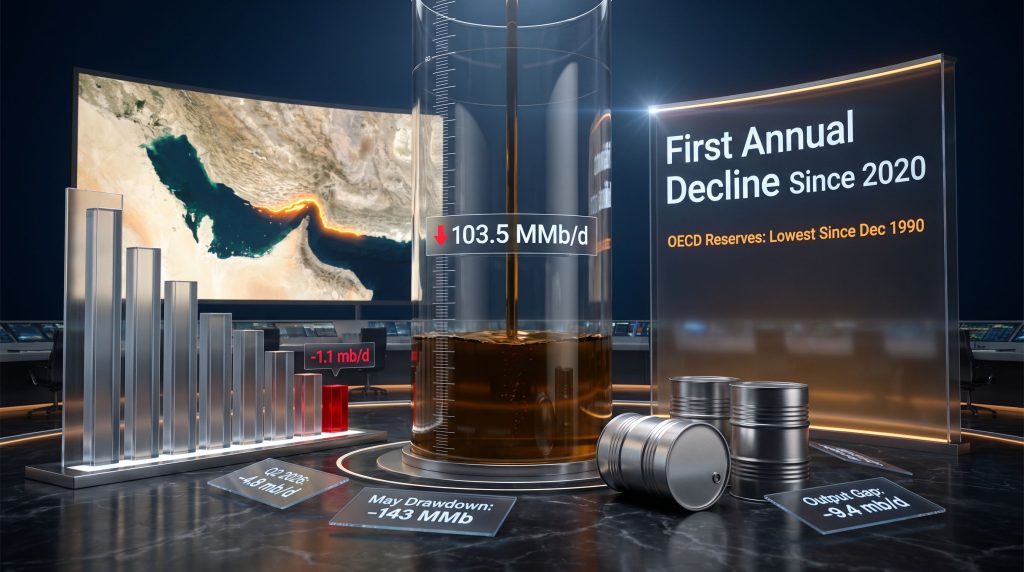
The result is a landmark finding from the International Energy Agency's July Oil Market Report: global oil demand is on course to contract by approximately 1.1 million barrels per day (b/d) in 2026 on a year-on-year basis, marking the first annual IEA global oil demand fall since the pandemic brought the world economy to a near-standstill six years ago.
When big ASX news breaks, our subscribers know first
How Dramatically the IEA's Forecast Has Shifted in 2026
To appreciate the scale of this revision, it is worth examining how rapidly the IEA's own projections have moved through 2026. As recently as April, the agency had anticipated growth in global oil consumption of 640,000 b/d for the year. By May, that figure had already been downgraded. By July, the outlook had swung to a contraction of more than 1 million b/d, representing a cumulative revision of over 1.64 million b/d within a single quarter.
| Forecast Period | IEA 2026 Demand Outlook | Change vs. Prior Period |
|---|---|---|
| April 2026 | +640,000 b/d growth | Baseline |
| May 2026 | Revised downward | -700,000 b/d |
| July 2026 | -1.1 million b/d contraction | -1.64 million b/d from April |
This kind of sequential downgrade within months is rare in peacetime energy forecasting. It reflects not a gradual deterioration of economic fundamentals but a sudden, exogenous rupture in the physical architecture of global oil supply. Furthermore, understanding the current crude oil market context helps illustrate just how dramatically conditions have deteriorated.
The speed and magnitude of the IEA's forecast reversal, from growth to contraction within a single quarter, underscores how rapidly geopolitical disruptions can overwhelm structural demand fundamentals that analysts spend months carefully modelling.
The Strait of Hormuz: A 21-Mile Corridor That Controls Global Energy Security
Why This Waterway Is the World's Most Consequential Chokepoint
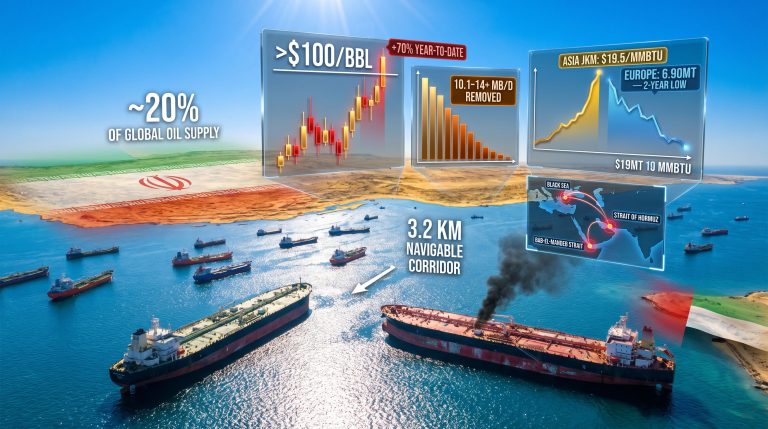
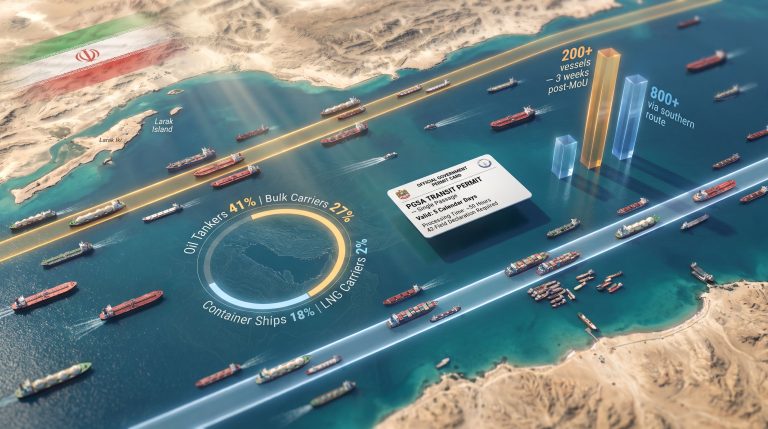
To understand the 2026 oil demand contraction, it is essential to understand the physical geography that made it possible. The Strait of Hormuz, a narrow passage between Iran and Oman at the mouth of the Persian Gulf, is the single most important maritime corridor for global oil trade. Approximately 20% of the world's tradeable oil transits this waterway, along with significant volumes of liquefied natural gas.
When the five-month conflict involving the United States, Israel, and Iran escalated to the point of disrupting Hormuz transit, the consequences radiated outward through interconnected supply chains with unusual speed. Refineries in Asia-Pacific, Europe, and parts of North America that depend on Persian Gulf crude found their feedstock supply constrained almost immediately. Unable to source adequate crude volumes, many were forced to reduce processing runs, which compressed the availability of refined products and depressed end-user consumption across multiple sectors simultaneously.
The IEA characterised the resulting demand contraction as highly skewed in both product and regional terms, meaning the damage was concentrated rather than evenly spread. This asymmetry is a critical analytical point: headline demand figures mask the fact that specific fuel types and specific geographies absorbed a disproportionate share of the shock. The oil price geopolitical factors at play here are, consequently, unlike anything modelled in recent years.
The Conflict's Escalation in Numbers
The military dimension of the crisis unfolded at considerable scale. US Central Command conducted strikes against more than 80 targets across Iran, including air defence installations, coastal radar systems, and over 60 Revolutionary Guard vessels. Iran responded with drone and missile attacks against Bahrain and Kuwait, expanding the theatre of conflict beyond bilateral confrontation into a broader regional crisis.
The downstream effect on oil markets was severe and measurable:
| Metric | Data Point |
|---|---|
| Q2 2026 demand decline (year-on-year) | -4.8 million b/d |
| Q3 2026 projected demand decline | -1.7 million b/d |
| Full-year 2026 demand change | -1.1 million b/d |
| Lowest demand point recorded (May 2026) | 97.9 million b/d |
| June production rebound (partial Hormuz reopening) | +4.1 million b/d |
| Output gap vs. pre-war levels (as of June 2026) | -9.4 million b/d |
The Ceasefire That Lasted Sixteen Days
A Brief Window of Stabilisation
A temporary ceasefire in June 2026 created what appeared to be a narrow opening for market stabilisation. Gulf producers were able to restart shut-in wells, pushing global production up by 4.1 million b/d to approximately 98.8 million b/d. The US Treasury simultaneously issued General License X, formally authorising Iranian crude oil sales to international buyers, a signal that diplomatic normalisation might be within reach.
It was not. The licence was revoked just 16 days later on July 7, following renewed attacks on commercial shipping in the Gulf. Iranian forces struck three commercial vessels within a 48-hour window, prompting US retaliatory strikes and formal revocation of the export authorisation. President Donald Trump subsequently declared the ceasefire over, eliminating both the diplomatic and commercial pillars that the IEA's recovery scenario had relied upon.
The IEA's head of oil markets cautioned publicly that any market upturn would be neither swift nor linear given the deeply uncertain and unstable conditions prevailing in the region. This is not boilerplate caution; it is a direct acknowledgment that the agency's own forward projections are built on geopolitical assumptions that are actively unravelling. In addition, OPEC demand revisions have compounded this uncertainty further.
Warning: The IEA's projected Q4 2026 demand recovery is explicitly contingent on gradual normalisation of tanker flows through the Strait of Hormuz. That normalisation is not currently occurring, placing the recovery scenario under significant pressure.
The Inventory Crisis: A Buffer System Running Dry
Emergency Stockpiles at Levels Not Seen Since the Gulf War Era
Perhaps the most alarming dimension of the 2026 oil market crisis is not the demand destruction itself but the simultaneous depletion of the global buffer system designed to absorb exactly this type of disruption. Despite significant reductions in consumption, global oil inventories have continued to fall at a historically unprecedented rate, demonstrating that supply disruption has outpaced even the demand it has destroyed.
OECD government emergency reserves have declined to their lowest levels since December 1990, a threshold not breached during the 2008 financial crisis, the 2011 Arab Spring disruptions, or any of the subsequent Middle Eastern conflicts of the early 2020s. This is a historically significant data point that places the current crisis in direct comparison with the Gulf War period.
The monthly inventory drawdown figures tell a story of accelerating depletion:
| Month | Observed Global Stock Draw |
|---|---|
| April 2026 | -74 million barrels |
| May 2026 | -143 million barrels |
| Average since conflict onset | -3.8 million b/d |
The near-doubling of the monthly drawdown rate between April and May signals that the buffer erosion was gaining momentum rather than stabilising, even as demand itself was suppressed. The IEA has warned that if drawdowns continue at comparable rates, global oil stocks could reach historic lows before any rebalancing materialises, with the earliest plausible shift to surplus pushed toward late Q4 2026 at the most optimistic.
Why Inventory Depletion Matters Beyond the Headline
Energy market practitioners understand that inventory levels function as a shock absorber for price volatility. When buffer stocks are deep, markets can accommodate temporary supply disruptions without extreme price spikes. When inventories are thin, the price elasticity of the market changes fundamentally: any further supply disruption, however small, can produce outsized price responses because there is no cushion to absorb it.
The depletion of OECD emergency reserves to 1990-era levels therefore represents more than a data point. It represents a structural reduction in the market's capacity to handle further shocks, at precisely the moment when the geopolitical risk of additional shocks remains elevated. OPEC's market influence during this period has similarly been unable to provide the stabilising effect markets might otherwise have expected.
Quarterly Trajectory and the Conditions for a 2027 Recovery
What the IEA's Rebound Scenario Actually Requires
The IEA projects a demand recovery of +2 million b/d in 2027, contingent on three converging conditions occurring in sequence:
- Normalisation of trade flows through the Strait of Hormuz and broader Persian Gulf shipping corridors
- Declining oil prices as supply constraints ease and inventory rebuilding begins to offset the emergency stock deficit
- Improving macroeconomic conditions across major consuming economies, particularly in Asia-Pacific import-dependent nations
The quarterly demand trajectory illustrates both the depth of the current trough and the scale of the rebound required:
| Quarter | Estimated Demand Trend |
|---|---|
| Q1 2026 | Pre-conflict baseline, modest growth anticipated |
| Q2 2026 | -4.8 million b/d year-on-year (peak impact) |
| Q3 2026 | -1.7 million b/d year-on-year (partial stabilisation) |
| Q4 2026 | Recovery contingent on Hormuz normalisation |
| Full Year 2026 | -1.1 million b/d year-on-year |
| 2027 Outlook | +2.0 million b/d (recovery scenario) |
Moving from the May demand trough of 97.9 million b/d to a Q4 recovery implies a rebound exceeding 5 million b/d across two quarters. This pace of recovery is theoretically achievable, but it depends almost entirely on geopolitical stabilisation that is currently absent.
The next major ASX story will hit our subscribers first
Sectoral and Regional Consequences: Who Bears the Greatest Burden
Downstream Industries Under Compounding Pressure
The IEA's characterisation of the contraction as highly skewed reflects a reality that aggregate demand figures obscure. The shock has not distributed itself evenly across fuel types, geographies, or end-use sectors.
- Aviation: Jet fuel shortages have emerged as a critical downstream consequence. The International Air Transport Association warned earlier in the crisis of potential flight cancellations in fuel-constrained regions, particularly in Europe and parts of Asia.
- Refining economics: Disrupted crude availability has created divergent margin environments. Some refining centres face feedstock scarcity and margin compression while others benefit from elevated refined product prices, creating unusual intra-sector divergence.
- Petrochemicals and manufacturing: Reduced refinery run rates constrain naphtha output and other petrochemical feedstocks, transmitting cost pressure through chemical and plastics manufacturing supply chains.
- Emerging market economies: Import-dependent nations face a dual burden: higher fuel acquisition costs combined with reduced product availability, amplifying domestic inflationary pressures at a time when many economies have limited fiscal room to subsidise energy.
The Asia-Pacific Concentration Risk
Asia-Pacific economies represent the world's largest and fastest-growing bloc of oil importers, and their dependence on Persian Gulf crude makes them structurally exposed to Hormuz disruptions in ways that Atlantic Basin markets are not. The IEA's assessment that the demand contraction is regionally skewed reflects this concentration risk. Furthermore, the trade war oil impact has compounded existing vulnerabilities for these import-reliant economies. With Gulf production still running 9.4 million b/d below pre-war levels as of June 2026, the feedstock deficit for Asian refineries remains acute.
Comparing 2026 to Historical Oil Demand Shocks
A Structurally Different Form of Demand Destruction
The 2026 contraction is only the second annual decline in global oil demand in the post-2000 era. However, comparing it to 2020 requires careful framing of the underlying mechanism. According to the IEA, the nature of this demand destruction is fundamentally unlike anything seen during the pandemic years.
In 2020, demand collapsed from the consumer side inward. Lockdowns, travel bans, and industrial shutdowns removed the need for fuel before supply could respond. The market found itself overwhelmed with crude it could not move or store.
In 2026, the sequence is inverted. Supply disruption has forced consumption lower through two distinct transmission channels: price escalation that makes fuel unaffordable for marginal consumers, and physical product unavailability that prevents consumption even where purchasing power exists. This supply-to-demand destruction pathway is structurally more complex to reverse because it requires both geopolitical resolution and physical supply chain reconstruction, not merely the reopening of economies.
The depletion of OECD inventories to December 1990 levels places 2026 in direct historical proximity to the Gulf War, which also involved Persian Gulf supply disruption, though the current crisis has proven considerably more prolonged in its impact on export volumes.
Comparative Framework: Unlike COVID-19, which destroyed demand from the consumer side inward, the 2026 crisis operates in reverse. Supply disruption has forced consumption lower through price escalation and physical product unavailability, representing a fundamentally different form of demand destruction that requires a different set of conditions to reverse.
Key Takeaways: The 2026 IEA Global Oil Demand Fall at a Glance
- -1.1 million b/d: Full-year 2026 demand contraction, the first annual IEA global oil demand fall since COVID-19
- 143 million barrels: Observed global inventory drawdown in May 2026 alone, nearly double the April figure
- December 1990: The last time OECD government emergency reserves were this depleted
- +2 million b/d: IEA's projected 2027 recovery scenario, subject to geopolitical stabilisation that remains absent
- -9.4 million b/d: Gulf production gap versus pre-war output levels as of June 2026
- 16 days: The duration of General License X before its revocation ended the ceasefire's commercial dimension
- 97.9 million b/d: The lowest recorded global demand point, observed in May 2026
Disclaimer: This article draws on publicly available data from the IEA's July 2026 Oil Market Report and related reporting. Forward-looking projections, including the IEA's 2027 recovery scenario, are subject to significant geopolitical uncertainty and should not be interpreted as guaranteed outcomes. Energy market conditions are evolving rapidly, and readers are encouraged to consult primary sources and professional advisors before making any investment or commercial decisions based on this analysis.
Want to Profit From the Market Disruptions Reshaping Global Commodity Flows?
Volatile geopolitical events like the 2026 Hormuz crisis expose both systemic risks and significant opportunities across commodity markets, and Discovery Alert's proprietary Discovery IQ model delivers real-time ASX mineral discovery alerts that empower investors to act on those opportunities ahead of the broader market — explore historic examples of major discovery returns and begin your 14-day free trial today.