August 13, 2026
The Architecture of Vulnerability: How the Strait of Hormuz Became Ground Zero for the 2026 Energy Crisis
Energy markets are built on the assumption that geography is stable. For decades, traders, governments, and corporate planners have treated the physical routes of global oil and gas as background conditions rather than active risk variables. The Strait of Hormuz oil supply disruption unfolding in mid-2026 has demolished that assumption with a finality that no forecasting model fully anticipated. What was once categorised as a tail risk has materialised as the defining energy market event of the decade, exposing structural fragilities that run far deeper than any single geopolitical flare-up.
When big ASX news breaks, our subscribers know first
Why the Strait of Hormuz Was Always the World's Most Dangerous Energy Chokepoint
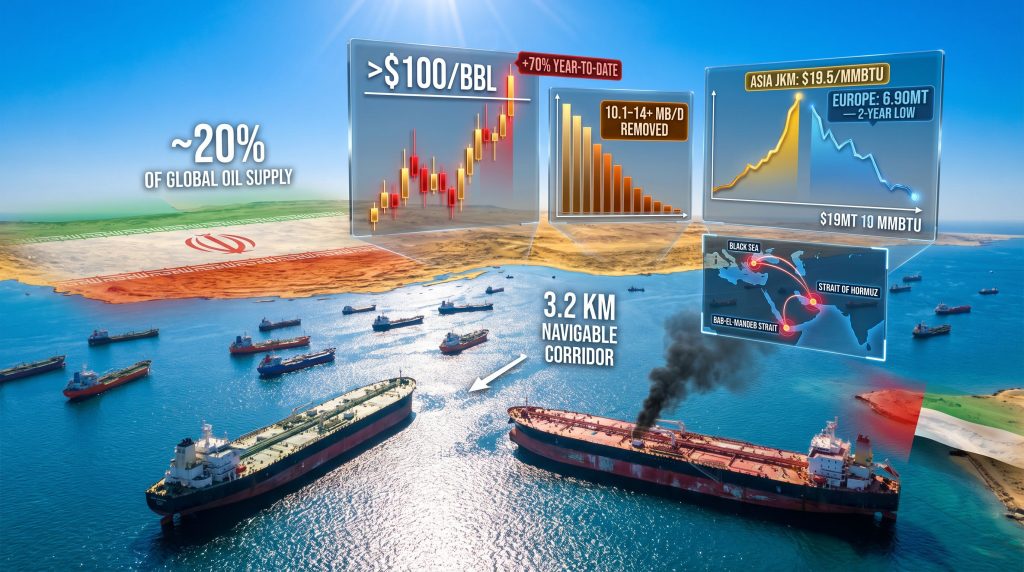
Understanding the scale of the current crisis requires appreciating just how extraordinary the physical geography of the strait actually is. The navigable shipping corridor through the Strait of Hormuz measures approximately 3.2 kilometres wide in each direction, threading between the coastlines of Iran and Oman. Through this narrow passage, under normal conditions, flows roughly 20 to 21 million barrels per day of crude oil and petroleum products, representing approximately 20% of total global daily supply. No pipeline system, no alternative maritime route, and no combination of land-based infrastructure comes close to replicating this throughput at equivalent scale.
The strait's LNG exposure compounds the risk further. Approximately 20 to 30% of global liquefied natural gas trade transits the same corridor, meaning that a single closure simultaneously strikes both oil and gas markets across multiple continents. Disruptions to global LNG supply from this corridor are particularly severe given the UAE's Fujairah bypass pipeline, which offers only partial relief at around 1.5 million barrels per day of capacity. The economic reality is that no viable alternative exists at the scale required to absorb a full closure.
How the 2026 Crisis Differs From Every Historical Precedent
The 1980s Tanker War, the 2019 Gulf of Oman incidents, and the 2020 tension spikes all produced market anxiety, elevated war risk premiums, and diplomatic crises. None produced a confirmed, enforced closure of the strait with active vessel strikes. The 2026 escalation is categorically different. Two VLCC tankers operated by ADNOC were struck by Iranian cruise missiles while transiting the southern shipping lane, resulting in one confirmed fatality. Iran's Islamic Revolutionary Guard Corps formally declared the strait closed and threatened destruction of any vessel attempting transit without authorisation.
The distinction between threat and execution matters enormously in energy market psychology. Prior crises involved the credible possibility of disruption. The current Strait of Hormuz oil supply disruption involves confirmed kinetic action, with tanker traffic declining by 80% or more and an estimated 150 to over 1,000 vessels immobilised across the Gulf. The market's prior oversupply narrative, which had dominated sentiment as recently as mid-2026, collapsed within days.
The Numbers Behind the 2026 Hormuz Disruption
The scale of supply removal is without precedent in recorded energy market history. The following figures illustrate the magnitude of the shock:
| Metric | 2026 Hormuz Disruption |
|---|---|
| Estimated daily supply removed from market | 10.1 to 14+ million b/d |
| Global oil supply drop (March 2026) | 10.1 mb/d |
| Approximate share of world supply affected | ~20% |
| Consumption equivalent | Combined oil use of UK, France, Germany, Spain, and Italy |
| Brent crude price at peak disruption | ~$100/barrel |
| Year-to-date price increase | ~70% |
| Tanker traffic reduction | 80%+ decline in shipping volumes |
| Vessels stranded in the Gulf | 150 to 1,000+ ships immobilised |
What $100 Oil Actually Signals: Backwardation and Market Structure
Crude oil price trends tell only part of the story. The more telling market signal is the structural shift into steep backwardation across all major global benchmarks. Backwardation, where near-term futures prices trade above longer-dated contracts, is the market's clearest signal of perceived short-term scarcity. It represents traders paying a premium to secure physical barrels now rather than later because future availability is genuinely in doubt.
Brent crude surpassed $85 per barrel in early July 2026 before continuing its ascent toward the $100 per barrel threshold. Murban crude recorded a single-session gain of +3.67%, while heating oil surged +4.41% in one trading session. WTI crude reached $79.52, a gain of +1.77%, before the full blockade effect was priced in. These are not incremental moves. They represent a structural repricing of global energy risk.
"Market Reality Check: The speed at which the oversupply consensus reversed into scarcity pricing illustrates a persistent vulnerability in energy market psychology. Participants systematically underweight low-probability, high-consequence events until they are actively occurring."
Geopolitical Escalation Sequence: How the Crisis Unfolded
From Military Strikes to Maritime Closure
The conflict arc began with U.S.-Israel military strikes on Iranian infrastructure starting February 28, 2026. Iran's response escalated progressively, culminating in the IRGC's formal closure declaration and vessel strike operations. The U.S. maritime blockade of Iranian shipping came into effect on April 13, 2026, followed by the White House's formal reinstatement of a comprehensive blockade framework, with the U.S. designating itself the self-described guardian of the strait and proposing a 20% levy on all cargoes transiting the waterway.
In a development that complicates the simple narrative of Iranian capitulation, Iran's oil exports continued at approximately 1.35 million barrels per day in early July, with an estimated 12 million barrels moved past the renewed U.S. blockade. The effectiveness of the blockade as a supply suppression tool is therefore partial rather than absolute, adding a layer of uncertainty to both supply forecasts and price trajectory models. Furthermore, the oil price impacts of these overlapping geopolitical pressures are compounding in ways few analysts anticipated.
A Second Front: Saudi Arabia and the Houthi Resumption
Simultaneously, Saudi Arabia conducted air strikes on Sanaa International Airport in Yemen, prompting Houthi rebels to declare the period of de-escalation with Riyadh formally concluded. This development introduces a second simultaneous chokepoint threat into the global supply risk matrix. The Bab-el-Mandeb Strait, through which approximately 3.8 million barrels per day of oil transited before the 2023 Houthi campaign began, sits at the southern entrance to the Red Sea. A coordinated closure of both Hormuz and Bab-el-Mandeb would constitute an unprecedented dual-chokepoint energy emergency with no historical parallel.
The Black Sea: A Third Simultaneous Shock
Ukrainian attacks on Russian fuel tankers in the Black Sea escalated concurrently with the Hormuz crisis. Oil prices jumped above $87 per barrel as Black Sea shipping risk compounded Hormuz anxiety. The IEA cut its Russian oil production forecast in direct response to Ukrainian infrastructure strikes on energy-related targets. For the first time in modern energy market history, three simultaneous geopolitical supply shocks are operating in parallel, each capable of moving prices independently, all reinforcing each other.
How Global Energy Markets Are Responding
The LNG Market Split: Asia Versus Europe
"Key Structural Development: The 2026 Hormuz closure has effectively divided the global LNG market into two competing blocs, with Asian buyers holding price advantage and European buyers facing structural under-supply."
Asian LNG imports in July 2026 are projected to reach 23 million tonnes, the highest July reading on record. The demand driver is compounded by a Super El Niño heat event amplifying cooling demand across the region. Asia's benchmark JKM price surged to $19.5 per MMBtu, the highest level since early June 2026.
European LNG imports tell the opposite story. July imports are projected to fall to 6.90 million tonnes, a two-year low, as European prices consistently trade below the JKM benchmark and divert available cargoes eastward. The economic logic is merciless: when Asian buyers are willing to pay more, European buyers go without.
BloombergNEF has pushed its anticipated first LNG glut year from 2026 out to 2028, a two-year delay driven by the U.S.-Iran conflict and recurring project commissioning delays. Pakistan, meanwhile, issued an emergency LNG tender for prompt July delivery after Qatar's exports were disrupted by the attack on the Al Rekayyat LNG carrier, illustrating the cascade effects on the most supply-vulnerable nations.
One overlooked dimension of the LNG fracture involves the EU's paradoxical position. Europe imported a record 9.97 million tonnes of Russian LNG from the Yamal facility in the first half of 2026, up 16% year-over-year, as buyers rushed to absorb supply ahead of looming phase-out deadlines. This creates an awkward political dynamic where European energy security is simultaneously threatened by Hormuz disruption and sustained by Russian supply that policy frameworks intend to eliminate.
Chinese Crude Imports: A Decade-Low and Its Deeper Meaning
"Critical Data Point: China's June 2026 crude oil imports fell 41% year-over-year to just 7.12 million barrels per day, the lowest monthly reading since October 2016."
The causes behind this collapse are multiple and interacting:
- A nationwide ban on refined product exports removed the incentive to import crude for processing and re-export
- Domestic fuel demand softened as broader economic conditions weighed on industrial activity
- Hormuz transit risk elevated the effective cost of Middle Eastern crude relative to alternatives
- China began cutting Saudi crude orders as risk premiums and discount structures reshaped trade economics
The consequence is a reorientation of Asian import flows. Chinese, South Korean, and Indian buyers are all pivoting toward U.S. crude supplies as Hormuz alternatives gain economic viability. India is simultaneously expanding its strategic oil reserves through new ONGC storage infrastructure, a signal that Asian importers are treating prolonged disruption as a planning assumption rather than a transient event.
OPEC's Demand Forecast Reversal
OPEC revised its 2026 world oil demand growth forecast down to 780,000 barrels per day, from 970,000 b/d one month prior, marking the third consecutive downward revision. However, OPEC's market influence remains pivotal, as the group simultaneously boosted its 2027 demand growth outlook to 1.94 million b/d, signalling a deferred recovery scenario where suppressed 2026 consumption rebounds sharply once supply normalises.
Saudi Arabia, Iraq, and Kuwait have been cutting output as onshore storage approaches capacity limits. This represents an underappreciated paradox: Gulf producers are voluntarily reducing supply into an already disrupted market, paradoxically tightening conditions further. Meanwhile, UAE oil output has reached an all-time production high, doubling pre-crisis levels, as Gulf states outside the direct conflict zone attempt partial compensation.
Emergency Response Mechanisms: Are They Adequate?
The IEA's Historic Reserve Release
The International Energy Agency coordinated the release of 400 million barrels from member-state strategic petroleum reserves, the single largest emergency withdrawal in the IEA's operational history. The critical limitation is arithmetic rather than political:
- At 10 mb/d of lost supply, 400 million barrels covers approximately 40 days of replacement flow
- At 14 mb/d of lost supply, the same reserve covers fewer than 29 days
- The IEA's emergency frameworks were designed for shorter-duration disruptions; a months-long closure structurally exceeds their design parameters
The IEA's leadership publicly stated that the U.S.-Iran conflict risks overturning the previously anticipated oil surplus outlook for 2026, a significant reversal from projections that had shaped market positioning for the preceding 12 months. The agency's assessment of readjusted oil supplies highlights just how unprecedented this supply gap truly is.
Alternative Supply Corridors: The Capacity Gap
| Alternative Route | Current Capacity | Key Limitation |
|---|---|---|
| Kirkuk-Ceyhan Pipeline (Iraq-Turkey) | ~200,000 b/d currently | Iraq proposing temporary expansion to 750,000 b/d |
| UAE Fujairah bypass pipeline | ~1.5 mb/d | Already near maximum utilisation |
| U.S. Gulf Coast exports | Expanding | Logistics and tanker availability constraints |
| Nigerian output | 1.56 mb/d (6-year high, June 2026) | Cannot offset a 10+ mb/d Hormuz gap |
| Russia via Black Sea | Declining | Under active attack; IEA cutting production forecasts |
The combined throughput of all active alternative corridors falls dramatically short of the 10 to 14 million barrels per day removed from the market. Full recovery of affected infrastructure in Iraq and Kuwait is not projected before 2027 under base-case scenarios.
The next major ASX story will hit our subscribers first
Three Forward Scenarios for the Hormuz Disruption
Scenario 1: Rapid De-escalation (3 to 6 Month Horizon)
Under this pathway, a ceasefire agreement is reached and the U.S. and Iran negotiate terms for phased maritime reopening. Tanker traffic resumes gradually and war risk premiums compress. The IEA has assessed that restoring flows to pre-conflict levels could take up to six months even under favourable conditions. Brent would likely retreat toward a $75 to $80 per barrel range over 6 to 9 months. The key risk: Iran retains physical and strategic leverage over the chokepoint regardless of any ceasefire terms, meaning the threat does not dissolve with any agreement.
Scenario 2: Protracted Conflict with Partial Reopening (6 to 18 Month Horizon)
Selective passage resumes for non-U.S.-affiliated vessels under IRGC toll arrangements, but shipping insurance costs remain elevated and effective supply reduction persists at 4 to 6 mb/d. The LNG glut is delayed to 2028 to 2029, European energy security remains structurally compromised, and infrastructure recovery in Iraq and Kuwait extends into 2027. Oil prices stabilise in the $85 to $100 per barrel range with sustained volatility.
Scenario 3: Extended Dual-Chokepoint Escalation (18+ Month Horizon)
Saudi-Houthi conflict intensifies and Bab-el-Mandeb becomes a second active chokepoint. Combined supply removal potentially exceeds 15 mb/d. Emergency reserve buffers are exhausted within 60 to 90 days. Structural reorientation of global energy trade accelerates permanently, with U.S. LNG, West African crude, and pipeline alternatives gaining durable market share. A long-term price floor reset above $100 per barrel would accelerate energy transition investment as a strategic response across importing nations.
Sector-Level Exposure Beyond Crude Oil
The Strait of Hormuz oil supply disruption transmits across every energy-dependent sector, not merely crude oil markets. In addition, the ripple effects extend to industries as varied as steel manufacturing, where global steel demand faces headwinds from rising energy input costs:
- Aviation fuel: Jet fuel supply chains are critically exposed given that 20 to 30% of supply transits Hormuz. Airlines are already modelling fuel surcharge adjustments.
- Petrochemicals: Feedstock cost inflation is cascading through plastics, fertilisers, and industrial chemicals, with downstream manufacturers facing margin compression.
- Shipping and marine insurance: Gulf war risk premiums are surging. Tankers are disabling AIS transponders and going operationally dark to avoid targeting, reducing market transparency.
- Fuel refining margins: Refining margins have hit record highs as tight product supply meets inelastic demand across multiple regions.
- European natural gas: Prices jumped directly on Hormuz escalation news as LNG alternatives competed with pipeline gas, demonstrating the cross-commodity transmission mechanism.
What the Crisis Reveals About Global Energy System Design
The 2026 Strait of Hormuz oil supply disruption is not merely a geopolitical event. It is a stress test that has revealed the structural limits of a global energy architecture built around the assumption that a 3.2-kilometre navigable corridor will remain perpetually open. Strategic petroleum reserves were designed for disruptions measured in weeks, not months. LNG infrastructure expansion timelines measured in years cannot respond to crises unfolding over days.
Mexico's Energia Costa Azul terminal, with 3.25 million tonnes per year of capacity, shipped its first cargo in July 2026. ADNOC ordered $900 million in new LNG carriers to expand its global fleet. These are meaningful long-term developments, but they arrive into a near-term crisis that long-lead capital investments cannot resolve.
Dubai is actively developing contingency infrastructure to reduce its own dependence on Hormuz transit, a signal that Gulf states are no longer treating chokepoint closure as a theoretical scenario. That recalibration, driven by proximity to the conflict rather than distant policy preferences, may prove to be the most durable strategic consequence of the crisis.
"Systemic Conclusion: The 2026 Hormuz disruption has exposed a fundamental design flaw in global energy security architecture. No emergency mechanism currently deployed, or deployable within a reasonable timeframe, can fully compensate for the removal of 10 to 14 million barrels per day from daily global supply. The lesson for policymakers, investors, and energy planners is that chokepoint risk was never a tail risk. It was always a central risk that was systematically mispriced."
This article is intended for informational purposes only and does not constitute financial, investment, or legal advice. All forecasts, scenario projections, and price trajectories referenced are based on available market data and analyst assessments as of mid-July 2026 and are subject to material change. Readers should conduct independent research before making any investment or commercial decisions based on information contained herein.
Want to Stay Ahead of the ASX Opportunities Emerging From the Global Energy Crisis?
The geopolitical shockwaves reshaping oil and gas markets are creating rapid shifts in ASX-listed energy and resources stocks, and Discovery Alert's proprietary Discovery IQ model delivers real-time alerts the moment significant mineral and energy discoveries are announced, ensuring subscribers can act on emerging opportunities before the broader market reacts. Explore how major discoveries have historically generated substantial returns on Discovery Alert's dedicated discoveries page, and begin your 14-day free trial today to position yourself ahead of the next market-moving event.