June 26, 2026
The Geopolitics of Price: How a Maritime Chokepoint Reset the Global Oil Market
Every few decades, a single geographic bottleneck reminds the world just how fragile energy supply chains really are. The Strait of Hormuz, a narrow waterway barely 33 kilometres wide at its most constrictive point, carries roughly 15% of the world's total oil supply on any given day. When that corridor closes, even partially, the consequences ripple across every petroleum-linked economy on earth. When it reopens, the correction can be just as violent as the spike that preceded it.
That dynamic is precisely what global energy markets are processing right now. Oil falls below $70 as Hormuz traffic returns, and what looked like a structurally elevated price regime just weeks ago has collapsed at a pace that has caught even seasoned commodity traders off guard. Understanding the crude market dynamics at play requires examining several converging forces simultaneously.
When big ASX news breaks, our subscribers know first
A 44% Drawdown in Three Months: Understanding the Speed of the Collapse
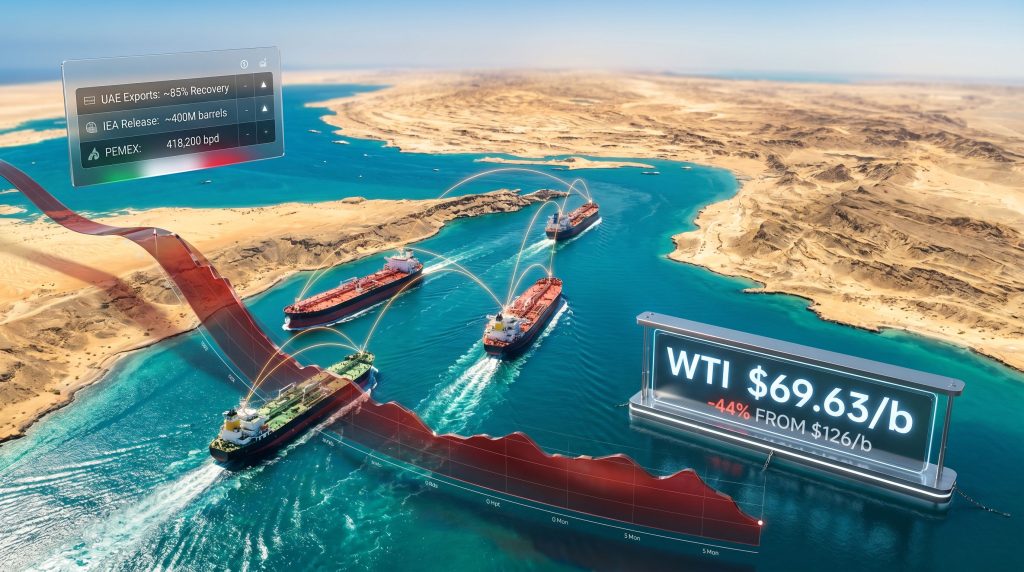
To appreciate how extraordinary the current price correction is, it helps to anchor it in historical context. Brent crude's wartime peak of $126 per barrel was not a fleeting spike but a sustained elevated level reflecting genuine supply disruption. The subsequent retreat to $73.83/b, a decline of 4.2% in a single session, and WTI's intraday low of $69.63/b on Wednesday, the first sub-$70 print since March 2, collectively represent something far more significant than routine volatility.
From peak to trough, crude markets have surrendered more than $56 per barrel across approximately three months. That is a 44% drawdown in a timeframe that rivals the 2020 COVID-driven demand collapse, yet with a fundamentally different structural cause. The 2020 sell-off was a demand destruction event. This one is a supply normalisation, and that distinction matters enormously for how the market recovers.
In demand-driven crashes, recovery depends on economic activity rebuilding consumption. In supply-normalisation events, recovery depends on the pace at which geopolitical risk is re-priced back into futures contracts, a process that can stabilise much faster once the underlying supply uncertainty resolves.
The $70/b threshold itself carries significant weight in energy markets. It functions as both a psychological reference point for traders and a technical level that separates backwardation (a futures curve structure signalling current supply tightness) from contango (a structure signalling anticipated oversupply ahead). The sustained move below this level signals that the market is no longer pricing for scarcity — it is beginning to price for abundance.
Six Simultaneous Forces Compressing the Price
Why Is This Sell-Off Structurally Unusual?
What makes the current sell-off structurally unusual is the convergence of multiple independent supply catalysts operating at the same time. Rather than a single trigger, the market is absorbing at least six distinct pressure sources simultaneously. Furthermore, the interplay between oil trade and geopolitics has rarely been more consequential in determining price direction.
| Supply Pressure Factor | Mechanism | Market Effect |
|---|---|---|
| Hormuz Reopening | IMO safety guarantees restore tanker transit | Eliminates acute disruption premium |
| US-Iran Peace MoU | 60-day framework toward final agreement | Reduces geopolitical risk pricing |
| UAE Export Recovery | Approximately 85% of pre-war levels restored | ~60 million barrels entering global supply |
| US Treasury Sanctions Waiver | Issued June 22; opens Iranian crude to buyers | Adds volume to recovering supply chain |
| IEA Coordinated Reserve Release | Approximately 400 million barrels released | Suppressed the price floor during conflict peak |
| Stranded Vessel Offloading | Previously trapped tankers now clearing cargoes | Creates short-term spot market oversupply |
Each of these factors would be individually meaningful. Together, they have overwhelmed even historically bullish inventory signals. The US Energy Information Administration reported that domestic crude stockpiles have fallen to their lowest level since 1984, with Cushing, Oklahoma, the physical delivery point for WTI futures contracts, dipping below operational minimum thresholds.
Under normal market conditions, this data would drive prices sharply higher. Instead, traders are discounting current inventory tightness and pricing forward toward the anticipated wave of Gulf barrels entering the market.
What Does Bearish Price Action Alongside Bullish Fundamentals Mean?
This is a rare and technically important divergence. When bearish price action co-exists with bullish fundamental data, it almost always reflects a market that has made a decisive forward-looking judgement about supply. The market is, in effect, telling participants that the barrels are coming, and that current scarcity is temporary.
In addition, the oil market trade war impact from broader geopolitical tensions continues to weigh on sentiment, adding another layer of complexity to an already volatile pricing environment.
The IMO's Role and the One Remaining Wildcard
The International Maritime Organization's intervention was the critical unlocking mechanism for the Hormuz normalisation. By securing formal safety guarantees that enabled commercial navigation to resume, the IMO facilitated the movement of more than 11,000 seafarers who had been stranded inside the Persian Gulf, unable to transit safely for an extended period.
IMO Secretary-General Arsenio Dominguez confirmed publicly that the necessary safety guarantees had been secured and that conditions for safe navigation had been thoroughly verified. Shipowners responded by resuming transits with active satellite tracking signals, a practical indicator of restored operational confidence that insurance underwriters and vessel operators monitor closely.
Critically, Iran confirmed that no tolls, insurance surcharges, or transit fees would be imposed on vessels using the strait. This was a significant concession that removed one of the most commercially disruptive potential outcomes from the risk calculus. However, a separate development has introduced renewed uncertainty: Iran and Oman have announced the opening of discussions on a joint Hormuz transit management framework, including potential fee structures.
This mechanism was absent from the June 17 Memorandum of Understanding text and represents the primary residual risk in an otherwise normalising corridor. If a formalised toll structure were to emerge, it would effectively introduce a permanent cost layer into global shipping economics. Analysts are watching this negotiation closely as the one variable most capable of interrupting the current price normalisation trajectory.
What the UAE Recovery Signals About Gulf Producer Strategy
The United Arab Emirates reaching approximately 85% of pre-war export levels, with roughly 60 million barrels recently sold from Persian Gulf storage and production, reveals something important about how Gulf producers with pipeline alternatives to Hormuz have been managing the conflict period.
The UAE operates the Abu Dhabi Crude Oil Pipeline, which bypasses the Strait of Hormuz entirely by routing crude to the port of Fujairah on the Gulf of Oman. This infrastructure advantage allowed the UAE to maintain export momentum even during the most acute phase of Hormuz disruption.
The fact that export recovery is already at 85% before full Hormuz normalisation suggests Gulf producers were not simply waiting for the strait to reopen. They were actively rebuilding export volumes through alternative routes while diplomatic progress unfolded. Furthermore, OPEC's market influence over production coordination has played a quietly significant role in managing the pace of this supply return.
This pre-positioning of Gulf export capacity is a dimension of the current supply recovery that is often underappreciated. The speed of the price correction reflects not only Hormuz reopening but also the quiet build-up of alternative channel exports throughout the conflict.
Mexico's Fiscal Arithmetic: From Windfall to Deficit Risk
How Does the Price Drop Affect Sovereign Budgets?
For commodity-dependent sovereign budgets, the arithmetic of oil price shifts is rarely symmetrical. Mexico's federal government constructed its 2026 budget on a reference oil price of $54.9 per barrel. During the conflict's peak pricing phase, Mexico's export crude blend reached as high as $106/b, nearly double the budget assumption, generating fiscal headroom that partially cushioned the country's structural PEMEX volume shortfall.
The SHCP's Pre-Criteria 2027 document, published in April, had already revised the 2026 oil price assumption upward to $77.3/b in recognition of wartime conditions. However, with current crude oil prices near $70 for WTI and the Mexican export blend historically trading at a $2 to $5 discount to WTI, the effective realised price for Mexican crude is now estimated at approximately $65 to $68 per barrel, below even the original conservative budget reference.
The compounding challenge is that Mexico's export volumes are running at approximately 418,200 barrels per day, roughly 20% below the SHCP's annual production target. Lower per-barrel revenue combined with structurally compressed export volumes creates a fiscal exposure that no single stabiliser mechanism can fully absorb.
Mexico's IEPS fuel subsidy mechanism does provide a partial automatic offset. At wartime crude price levels, the subsidy was costing approximately MX$2.5 billion per week. As international benchmarks decline, that weekly cost falls proportionally, freeing expenditure-side fiscal space. However, the spending-side relief from a lower subsidy bill does not fully compensate for the revenue-side loss when export volumes remain structurally constrained.
The fiscal risk for Mexico is not simply that oil prices have fallen. It is that they have fallen from a windfall level back through the budget reference price, converting what was a revenue surplus into a potential revenue shortfall within a single fiscal quarter.
The next major ASX story will hit our subscribers first
Infrastructure Repair, Mine Clearance, and the Medium-Term Price Floor
The near-term trajectory for oil prices is bearish, driven by recovering Gulf supply. However, the medium-term outlook is considerably more nuanced, and investors pricing in a sustained sub-$60 environment may be underestimating the structural constraints on supply recovery.
Physical damage to Middle Eastern energy production and export infrastructure is expected to require six months to two years of repair work before pre-conflict capacity levels are fully restored. This creates a bifurcated market dynamic: a flood of previously stranded cargoes and recovered UAE volumes in the short term, followed by a supply ceiling in the medium term as damaged upstream capacity recovers only gradually.
Additional operational complexities persist despite diplomatic progress:
- Vessel operators continue to face residual safety concerns from uncleared naval mines within the Persian Gulf
- Ships that were stationary for extended periods require thorough inspection, re-loading procedures, and crew changes before resuming normal commercial operations
- Insurance underwriters are expected to maintain elevated war-risk premiums on Persian Gulf routes until formal conflict resolution is fully documented and verified
- The Iran-Oman transit fee framework, if formalised, could reintroduce a structural cost layer into Hormuz shipping economics
These factors collectively suggest that the price floor is not as distant as the current sell-off momentum might imply. A market that has priced out the war premium may soon need to re-price for supply ceiling constraints.
The Pump Price Lag and Consumer Expectations
The disconnect between crude benchmark movements and retail gasoline prices is a source of recurring public frustration, and the current cycle is no exception. The standard transmission lag from crude price to retail pump price is two to four weeks, reflecting the time required for refiners and fuel distributors to work through higher-cost inventory purchased at wartime prices before passing savings downstream.
Consumers should anticipate meaningful gasoline price relief within approximately 30 days of sustained sub-$70 WTI pricing, assuming the current price level holds. Oil falls below $70 as Hormuz traffic returns, and the directional signal for motorists is clear: sustained crude price normalisation will eventually reach the forecourt, though the pace of pass-through will vary by region and refining configuration.
Disclaimer: This article contains forward-looking analysis, price projections, and fiscal scenario assessments. These represent analytical frameworks based on currently available data and should not be construed as financial or investment advice. Oil markets involve significant uncertainty, and actual price outcomes may differ materially from projections based on geopolitical developments, production decisions, and demand shifts.
Want to Stay Ahead of the Next Major Commodity Market Shift?
Discovery Alert's proprietary Discovery IQ model scans ASX announcements in real time, instantly identifying significant mineral discoveries across more than 30 commodities — including those directly tied to energy and resource market movements — and delivering actionable insights to subscribers before the broader market reacts. Explore historic discoveries and the exceptional returns they generated, then begin your 14-day free trial at Discovery Alert to position yourself ahead of the next major market opportunity.