June 19, 2026
When Chokepoints Dictate Markets: The Strait of Hormuz and the Architecture of Oil Price Risk
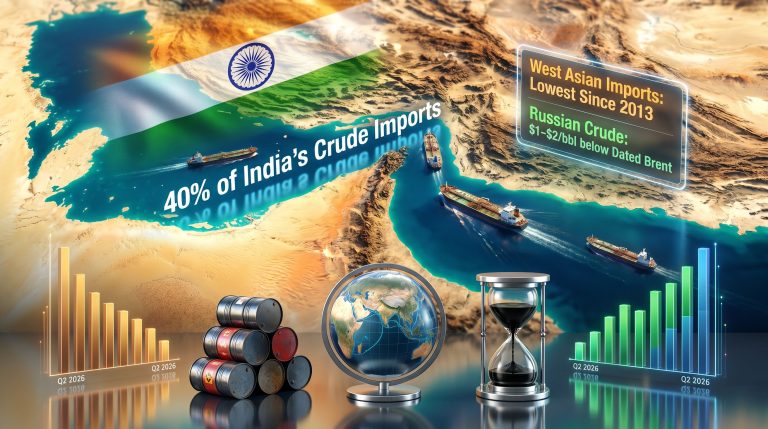
Energy markets have always been shaped less by geology than by geography. The location of reserves matters far less than the routes through which those reserves reach the world. No single geographic feature illustrates this principle more powerfully than the Strait of Hormuz, a narrow corridor of water barely 33 kilometres wide at its most constricted point, sandwiched between the Iranian coastline and the Omani peninsula. Understanding oil falls as supply starts moving through Strait of Hormuz requires examining both the physical and financial mechanics of this critical passage. Under normal conditions, roughly one-fifth of all globally traded oil and liquefied natural gas moves through here, translating to approximately 20 million barrels per day.
When big ASX news breaks, our subscribers know first
The Anatomy of the 2026 Supply Shock
How a Single Waterway Became the World's Most Dangerous Bottleneck
The disruption that preceded the current price decline was, by most historical measures, extraordinary. Following the outbreak of a U.S.-Israel air campaign against Iran in late February 2026, tanker traffic through the Strait of Hormuz collapsed by an estimated 90 to 95 percent. To put that in practical terms, a waterway that typically moves the equivalent of the world's entire daily oil demand had been effectively shut down.
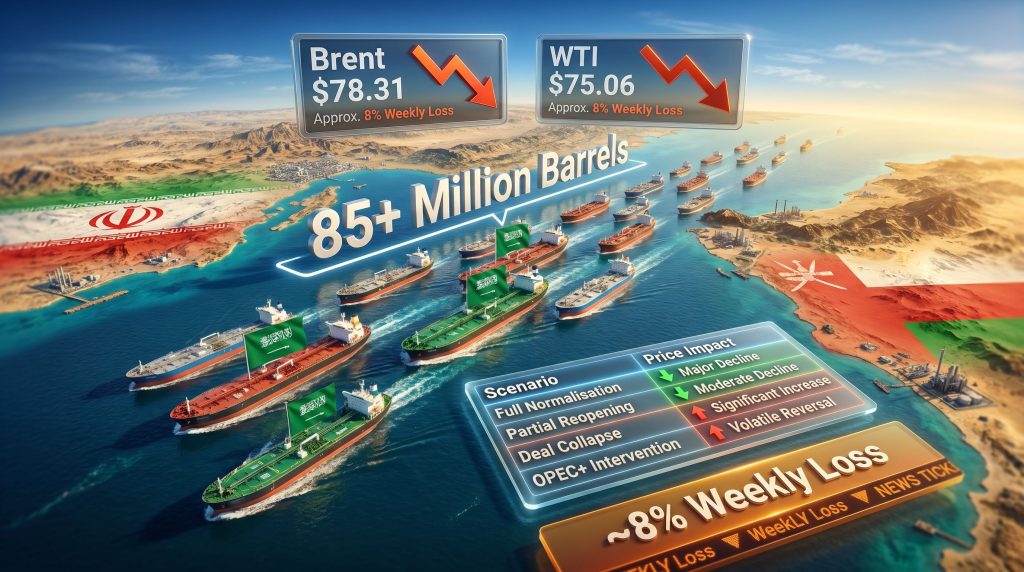
The consequences compounded rapidly. With no viable exit route for Middle East Gulf crude, oil produced in Saudi Arabia, Kuwait, Iraq, and Iran began accumulating in storage. Analysts eventually placed the total volume of stranded crude at more than 85 million barrels, representing roughly 85 days of total U.S. petroleum imports at recent consumption rates.
During the blockade period, both Brent crude and West Texas Intermediate futures carried a pronounced geopolitical risk premium, reflecting not just current supply constraints but trader anxiety about how long the disruption might last. The market was, in effect, pricing a worst-case duration into every barrel. Furthermore, geopolitical oil price drivers of this magnitude rarely resolve cleanly, which compounded market uncertainty.
The Market's Risk Premium Machine
Oil markets incorporate geopolitical risk through a mechanism that operates somewhat like an insurance premium embedded in spot and futures prices. When supply uncertainty is high, buyers accept elevated prices partly as compensation for the risk that anticipated supply does not materialise. This premium can persist well beyond the initial triggering event, because futures traders position based on scenarios rather than certainties.
The Hormuz blockade of early 2026 activated this mechanism at scale. Forward curves steepened, options volatility spiked, and physical buyers in Asia scrambled to secure alternative routing through the Cape of Good Hope, adding significant freight costs and delivery delays to their supply chains. Consequently, the oil price volatility trends observed during this period were among the most severe recorded in recent years.
Oil Falls as Supply Starts Moving Through Strait of Hormuz
What Changed on June 19, 2026?
The signing of a U.S.-Iran interim peace agreement by President Donald Trump fundamentally altered the supply calculus that had underpinned elevated oil prices for nearly four months. Within hours of the deal being formalised, tanker traffic began moving through the strait again. Among the first vessels to transit were three Saudi-flagged tankers carrying a combined six million barrels of crude, a symbolic and commercially significant reopening of the world's most consequential maritime corridor.
The immediate pricing response was swift. By early trading on June 19:
- Brent crude futures were trading at approximately $78.31 to $80.36 per barrel, down 54 cents or around 0.68 percent on the session
- WTI crude was changing hands in the range of $76.14 to $77.88 per barrel, off 46 cents or approximately 0.60 percent
- The more heavily traded August WTI contract, which displaced the expiring July front-month, was priced at around $75.06 per barrel
- Both benchmarks had already touched their lowest levels since early March 2026 on Thursday, June 18
The weekly performance tells the fuller story. Both Brent and WTI were tracking toward a loss of approximately 8 percent for the week of June 16 to 19, representing one of the sharpest seven-day declines in recent months and a direct consequence of the supply outlook shifting from acute scarcity to anticipated abundance.
Comparing the Price Movement in Context
| Metric | Pre-Blockade Baseline | During Blockade Peak | Post-Deal (June 19, 2026) |
|---|---|---|---|
| Tanker Traffic Through Strait | ~100% of normal | 5–10% of normal | Gradually normalising |
| Oil Stranded in Gulf Markets | Minimal | 85+ million barrels | Beginning to release |
| Brent Crude Direction | Elevated | Elevated with risk premium | Declining, ~8% weekly loss |
| WTI Direction | Elevated | Elevated with risk premium | Declining, ~8% weekly loss |
| Brent Price Range | Pre-war levels | Elevated | $78.31–$80.36/bbl |
| WTI Price Range | Pre-war levels | Elevated | $76.14–$77.88/bbl |
The Three Supply Channels Now Unlocking
Understanding the Multi-Layer Supply Response
The price decline reflects not a single development but three overlapping supply dynamics activating simultaneously, each with its own timeline and market impact.
1. Physical Reopening of the Strait
The most immediate and visible driver. Saudi tankers moving through the strait within hours of the deal provided the clearest possible signal that the physical barrier had lifted. For commodity traders waiting for hard evidence of normalisation rather than political declarations, this represented the first tangible data point.
2. Lifting of U.S. Sanctions on Iranian Oil
The interim agreement also includes a framework for removing American sanctions on Iranian crude exports. Iran holds the world's fourth-largest proven oil reserves, estimated at approximately 208 billion barrels according to the U.S. Energy Information Administration, and its export capacity at full throttle represents a meaningful addition to global supply. The pace of sanctions removal, however, remains subject to implementation timelines that have not been fully clarified.
3. Gulf Producer Export Resumption
Kuwait Petroleum Corporation formally lifted all force majeure notices effective immediately. Iraq's Oil Minister Basim Mohammed confirmed that all oilfields were operationally ready to resume production, with a gradual ramp-up planned. In addition, Saudi Arabia's initial tanker movements suggest immediate resumption intent, reinforcing the broader supply recovery signal.
| Producer | Force Majeure Status | Production Readiness | Export Timing |
|---|---|---|---|
| Saudi Arabia | Lifted | Immediate | Tankers already transiting |
| Kuwait | Lifted immediately | Ready to resume | Immediate |
| Iraq | Lifting in progress | Fields operationally ready | Gradual ramp-up |
| Iran | N/A | Subject to deal terms | Dependent on sanctions removal timeline |
Trader Psychology and the "Show Me" Threshold
Why Markets Are Not Fully Pricing the Bearish Scenario Yet
Despite the scale of the supply shift underway, oil prices have not collapsed. The approximately 8 percent weekly loss, while significant, suggests traders are applying a meaningful discount to the full bullish supply scenario. This caution reflects a well-established pattern in commodity market psychology: the distinction between a policy announcement and verified physical delivery.
KCM chief market analyst Tim Waterer articulated this dynamic clearly, noting that commodity traders were still waiting for confirmation that tanker traffic through the strait was genuinely normalising on a sustained basis. The observation captures a broader principle in energy market behaviour: geopolitical resolutions are treated as conditionally true until tanker tracking data, port call records, and physical delivery confirmations validate the diplomatic headline.
"This cautious posture is keeping a floor under prices in the short term. Scepticism in commodity markets does not disappear with a handshake; it retreats only when consistent physical evidence accumulates over days and weeks."
There is also a technical market dynamic worth noting. The July WTI front-month contract was set to expire on Monday, June 22, 2026, which typically generates elevated volatility and positioning adjustments in preceding days. This contract rollover dynamic may be amplifying some of the price movements observed around June 19, as traders close or roll July positions into August.
The Geopolitical Residual: Why Risk Has Not Fully Dissipated
The Israel-Hezbollah Variable
The U.S.-Iran agreement addresses one conflict axis but not the full regional picture. As of June 19, 2026, Israel's military operations against Hezbollah in Lebanon remained active, introducing a meaningful question about the durability of the broader regional settlement. The deal is described as an interim agreement, a categorisation that carries its own ambiguity — implying unresolved issues and a structured negotiation process still ahead.
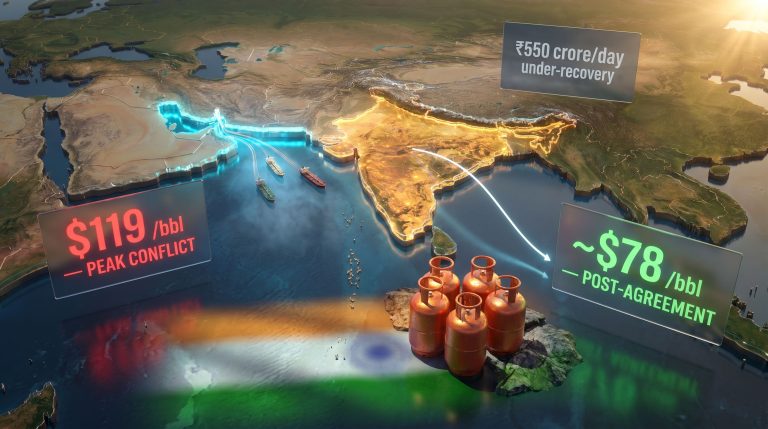
For oil markets, the relevant risk scenario is straightforward: if regional hostilities escalate in ways that pull Iran back into active confrontation, the strait could be disrupted again. The risk premium that unwound so sharply during the week of June 16 to 19 could reinstall itself rapidly, potentially driving Brent back above the $85 level within days of any confirmed disruption. However, for now, the crude oil market overview remains cautiously bearish.
Historical Precedent: The 2015 JCPOA Comparison
The inclusion of Iranian sanctions relief in the interim deal invites comparison with the 2015 Joint Comprehensive Plan of Action. When U.S. sanctions on Iranian oil were lifted under the JCPOA framework, Iranian exports increased by approximately one million barrels per day within six months, contributing to a global supply glut that helped drive Brent crude below $30 per barrel by early 2016.
The 2026 situation differs in important respects, including the existence of a large stranded supply overhang that must first be absorbed, and an OPEC+ grouping that has shown willingness to intervene in production policy. Furthermore, OPEC's market influence remains a critical counterweight to any rapid supply-driven price collapse. However, the historical parallel suggests that the sanctions removal component could have a longer and more structurally significant bearing on oil prices than the immediate tanker traffic normalisation.
The next major ASX story will hit our subscribers first
Scenarios for Oil Price Direction in H2 2026
A Framework for Thinking About the Range of Outcomes
| Scenario | Key Assumption | Brent Price Direction | Probability Assessment |
|---|---|---|---|
| Full Normalisation | Deal holds, sanctions lifted, tankers flow freely | Sustained decline toward $70–$75 range | Moderate |
| Partial Reopening | Tanker traffic recovers but Iranian barrels delayed | Stabilisation in $76–$82 range | High near-term |
| Deal Collapse | Regional escalation disrupts agreement | Sharp reversal above $85 | Lower but non-trivial |
| OPEC+ Intervention | Production cuts offset new supply | Price floor defended at $78–$80 | Dependent on member compliance |
The partial reopening scenario appears most consistent with current price action. The market is pricing in a high probability that tanker traffic resumes and Gulf producer exports return to normal, but a lower probability that Iranian barrels flow freely in the near term. In addition, trade war oil impacts continue to weigh on the demand side of the equation, further complicating any bullish price recovery thesis.
Frequently Asked Questions
Why did oil fall as supply started moving through the Strait of Hormuz?
The resumption of tanker traffic signalled that more than 85 million barrels of crude stranded in Middle East Gulf markets could re-enter global supply. Simultaneously, the lifting of U.S. sanctions on Iranian oil expanded the long-term supply outlook. Together, these developments removed a large portion of the risk premium that had been embedded in Brent and WTI futures during the blockade period.
How much oil passes through the Strait of Hormuz under normal conditions?
Under normal operating conditions, the strait carries approximately one-fifth of all globally traded oil and liquefied natural gas, equivalent to roughly 20 million barrels per day. This single passage serves as the only maritime exit route for crude produced in Saudi Arabia, Iraq, Kuwait, the UAE, Qatar, and Iran destined for Asian and European markets.
What caused the tanker traffic collapse in early 2026?
The outbreak of a U.S.-Israel air campaign against Iran in late February 2026 prompted Iran to largely block passage through the strait, reducing tanker transit volumes by an estimated 90 to 95 percent relative to normal levels.
What are the main risks that could push oil prices higher again?
The primary upside risk for oil prices is a breakdown of the U.S.-Iran interim agreement, most plausibly triggered by escalation of Israel's ongoing conflict with Hezbollah in Lebanon. A fracturing of the deal would likely reinstate transit disruptions and rapidly restore the supply risk premium in Brent and WTI futures.
How long will full supply normalisation take?
Analysts suggest that trade through the strait could return to normal levels within the coming months if the interim agreement holds. Iraq has signalled a gradual production ramp-up to restore pre-conflict output rates, while Kuwait has already lifted all force majeure declarations. The timeline for Iranian barrels re-entering the market remains more uncertain, contingent on the pace of sanctions removal under the deal framework.
Disclaimer: This article contains forward-looking analysis and scenario projections based on publicly available information as of June 19, 2026. Oil price forecasts and geopolitical assessments involve material uncertainty and should not be construed as financial advice. Readers should conduct independent research before making investment decisions.
Want to Capitalise on the Market Moves Driven by Major Commodity Discoveries?
While geopolitical events like the Strait of Hormuz disruption dominate oil price headlines, significant mineral discoveries on the ASX can generate equally dramatic market movements — and Discovery Alert's proprietary Discovery IQ model delivers real-time alerts the moment those opportunities emerge, transforming complex geological data into actionable insights for investors at every level. Explore historic discovery returns on Discovery Alert's dedicated discoveries page and begin a 14-day free trial to position yourself ahead of the broader market.