July 29, 2026

The Supply-Recovery Gap That Oil Markets Are Quietly Pricing In
Energy markets have long operated on an asymmetry that political leaders consistently underestimate: conflict destroys supply capacity in hours, but physical infrastructure takes months to rebuild. This fundamental mismatch between the speed of disruption and the pace of recovery sits at the heart of why oil prices have responded only modestly to optimistic diplomatic signals coming out of Washington. When political timelines and physical realities diverge, experienced energy traders tend to trust the barrels, not the rhetoric.
That dynamic is playing out in real time across global crude benchmarks. Despite repeated suggestions from US President Donald Trump that the conflict with Iran will conclude rapidly, oil markets are telling a more complicated story. The search term oil falls after Trump says US will end Iran war very quickly has trended across financial media, but the scale of those price declines reveals just how cautious the market truly is about pricing in a resolution.
When big ASX news breaks, our subscribers know first
What the Price Moves Actually Reveal
On May 20, 2026, Brent crude futures declined 88 cents, or approximately 0.8%, settling at $110.40 per barrel, while US West Texas Intermediate fell 67 cents, or 0.6%, to $103.48 per barrel. A day earlier, both benchmarks had slipped close to $1 following comments from Vice President JD Vance suggesting diplomatic momentum between Washington and Tehran.
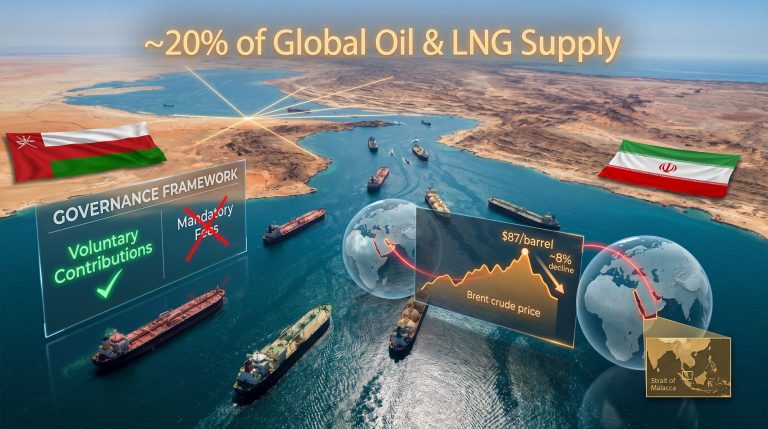
These are not the kinds of price moves consistent with a market that genuinely believes the conflict is nearly over. For context, Brent had surged roughly 8% to around $109 per barrel in the immediate aftermath of the conflict's escalation. The relatively muted pullback on peace signals compared to the sharp rally on hostility escalation tells traders something critical: the market views downside risk from diplomacy as limited, while upside risk from continued conflict remains substantial. Understanding oil trade geopolitics helps explain why these dynamics are so persistent.
The Asymmetric Reaction Function in Energy Markets
This behavioural pattern, where oil prices spike harder on bad geopolitical news than they fall on good news, is well documented in energy economics. Several structural reasons explain it:
- Physical supply cannot be restored as quickly as it was disrupted, so the market discounts peace optimism with a lag
- Diplomatic announcements frequently precede durable agreements by weeks or months, introducing credibility risk
- Infrastructure damage assessments in conflict zones take time to quantify, keeping uncertainty elevated even after hostilities ease
- Tanker operators and shipping insurers remain risk-averse until formal ceasefire agreements are signed and verified
Citi analysts have framed this directly in institutional terms, issuing a $120 per barrel near-term Brent price target and arguing that oil markets are materially under-pricing the risk of prolonged supply disruption and broader geopolitical tail risks. That forecast sits well above current trading levels, suggesting major institutional desks are not positioned for a rapid return to normalcy.
Decoding Washington's Contradictory Signals
Part of what makes this market environment exceptionally difficult to navigate is the frequency and inconsistency of official US statements. Furthermore, the oil market effects of these contradictory positions compound the challenge for traders attempting to price risk accurately. Within a compressed timeframe, the following positions have all been communicated publicly:
| Trump Statement | Market Implication |
|---|---|
| The war will end very quickly | Bearish, reduces near-term risk premium |
| The US may need to strike Iran again | Bullish, escalation risk rises |
| Iran's leaders are begging for a deal | Mildly bearish, suggests Tehran is under pressure |
| A new US attack could occur within days | Strongly bullish, imminent hostility risk |
| Was an hour away from ordering a strike before pausing | Bullish, underscores how fragile the current pause is |
This daily rotation between hawkish and conciliatory messaging creates a challenging environment for risk pricing. Toshitaka Tazawa, an analyst at Fujitomi Securities, has noted that the US position is shifting on a daily basis, making it genuinely difficult for investors to determine whether Washington and Tehran can find common ground. That uncertainty alone, he has argued, is sufficient to maintain a meaningful floor under prices even during apparent progress in negotiations.
Why a Ceasefire Is Not the Same as a Supply Recovery
One of the most commonly misunderstood aspects of oil market dynamics during armed conflict is the distinction between the end of hostilities and the restoration of supply capacity. These are not the same event, and the time gap between them is often substantial.
Emril Jamil, a senior oil research analyst at LSEG, has articulated this clearly in his published commentary, noting that even if a deal is concluded, supply is unlikely to return to pre-war levels immediately, meaning that prices could retain upside potential well beyond any ceasefire announcement.
The physical barriers to rapid supply recovery include:
- Refinery and pipeline infrastructure damaged during conflict requires engineering assessments before restart, followed by phased recommissioning that typically spans weeks to months
- Wellhead and upstream facilities in conflict zones must be inspected for structural integrity before resuming production
- Tanker logistics need to be rebuilt from scratch in terms of scheduling, insurance underwriting, and crew deployment
- Producer confidence among national oil company operators and IOC partners must be re-established before capital commitments return
None of these processes respond to a diplomatic announcement. They operate on industrial timescales, not news cycles.
The Strait of Hormuz: A Chokepoint Under Sustained Pressure
Approximately 20% of global oil supply transits the Strait of Hormuz under normal conditions, making it the single most strategically sensitive maritime passage in energy markets. The conflict has reduced tanker traffic through the Strait to well below the pre-war baseline of roughly 130 ships per transit cycle, a disruption with cascading consequences for Asian refining economies that depend on Gulf crude.
The scale of that disruption was illustrated in stark terms on May 20, 2026, when two Chinese supertankers carrying a combined 4 million barrels of West Asian crude oil finally cleared the Strait after being stranded in the Gulf for more than two months. Under normal operating conditions, those vessels would have transited within days of loading. The more than 60-day delay encapsulates the severity of what has occurred at the world's most critical oil chokepoint. Analysts tracking geopolitical oil trends have highlighted this development as a critical signal of sustained market stress.
How the Global Supply System Is Absorbing the Shortfall
In the absence of normal Hormuz transit volumes, the global energy system has deployed several compensating mechanisms, each of which carries its own limitations and depletion risks:
| Compensating Mechanism | Key Constraint |
|---|---|
| Strategic Petroleum Reserve (SPR) releases | Finite volumes; political limits on drawdown pace |
| Commercial inventory liquidation | Accelerates drawdown; not self-replenishing |
| Extended routing via Arabian Peninsula | Higher shipping costs, longer delivery times |
| Demand reduction in price-sensitive markets | Limited in scope; industrial users cannot adjust quickly |
The crucial insight here is that none of these mechanisms add new barrels to the global system. They redistribute existing supply while the primary source of disruption remains unresolved.
US Inventory Drawdowns: The Market's Most Reliable Leading Indicator
Weekly US Energy Information Administration (EIA) inventory data has become the most closely watched real-time indicator of how effectively the global supply system is absorbing the Hormuz disruption. The pattern over recent weeks is unambiguous. Monitoring US crude inventories provides one of the clearest windows into how the broader market is coping with ongoing supply constraints.
According to American Petroleum Institute data cited by market sources, US crude inventories have fallen for five consecutive weeks. A Reuters poll of analysts estimated that the week ending May 15, 2026 would show a decline of approximately 3.4 million barrels, with fuel stocks also declining in the same period. The EIA's official weekly release was due on May 20, 2026 and is widely expected to confirm the trend.
Five consecutive weeks of inventory drawdowns is not noise. It signals that the global market is actively consuming buffer stocks to offset the Hormuz supply gap, and that those buffers are finite.
The sequential nature of the drawdowns is particularly significant. Each week of continued decline reduces the cushion available to absorb further disruption, meaning that the global system's tolerance for an extended conflict is shrinking. If transit volumes through the Strait do not recover, the pace of drawdowns will likely accelerate, adding structural upward pressure to prices regardless of diplomatic progress.
Three Scenarios for Oil Prices as Negotiations Evolve
Rather than treating the situation as a binary peace-or-war outcome, experienced energy analysts model a range of scenarios with materially different supply recovery trajectories:
Scenario 1: Rapid Peace Deal with Full Compliance
- Minimum timeline to supply normalisation: 6 to 12 weeks
- Brent price trajectory: Gradual decline toward the $90 to $95 range over the following quarter
- Assessment: Low probability given the complexity of US-Iran nuclear and security negotiations
Scenario 2: Partial Ceasefire with Residual Tensions
- Timeline to supply normalisation: 3 to 6 months
- Brent price trajectory: Sustained elevation near $100 to $110 with periodic volatility spikes
- Assessment: Moderate probability; reflects the most historically common outcome in Middle East conflict resolution
Scenario 3: Renewed Escalation or Fresh US Military Action
- Timeline to supply normalisation: Indeterminate
- Brent price trajectory: Potential surge toward or beyond Citi's $120 per barrel target
- Assessment: Non-trivial probability given Trump's explicit statement that a new strike could occur within days
Disclaimer: These scenarios are analytical frameworks based on publicly available market data and commentary. They do not constitute financial advice. Oil price forecasting involves substantial uncertainty, and actual outcomes may differ materially from any scenario described.
The next major ASX story will hit our subscribers first
What Sophisticated Traders Are Actually Watching
Beyond daily headline risk from Washington, the traders and portfolio managers who operate in energy markets professionally are tracking a more specific set of indicators. Understanding these variables provides a clearer picture of where prices are genuinely headed. OPEC market influence furthermore adds another layer of complexity to these assessments, as member nations weigh their own production responses to the ongoing disruption.
Short-Term (0 to 4 weeks):
- Daily diplomatic communications from US and Iranian officials
- Weekly EIA inventory data releases
- Reported tanker transit volumes through the Strait of Hormuz
- Any confirmed US military activity in the region
Medium-Term (1 to 3 months):
- Infrastructure damage assessment reports from affected production zones
- Insurance market conditions for Persian Gulf shipping lanes
- OPEC+ production policy responses to the supply disruption
- Progress on verified ceasefire or peace framework
Long-Term (3 to 12 months):
- Whether Iranian export capacity returns to pre-conflict levels or faces permanent impairment through sanctions, damage, or political restructuring
- Structural demand shifts driven by elevated prices in price-sensitive Asian markets
- The degree to which SPR drawdowns in the US, Europe, and Asia require rebuilding, which typically suppresses future spot demand
A particularly underappreciated factor in this environment is the role of war risk insurance premiums in the tanker market. When underwriters classify a maritime zone as a war risk area, vessel operators face dramatically higher insurance costs, which function as an effective surcharge on every barrel transiting that route. These elevated premiums typically persist for weeks to months after active hostilities cease, meaning the cost of Hormuz transits remains elevated even in a ceasefire scenario. The Guardian's coverage of the oil price drop following Trump's earlier statements illustrates how quickly sentiment can shift, even without a corresponding change in physical supply conditions.
Frequently Asked Questions: Oil Prices and the Iran War
Why did oil prices fall after Trump said the Iran war would end quickly?
Markets partially discounted geopolitical risk premium on optimistic diplomatic language, producing a modest short-term decline. However, the drop was constrained because the physical supply recovery timeline extends well beyond any ceasefire announcement. As oil falls after Trump says US will end Iran war very quickly, experienced traders remain sceptical that diplomatic words translate directly into restored barrels.
What is Brent crude trading at amid the Iran conflict?
As of May 20, 2026, Brent crude was trading at approximately $110.40 per barrel, down 0.8% on the day. US WTI was at $103.48 per barrel, down 0.6%.
What is Citi's oil price forecast for the near term?
Citi issued a near-term Brent price target of $120 per barrel, arguing that markets are under-pricing the duration and severity of supply disruption risk.
How has the Strait of Hormuz been affected by the conflict?
Tanker traffic has fallen well below the pre-war norm of approximately 130 ships per transit cycle. Two Chinese supertankers carrying 4 million barrels only cleared the Strait after being stranded for more than two months. CNBC's reporting on the Trump-Iran developments provides additional context on how these maritime disruptions are being framed in financial media.
How many weeks have US crude inventories been declining?
US crude inventories have declined for five consecutive weeks, with the week ending May 15, 2026 estimated to show a drawdown of approximately 3.4 million barrels based on Reuters poll consensus.
Could oil prices actually fall sharply if the Iran war ends?
While politically appealing, this outcome is unlikely to materialise quickly. Infrastructure repair, logistics rebuilding, and restored producer confidence all operate on industrial timescales, meaning any sustained price decline would be gradual rather than immediate.
Key Takeaways for Energy Market Participants
- Political messaging and market pricing operate on fundamentally different timescales, and traders consistently weight physical supply data over diplomatic statements
- The Strait of Hormuz disruption remains the dominant near-term price variable, with tanker transit volumes serving as the most direct observable measure
- Five consecutive weeks of US inventory drawdowns confirm that global buffer stocks are being actively consumed to offset the supply gap
- Citi's $120 per barrel Brent forecast reflects institutional conviction that the duration of disruption is being systematically underpriced
- War risk insurance premiums in tanker markets will keep effective shipping costs elevated even after hostilities formally cease, extending the supply recovery timeline
- The asymmetry between conflict-onset and supply-recovery speed means ceasefire announcements are necessary but not sufficient conditions for meaningful price normalisation
- Weekly EIA inventory data, Hormuz transit volumes, and the tone of US-Iran diplomatic communications represent the three highest-value indicators for tracking how this situation develops
This article is intended for informational purposes only and does not constitute financial, investment, or trading advice. Energy market conditions are subject to rapid change, and all price forecasts referenced reflect analyst estimates published as of the dates cited. Readers should conduct independent research before making any investment decisions.
Want to Stay Ahead of the Next Major Commodity Discovery Driving Market Moves?
While energy geopolitics reshape global commodity markets, Discovery Alert's proprietary Discovery IQ model scans ASX announcements in real time, delivering instant alerts on significant mineral discoveries — from oil and gas to critical minerals — so subscribers can identify actionable opportunities before the broader market reacts. Start your 14-day free trial today and see why major discoveries on the Discovery Alert discoveries page have historically generated substantial returns for well-positioned investors.