July 22, 2026
When Inventory Data Stops Telling the Whole Story
Global oil markets have long operated on the assumption that rising stockpiles are bearish and falling inventories are bullish. It is a framework so deeply embedded in commodity trading culture that it shapes everything from algorithmic triggers to headline interpretations. However, this mechanical relationship between inventory levels and price direction has been fracturing in meaningful ways, and the week ending 17 July 2026 provided one of the clearest illustrations of that breakdown in recent memory.
When US oil and product inventories build across the board simultaneously — covering crude, gasoline, and distillates within a single reporting week — the instinctive market reaction is to anticipate price weakness. What happened instead was a sharp rally in both Brent and WTI futures, driven by a geopolitical risk premium that increasingly overrides fundamental supply-demand arithmetic. Understanding why requires moving beyond the headline numbers and examining the structural context in which these builds are occurring. Our oil price volatility guide explores this dynamic in further depth.
When big ASX news breaks, our subscribers know first
What the EIA Weekly Data Actually Showed for the Week Ending 17 July 2026
The US Energy Information Administration reported an across-the-board increase in petroleum inventories for the reference week, with each major category registering a build.
| Inventory Category | Weekly Change | Current Level | vs. 5-Year Seasonal Average |
|---|---|---|---|
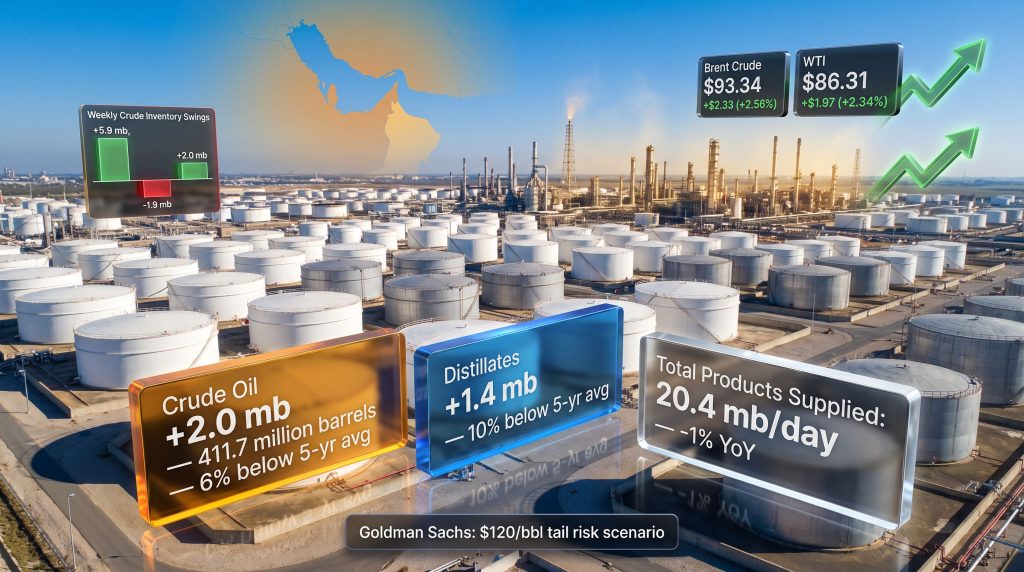
| Crude Oil (Commercial) | +2.0 million barrels | 411.7 million barrels | -6% below average |
| Motor Gasoline | +800,000 barrels | N/A | N/A |
| Middle Distillates | +1.4 million barrels | N/A | -10% below average |
Critical context: These builds are happening against a backdrop of structurally depleted inventories. Both crude and distillate stockpiles sit materially below their five-year seasonal norms, which means accumulation is occurring from a position of relative tightness, not from one of excess.
The American Petroleum Institute had released its private-sector estimate one day prior, reporting a crude build of +2.603 million barrels. The EIA's official figure came in at +2.0 million barrels, directionally consistent with the API preview even if the magnitude differed slightly. Traders routinely use the API figure as a directional signal the night before the official release, with the EIA publication serving as the authoritative government benchmark that markets ultimately price against.
Why the API-EIA Gap Matters to Traders
The difference between the API estimate and the EIA print is not merely a rounding exercise. It reflects the methodological distinction between voluntary industry reporting and statistically verified government data. When both figures point in the same direction, as they did here, the signal carries greater conviction. Furthermore, when they diverge directionally, it tends to create short-term volatility as the market reassesses which estimate better captured actual flows during the week.
The Paradox: Why Did US Oil and Product Inventories Build During a Hormuz Disruption?
At first glance, a week in which inventories build across all three major petroleum categories would seem incompatible with a global supply shock. The Strait of Hormuz, through which approximately 20 to 21 percent of global oil trade transits under normal conditions, was facing severe disruption at the time of this data release. Tanker operators were avoiding the strait, rerouting cargo, or delaying shipments entirely. A Kuwaiti tanker had been struck in the waterway, further elevating anxiety across shipping markets.
Yet US stockpiles grew. Several structural mechanisms explain this apparent contradiction:
-
Price-induced demand suppression — Elevated pump prices were already moderating discretionary fuel consumption, slowing the pace at which inventories were being drawn down at the consumer level.
-
Refinery throughput outpacing end-user absorption — When domestic refineries increase run rates, the resulting product output can temporarily exceed the rate at which consumers purchase fuel, generating surpluses even as input costs rise.
-
Import rerouting toward Atlantic Basin and Western Hemisphere suppliers — US refiners, less directly dependent on Hormuz-transiting crude than Asian importers, were able to redirect procurement toward alternative supply origins, maintaining inflow volumes.
-
Precautionary front-loading of crude purchases — Refiners and trading houses anticipating further price increases had incentive to accelerate procurement ahead of any escalation, temporarily boosting crude inflows and inventory levels.
This dynamic illustrates a rarely discussed feature of commodity markets: supply disruptions in one region can trigger procurement acceleration elsewhere, temporarily inflating inventories in markets that are insulated from the direct shock. The geopolitical oil market dynamics at play here are central to understanding why surface-level bearish signals are often misleading during periods of acute global stress.
Distillate Markets: The Build That Does Not Resolve the Deficit
Middle distillates — covering diesel, heating oil, and jet fuel — recorded a 1.4 million barrel build for the reference week. Average daily distillate production rose to 5.3 million barrels per day, and the four-week average of distillate demand came in at 3.7 million barrels per day, representing a +2.2% year-over-year increase.
Despite the weekly accumulation, distillate inventories remain 10% below the five-year seasonal average. This matters for several reasons:
-
Distillates are the workhorse fuels of industrial economies, powering freight transport, agricultural machinery, construction equipment, and heating systems.
-
A 10% structural deficit relative to seasonal norms means the market enters any demand surge from a vulnerable position.
-
The positive year-over-year demand trend suggests industrial and freight activity has not meaningfully softened, unlike consumer gasoline demand.
-
Any seasonal uptick in heating oil demand, or an acceleration in freight volumes, could rapidly reverse a 1.4 million barrel weekly build.
Investor implication: The distillate segment is arguably the tightest part of the US petroleum complex. A single week of stronger-than-expected demand or a supply disruption affecting refinery throughput could eliminate the modest buffer provided by this build within days.
Crude Futures Rally Despite Bearish Inventory Print: The Hierarchy of Price Drivers
On the day of the EIA release, Brent crude futures were trading at $93.34 per barrel, up $2.33 or 2.56% on the session. WTI gained $1.97 or 2.34%, trading at $86.31. Both benchmarks had risen approximately $9 per barrel compared to the same point the prior week.
| Benchmark | Price at Release | Daily Change | Weekly Gain |
|---|---|---|---|
| Brent Crude | $93.34/bbl | +$2.33 (+2.56%) | ~+$9.00/bbl |
| WTI Crude | $86.31/bbl | +$1.97 (+2.34%) | N/A |
The market's upward response to a bearish inventory print reflects a pricing hierarchy that has reasserted itself during periods of acute geopolitical stress. In normal conditions, inventory data carries significant weight in setting short-term price direction. When geopolitical disruption of sufficient magnitude occupies the market's attention, however, fundamental supply-demand signals are effectively subordinated to risk premium calculations.
Goldman Sachs had publicly warned that oil could reach $120 per barrel if the Middle East conflict extended further, a tail-risk scenario that traders were actively pricing into forward curves. At a commercial crude stockpile level of 411.7 million barrels, sitting 6% below the five-year average, a 2 million barrel weekly build does not materially close the structural deficit. The market recognised this, choosing to look through the bearish surface reading toward the forward supply risk.
The Role of the Geopolitical Risk Premium in Modern Oil Pricing
One of the less commonly understood aspects of crude oil price formation is how the geopolitical risk premium functions as a floating component layered on top of physical market fundamentals. This premium reflects the probability-weighted cost of future supply disruption rather than current scarcity. Consequently, when traders price in a Hormuz closure scenario, they are not responding to today's inventory level but to the distribution of possible outcomes over the coming weeks and months.
This distinction has important implications for how weekly EIA data should be interpreted during crisis periods. A build that would ordinarily trigger selling pressure can be entirely absorbed by an expanding risk premium without any net downward price effect. The trade war impact on oil similarly demonstrates how macro-level risk events restructure the relationship between fundamentals and pricing.
Decomposing US Petroleum Demand: Where Softness and Resilience Diverge
Total products supplied — the EIA's primary aggregate demand proxy — averaged 20.4 million barrels per day across the most recent four-week period. This represented a 1% decline year-over-year, consistent with price-induced consumption moderation beginning to register in the data.
The demand picture, however, is not uniform across product categories:
-
Gasoline demand averaged 8.9 million barrels per day over four weeks, against average daily production of 9.7 million barrels per day. The production-to-consumption surplus of roughly 800,000 barrels per day directly explains the weekly gasoline inventory build. Notably, the prior week had recorded a 1.5 million barrel gasoline draw, making the swing to accumulation significant.
-
Distillate demand averaged 3.7 million barrels per day, up 2.2% year-over-year, representing the bright spot in an otherwise softening demand environment. This resilience reflects continued activity in the freight, agricultural, and industrial sectors.
Demand context: US gasoline prices had climbed back above $4 per gallon in the period preceding this data release, a psychological threshold historically associated with noticeable consumer behavioural change. The 1% year-over-year decline in total products supplied is consistent with this price signal beginning to suppress discretionary fuel consumption.
The next major ASX story will hit our subscribers first
The Broader Inventory Picture: Structural Context and Week-to-Week Volatility
Placing the week ending 17 July within a multi-week rolling context reveals considerable volatility rather than a consistent directional trend. This volatility is itself informative, reflecting the operational difficulty refiners and traders face in optimising supply chains during active geopolitical disruption.
| Reporting Week | Crude Change | Gasoline Change | Distillate Change |
|---|---|---|---|
| Week of July 17, 2026 | +2.0 mb | +0.8 mb | +1.4 mb |
| Prior week | -1.9 mb | +5.8 mb | +5.0 mb |
| Earlier period | +5.9 mb | ~flat | +4.8 mb |
| Earlier reference | +244,000 bbl | -4.5 mb | -5.0 mb |
The high week-to-week variability across all three product categories underscores why single-week readings carry limited analytical weight when read in isolation. A more reliable signal emerges from examining the rolling four-week averages that the EIA publishes alongside weekly snapshots. According to Reuters, this broader context of crude stockpile movements has been a recurring theme throughout recent reporting cycles.
What the Five-Year Average Baseline Reveals About Structural Tightness
The EIA's use of a rolling five-year seasonal average as a reference benchmark serves as one of the most practically useful tools for assessing whether current inventory levels represent tightness or excess relative to historical norms. At 6% below the five-year average for crude and 10% below for distillates, the US petroleum complex is operating from a position of structural vulnerability rather than comfortable buffer.
This baseline deficit means that even several consecutive weeks of inventory builds would be required before stockpiles return to seasonal norms. Until that gap closes, the market will likely continue treating supply disruption scenarios with elevated seriousness. In addition, OPEC's influence on oil markets remains a critical variable in determining how quickly that structural gap narrows.
Global Context: How the Hormuz Crisis Amplifies Every US Inventory Reading
The significance of US oil and product inventories build data is amplified during periods of Hormuz stress because the strait's closure scenarios carry cascading consequences across global refinery supply chains. India had pulled back from Iraqi crude purchases due to Hormuz transit risk, redirecting demand toward alternative suppliers. LNG shipments through the strait had slowed sharply. Tanker operators were demanding war risk premiums that materially changed the economics of Middle Eastern crude flows.
US refiners, with access to domestic shale production and Atlantic Basin alternatives, face considerably less direct Hormuz exposure than their Asian counterparts. However, price contagion is unavoidable in a globally integrated crude market. A sustained $9 per barrel weekly price gain demonstrates how quickly geopolitical stress translates into cost pressures across the entire downstream value chain, regardless of physical proximity to the disruption.
The US also reported that China had reduced Iranian oil purchases by approximately 40%, a development that, if sustained, would further alter global crude trade flow patterns. Furthermore, the dynamics of oil prices and US-China trade tensions add another layer of complexity to how these rerouted volumes ultimately affect Atlantic Basin pricing.
Key Takeaways for Energy Market Participants
For traders, analysts, and energy market observers, the week ending 17 July 2026 distils several important principles:
-
Inventory builds occurring against a backdrop of below-average stockpiles do not carry the same bearish weight as builds from a position of oversupply.
-
Geopolitical risk premiums can and do override fundamental inventory signals during periods of acute supply disruption risk.
-
Distillate market tightness represents the most structurally vulnerable segment of the US petroleum complex, with the 10% deficit relative to seasonal norms creating limited tolerance for demand acceleration.
-
Single-week EIA readings should always be contextualised within multi-week rolling trends to avoid overreaction to short-term noise.
-
Total products supplied declining 1% year-over-year suggests that price-induced demand moderation is already underway, a dynamic that could intensify if Brent sustains above the $90 per barrel level.
-
The API-to-EIA directional alignment on crude builds adds confidence to the signal, even when the exact magnitudes diverge.
Disclaimer: This article is for informational and educational purposes only and does not constitute financial, investment, or trading advice. Oil market conditions and geopolitical situations can change rapidly. Readers should conduct their own research and consult qualified financial professionals before making investment decisions. Forward-looking statements, price forecasts, and scenario projections referenced herein involve significant uncertainty and should not be relied upon as predictions of actual outcomes.
Want to Stay Ahead of Major Commodity Market Shifts?
Discovery Alert's proprietary Discovery IQ model delivers real-time alerts on significant ASX mineral discoveries, transforming complex commodity data into actionable insights for both short-term traders and long-term investors. Explore how historic mineral discoveries have generated substantial returns on Discovery Alert's dedicated discoveries page, and begin your 14-day free trial today to secure a market-leading advantage.