May 11, 2026
When the Buffer Runs Out: Understanding the Oil Inventory Crisis Reshaping Global Energy
Energy markets rarely fail in a single moment. They erode gradually, quietly, through years of underinvestment, structural tightening, and the slow disappearance of the cushions that once absorbed unexpected shocks. By the time the Middle East conflict of 2026 disrupted Persian Gulf tanker traffic, global oil markets were already operating with inventory buffers significantly thinner than the decade prior. What followed was not merely a price shock. It became a test of whether the modern energy system retains any meaningful capacity to absorb a prolonged physical supply disruption of this magnitude.
The oil inventory drawdown amid the Middle East supply shock is now being tracked across every major energy intelligence platform, and the numbers are alarming by any historical standard. Understanding how markets arrived at this point, what is driving the accelerating depletion, and what recovery could realistically look like requires moving beyond futures pricing and into the physical mechanics of global oil storage, shipping, and demand.
When big ASX news breaks, our subscribers know first
The Structural Fragility That Preceded the Crisis
Before a single tanker was disrupted, global oil inventories were already on a multi-year downward trajectory. In 2021, the world held the equivalent of more than 90 days of demand in storage across commercial facilities and strategic reserves. By 2022, that figure had fallen below 80 days, and the decline did not stop there. Data compiled from IEA reporting, Kpler tracking, and Goldman Sachs research showed inventories continuing to trend lower through 2023, 2024, and into 2025.
This matters for a precise reason: the natural shock-absorbing capacity of the global oil system is directly proportional to the volume held in reserve relative to daily consumption. When buffers are thick, a supply disruption triggers a price response but physical shortages remain manageable. When buffers are thin, however, even a moderate disruption can translate rapidly into acute physical scarcity.
The 2026 crisis did not arrive into a well-cushioned market. It struck during what should have been the northern hemisphere's pre-summer inventory build season, the period when refiners normally accumulate crude and refined products ahead of peak driving, agricultural, and air travel demand. That seasonal timing made the shock considerably more damaging than the same disruption would have been in the northern hemisphere's autumn or winter.
Furthermore, the current crude oil market had already been under structural pressure well before hostilities began, leaving producers and traders with limited room to manoeuvre once disruptions materialised.
As Irina Slav reported for Oilprice.com in May 2026, the crisis arrived precisely when refiners should have been building stockpiles, not drawing them down at record speed.
What Is Driving the Oil Inventory Drawdown Amid the Middle East Supply Shock?
The Hormuz Chokepoint and Its Irreplaceable Role
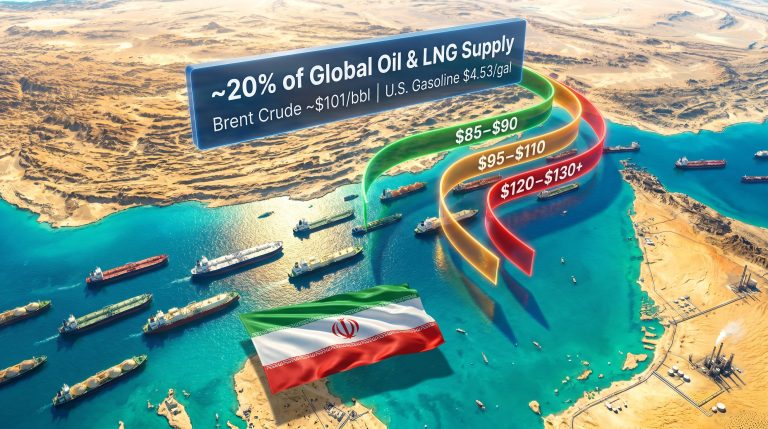
The Strait of Hormuz is not merely a significant shipping lane. It is the single most consequential oil transit corridor on the planet, carrying a disproportionate share of global seaborne crude. There is no alternative routing capable of replacing its capacity at the volumes and speeds required by modern refinery supply chains.
When Persian Gulf tanker traffic collapsed following the onset of hostilities, the effect on physical supply was near-immediate. Disruption estimates place losses at well above 10 million barrels per day at the peak of the crisis, a volume that no combination of pipeline rerouting, alternative loading ports, or accelerated production from non-Gulf producers could replicate in the short term. These oil market disruptions are unlike anything seen in the modern era of energy supply management.
The disruption architecture operated across multiple simultaneous layers:
| Disruption Layer | Mechanism | Market Impact |
|---|---|---|
| Hormuz chokepoint restrictions | Tanker traffic collapse | 10+ million bpd supply loss at peak |
| Regional infrastructure pressure | Compounding production interruptions | Additional supply uncertainty |
| Geopolitical escalation | U.S.-Iran military exchanges continuing | Sustained uncertainty premium in pricing |
Why Emergency Reserve Releases Cannot Bridge This Gap
Strategic petroleum reserves exist for exactly this kind of crisis. They are designed to provide a temporary supply bridge when physical markets are disrupted, buying governments and markets time to find alternative solutions. What they are not designed to do is permanently replace lost supply.
The core insight from energy sector executives and analysts is consistent: emergency reserve releases are a finite mechanism. They slow the pace of inventory depletion; they do not reverse it.
The coordinated emergency release from IEA member nations provided meaningful but temporary relief. Despite this intervention, global crude inventories continued declining at a pace that surpassed all previous quarterly drawdown records, according to Morgan Stanley analysis cited in energy market reporting during this period.
TotalEnergies chief executive Patrick Pouyanne stated publicly that the world had been consuming stored oil at a rate of between 10 and 13 million barrels per day since hostilities began, with cumulative losses reaching approximately 500 million barrels since the start of the conflict, as reported by Reuters. Rystad Energy placed the total supply loss figure even higher, at approximately 600 million barrels since early March 2026, according to the firm's chief economist Claudio Galimberti.
How Large Is the Total Supply Loss, and Does History Offer Any Comparison?
Quantifying an Unprecedented Barrel Deficit
The scale of cumulative supply losses puts this disruption in a category of its own. To provide context for what these numbers represent in practical terms:
- The combined TotalEnergies and Rystad estimates suggest between 500 million and 600 million barrels consumed from storage since the conflict's beginning
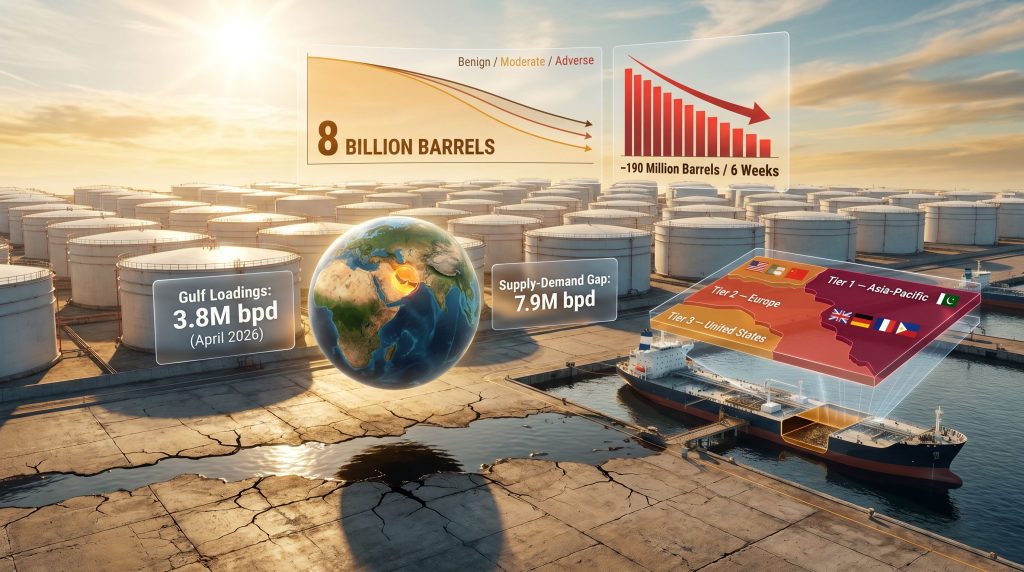
- Rystad's modelling indicates that even a late-May normalisation of tanker traffic would still result in total supply losses ranging from 1.2 billion to 2 billion barrels
- Galimberti framed this as equivalent to between 16% and 27% of pre-war global supply, a magnitude without a credible modern precedent
For reference, the 1973 OPEC embargo and the 1990 Gulf War both caused significant supply disruptions. Neither, however, combined the simultaneity of physical chokepoint closure, strategic reserve depletion from an already low baseline, and peak seasonal demand timing in the way this crisis has. In addition, OPEC's global influence over production decisions has historically provided a backstop mechanism that is notably absent from the current situation.
What the Scenario Models Are Projecting
Energy analysts modelling three possible conflict resolution timelines arrived at a striking conclusion: global oil inventories are projected to decline through 2027 in every scenario, including the most optimistic one.
| Scenario | Conflict Resolution Timeline | Projected Inventory Trajectory |
|---|---|---|
| Benign | Hostilities end by mid-June 2026 | Inventories continue declining through 2027; recovery gradual |
| Moderate | Disruption extends to end of June 2026 | Inventories approach 70 days of demand cover |
| Adverse | Prolonged disruption beyond June 2026 | Physical shortage risk intensifies across multiple regions |
The benign scenario is not a recovery scenario. It is simply a slower depletion scenario. Rebuilding inventories from a deficit of 500 to 600 million barrels requires sustained production surplus over multiple quarters, a timeline measured in years rather than months.
Pouyanne was direct on this point, stating that even a May 2026 resolution would leave global inventories at clearly very low levels by the time hostilities ended, as reported by Reuters.
Which Regions Face the Most Severe Inventory Shortfalls?
Asia-Pacific: The First Acute Shortage Window
Asia represents the most immediately exposed region, for a straightforward geographic reason: Asian refiners are the most dependent on Persian Gulf crude, with the longest supply chains and the least flexible alternative sourcing options.
Asian oil imports in April 2026 fell 30% year-on-year, reaching their lowest level in a decade, according to Kpler data cited by Reuters. The practical consequences are already materialising:
- A regional naphtha shortage is disrupting plastics production across the region, as naphtha is a critical petrochemical feedstock derived primarily from Gulf-sourced crude
- Nations including Pakistan, Indonesia, and the Philippines face the earliest projected onset of acute gasoline shortages
- Pakistan has already issued emergency LNG tenders as its energy situation deteriorated, according to separate Oilprice.com reporting from this period
- If Hormuz remains effectively closed past early June 2026, the probability of macroeconomic disruption from fuel scarcity becomes substantially elevated across South and Southeast Asia
The naphtha angle is particularly underappreciated in mainstream coverage. Because naphtha is the primary feedstock for ethylene and propylene production, a sustained shortage cascades through manufacturing supply chains well beyond the energy sector itself, affecting packaging, consumer goods, and agricultural inputs.
Europe: Secondary Pressure with Aviation Exposure
European markets are experiencing the crisis through a different product lens, with jet fuel emerging as the most acutely stressed commodity.
Key data points from the European exposure picture:
- Global jet fuel exports reached a 10-year seasonal low in April 2026, according to Oilprice.com reporting
- Airlines across Europe have begun cancelling future flights as fuel availability tightens
- Lufthansa has warned publicly that a sustained Hormuz closure would add approximately $2 billion in fuel costs to the airline's operating burden
- Germany has begun sourcing jet fuel from Israel as an emergency substitution measure, illustrating both the severity of the shortage and the unconventional lengths to which buyers are being pushed
- European jet fuel inventories were at approximately 70 million barrels at the end of April, a level being drawn down at an accelerating rate
The United Kingdom faces particular exposure given that a significant portion of its jet fuel supply is ordinarily sourced from Middle Eastern refinery output. The secondary pressure on European markets is expected to intensify approximately one month after Asian shortages become acute, based on supply chain transit timelines.
United States: A Longer Fuse, But Real Vulnerability
The United States enters the crisis with structurally more diversified supply chains and domestic production capacity that provides meaningful insulation. However, the insulation is not unlimited.
- U.S. gasoline stocks stood at 219.8 million barrels as of May 1, 2026, according to EIA data, representing approximately 4% below the five-year seasonal average and the lowest inventory level for this time of year since 2014
- Average retail gasoline prices across the U.S. exceeded $4.50 per gallon, approaching a four-year high
- U.S. crude oil reserves declined to levels not seen since 1982, even as export volumes from U.S. producers continued
- U.S. fuel exports actually hit record highs during the Hormuz crisis as global trade flows reorganised around available supply sources, according to Oilprice.com
The United States is not immune. It simply has a longer runway before reaching the acute shortage conditions already materialising in Asia. Oil price volatility across all major benchmarks reflects this extended but real exposure.
Demand Destruction as a Partial Pressure Valve
When Price Signals Start to Ration Supply
One of the least understood dynamics in an oil supply shock is how demand destruction functions simultaneously as a symptom and a corrective mechanism. When physical supply falls sharply, prices rise, and rising prices begin to price out marginal buyers. Demand falls, consequently partially closing the supply-demand gap that created the price spike in the first place.
This mechanism is already operating in the current crisis. The 30% collapse in Asian import volumes during April 2026 reflects both reduced supply availability and price-driven demand rationing. Naphtha, LPG, and jet fuel are experiencing the sharpest contractions, each heavily dependent on Gulf supply corridors.
However, demand destruction at this scale carries its own economic costs that extend well beyond the energy sector:
- Industrial output slowdowns as feedstock availability constrains manufacturing
- Airline capacity reductions and route cancellations across Asia and Europe
- Inflationary pressure on consumer goods with high transportation or petrochemical content
- Agricultural cost increases where fuel and fertiliser inputs are affected
The critical distinction that analysts are monitoring is the difference between a price shock and a physical absence of barrels. Price signals can incentivise substitution and demand reduction. A genuine physical shortage, where barrels simply do not exist to purchase at any price, requires a qualitatively different policy response.
WTI Crude was trading at approximately $95.42 and Brent at approximately $101.30 during the reporting period, with analysts flagging more extreme price outcomes as tail risk scenarios if supply corridors remain closed through the northern hemisphere summer.
The next major ASX story will hit our subscribers first
The Geopolitical Complexity Preventing a Clean Resolution
Why a Ceasefire Does Not Necessarily Mean a Supply Recovery
The geopolitical dimensions of this crisis are layered in ways that make simple resolution timelines unreliable. The broader context of oil trade and geopolitics has rarely presented as complex a picture as it does today. Multiple conflicting signals were simultaneously active as of mid-May 2026:
- U.S. and Iranian forces resumed mutual strikes despite an announced ceasefire, with each side accusing the other of violations
- More than 40 India-bound vessels remained trapped near the Strait of Hormuz, according to Oilprice.com reporting
- The arrival of the first oil tanker to reach South Korea through Hormuz since the war began was treated as a significant market event, illustrating how normalised the disruption had become
- Iraq denied U.S. government claims that Iraqi officials had facilitated Iranian oil sales, adding a further layer of diplomatic complexity to any resolution pathway
- Iran itself seized a tanker carrying its own oil in a separate incident during this period, further destabilising tanker operator confidence in the region
Each of these developments extends the timeline uncertainty. Tanker operators, insurance underwriters, and shipping companies are not going to resume normal Gulf transit operations the moment a ceasefire is announced. They will wait for sustained evidence of route safety before recommitting vessels to Persian Gulf routes, introducing additional lag between any political resolution and actual supply normalisation.
Long-Term Structural Consequences for Global Energy Security
How This Crisis Is Accelerating Policy and Investment Shifts
The oil inventory drawdown amid the Middle East supply shock is not just a near-term market event. It is, furthermore, accelerating structural changes that will reshape energy security policy, investment strategy, and trade flows for years.
Key developments already underway include:
- Australia announcing a $7 billion fuel stockpile programme in direct response to supply chain vulnerabilities exposed by the crisis, according to Oilprice.com
- Analysts recommending South Korea and India accelerate construction of new strategic petroleum reserve infrastructure given the structural risks now embedded in Middle Eastern supply
- China reversing fuel export restrictions to increase shipments to Asian markets experiencing acute shortages
- Mexico's first fuel oil cargo to Asia in nine months arriving during the crisis period, illustrating how markets are activating non-traditional supply corridors
- BP accelerating its strategic pivot back toward oil and gas investment, signalling that energy majors are repositioning for a structurally tighter supply environment
The strategic reserve architecture that exists today was largely designed around a world where Middle Eastern supply was reliably accessible with brief interruptions. A scenario in which the Hormuz corridor remains disrupted for months rather than days is revealing significant gaps in reserve depth, geographic distribution, and replenishment capacity.
As the Kpler analyst observation noted in Oilprice.com reporting, inventory support is finite and cannot sustainably offset prolonged disruptions. The policy implication is that the current emergency response framework was designed for a different risk environment.
The Rebuilding Timeline Problem
Perhaps the most underappreciated aspect of this crisis is the asymmetry between how quickly inventories can be depleted and how slowly they can be rebuilt. Drawing down 500 to 600 million barrels from global storage took approximately two months. Rebuilding that volume requires a sustained production surplus above consumption, maintained over many consecutive months.
Even in a scenario where hostilities concluded rapidly and tanker traffic normalised completely within weeks, global inventories would remain at historically depressed levels well into 2027. The pre-crisis buffer, already eroded from 2021 levels, would not be restored within any near-term timeframe that current production capacity could support.
This creates a prolonged window of elevated vulnerability, where the next supply disruption, wherever it originates, finds markets with even less cushioning than existed before this crisis began.
Frequently Asked Questions: Oil Inventory Drawdown and the Middle East Supply Shock
What is an oil inventory drawdown?
An oil inventory drawdown occurs when crude oil and petroleum products held in storage decline faster than incoming supply can replenish them. During a supply shock, drawdowns accelerate as markets consume stored barrels to compensate for lost production or import volumes.
How much oil has been removed from global inventories since the conflict began?
TotalEnergies placed cumulative consumption from storage at approximately 500 million barrels since the start of the conflict. Rystad Energy estimated closer to 600 million barrels since early March 2026, as reported by Reuters.
Which countries face the most immediate risk from the current shortage?
Asia-Pacific nations, particularly Pakistan, Indonesia, and the Philippines, face the earliest onset of acute fuel shortages, potentially beginning in June-July 2026 if Hormuz remains disrupted. European nations face a secondary risk window, with the United States facing longer-term exposure if disruptions extend further.
Can strategic petroleum reserves solve this supply crisis?
Strategic reserves provide a temporary supply bridge, not a permanent solution. Emergency releases have slowed the pace of inventory depletion but have not closed the underlying supply-demand imbalance. Rebuilding depleted reserves after the crisis resolves will require sustained production surplus over multiple quarters.
How long does rebuilding oil inventories typically take after a major supply shock?
Recovery timelines depend on disruption severity and duration. Following a multi-hundred-million-barrel deficit, restoration to pre-crisis buffer levels typically requires many months of consistent production surplus. Analysts indicate that across all modelled scenarios, global inventories will continue declining through 2027 before meaningful recovery begins.
What happens to prices if the Strait of Hormuz remains closed?
Sustained closure accelerates inventory depletion across all regions, pushing markets from a price shock toward physical barrel scarcity. WTI Crude was at approximately $95.42 and Brent at approximately $101.30 during the reporting period, with more extreme price scenarios representing tail risks under prolonged disruption.
This article is intended for informational and educational purposes only. It does not constitute financial, investment, or trading advice. Energy market conditions, pricing, and geopolitical developments are subject to rapid change. Readers should consult qualified financial and energy market professionals before making any investment decisions. Forward-looking statements and scenario projections represent analyst estimates and modelling outputs, not guaranteed outcomes.
Want to Stay Ahead of the Next Major Resource Discovery?
Energy market disruptions like the current oil inventory crisis serve as a sharp reminder of how quickly commodity supply chains can fracture — and how swiftly informed investors must act. Discovery Alert's proprietary Discovery IQ model delivers real-time notifications on significant ASX mineral discoveries, helping investors identify actionable opportunities the moment they emerge; explore historic discovery returns to see what early positioning can mean, or begin your 14-day free trial today to gain a market-leading edge.