
July 18, 2026
Strategic petroleum reserves and emergency stockpiles represent critical buffers against energy market volatility, yet their effectiveness during sustained price spikes above $119 per barrel reveals complex market dynamics that extend far beyond simple supply replacement mechanisms. When oil jumps above $119 a barrel on Middle East energy attacks, modern oil markets operate within interconnected systems where price discovery mechanisms, geopolitical risk premiums, and regional benchmark divergences create cascading effects across global energy infrastructure. Furthermore, these developments intersect with energy transition challenges facing major economies worldwide.
Understanding Price Discovery Mechanisms During Crisis Periods
Energy markets demonstrate sophisticated risk assessment patterns when crude oil benchmarks breach critical psychological thresholds. Market participants evaluate facility-specific damage reports against baseline production capacity, incorporating both immediate output losses and recovery timeline estimates into pricing models.
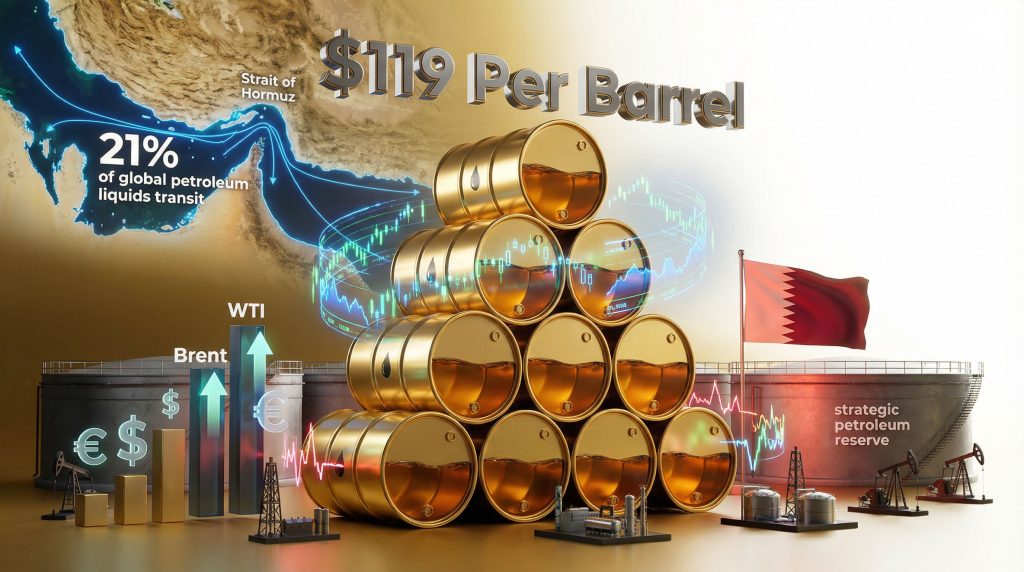
The anatomy of crisis-driven price movements reveals distinct phases. Initial market responses typically incorporate maximum potential disruption scenarios, creating temporary price overshoots that subsequently moderate as actual damage assessments become available. During March 2026, when oil jumps above $119 a barrel on Middle East energy attacks occurred, Brent crude reached an intraday peak of $119.13 before settling at $114.20, demonstrating this correction pattern.
Supply Disruption Calculation Methodologies
Professional energy traders utilise multi-layered analysis frameworks to assess production impact magnitude. These calculations differentiate between:
- Facility downtime duration estimates based on infrastructure damage reports
- Alternative supply activation timeframes from strategic reserves and spare capacity
- Transportation route disruption assessments affecting delivery logistics
- Refining capacity adjustments required for different crude quality specifications
Critical infrastructure vulnerability extends beyond individual facilities to encompass regional energy networks. The Strait of Hormuz handles approximately 21% of global petroleum liquids transit, making chokepoint analysis central to risk premium calculations. When regional facilities experience simultaneous disruption, as occurred with Qatar's Ras Laffan complex and Shell's Pearl gas-to-liquids facility, market participants must evaluate cascading supply chain effects. These disruptions often correlate with oil price rally dynamics that influence broader market sentiment.
Risk Premium Integration Patterns
Geopolitical risk premiums during Middle East conflicts typically incorporate 15-25% price buffers above fundamental supply and demand equilibrium levels. These premiums reflect uncertainty regarding:
- Conflict escalation probability and potential facility targeting expansion
- Insurance market adjustments affecting shipping and production costs
- Government intervention likelihood through strategic reserve releases or diplomatic resolution
- Alternative supplier response capacity from non-affected producing regions
The risk premium calculation process demonstrates market psychology patterns where initial panic buying transitions into sustained price elevation based on actual supply replacement timelines. Professional institutional investors distinguish between temporary disruption events and structural supply capacity changes when establishing position sizing and hedging strategies.
When big ASX news breaks, our subscribers know first
Regional Benchmark Price Divergence Analysis
Energy market structure creates distinct pricing mechanisms for different crude oil benchmarks during crisis periods. Brent crude, West Texas Intermediate, and regional Middle East benchmarks respond with varying magnitudes based on geographic proximity, quality differentials, and transportation logistics.
Crude Quality Premium Calculations
During supply disruptions, specific crude oil characteristics become increasingly valuable based on refining requirements and availability constraints. The fundamental pricing differential factors include:
API Gravity Specifications:
- Light crude (above 31.1° API) commands premium pricing during heavy crude shortages
- Medium crude (22.3°-31.1° API) provides refining flexibility advantages
- Heavy crude (below 22.3° API) requires specialised refining configurations
Sulfur Content Classifications:
- Sweet crude (less than 0.5% sulfur) enables direct petrol production
- Sour crude (above 0.5% sulfur) requires additional desulfurisation processing
- Ultra-low sulfur variants meet strict environmental specifications
The March 2026 crisis demonstrated extreme benchmark divergence patterns. While Brent crude reached $119.13, WTI traded at its widest discount to Brent in 11 years, reflecting North American supply abundance relative to global markets. Meanwhile, Dubai and Oman premiums achieved all-time highs at approximately $65 per barrel, illustrating regional scarcity pricing. These patterns connect to broader trade war oil movements that shape international energy markets.
Transportation Cost Impact Analysis
Regional crude benchmarks incorporate transportation costs and routing flexibility into pricing structures. During Middle East conflicts, alternative shipping routes become necessary, adding significant logistics expenses:
- Standard Persian Gulf routing via Strait of Hormuz (21-day transit to Asia)
- Alternative Cape of Good Hope routing (35-day transit with 40% higher shipping costs)
- Pipeline diversions through Turkey or other regional infrastructure
- Strategic reserve drawdowns reducing transportation requirements
These routing adjustments create temporary supply bottlenecks that regional benchmarks reflect through premium pricing. Professional energy traders monitor tanker charter rates, insurance coverage adjustments, and port capacity utilisation to gauge transportation constraint severity.
Futures Market Structure Changes During Volatility
Oil futures curves undergo fundamental structural shifts when prices exceed $119 per barrel during sustained conflicts. Backwardation conditions emerge when near-term contracts trade above long-term prices, signaling immediate supply constraints relative to future availability expectations.
Volatility Clustering Phenomenon
Energy markets exhibit volatility clustering patterns where large price movements increase the probability of subsequent large movements. During crisis periods, daily price swings exceeding $6 become normalised trading patterns rather than exceptional events.
Statistical analysis reveals that:
- Intraday volatility increases by 200-300% during geopolitical conflicts
- Options implied volatility reaches 40-50% annual levels compared to 20-25% normal ranges
- Term structure inversion occurs when short-dated options price higher volatility than long-dated options
Institutional vs. Retail Participation Shifts
Market microstructure analysis during crisis periods reveals changing participant behaviour patterns:
Institutional Investment Strategies:
- Systematic trading algorithms increase position sizing during volatility spikes
- Commodity trading advisers implement trend-following strategies
- Pension funds and sovereign wealth funds reduce energy sector allocations
Retail Investor Responses:
- Individual investors exhibit momentum-chasing behaviour during price spikes
- Exchange-traded fund flows concentrate in energy sector products
- Options trading volumes increase significantly in short-term contracts
Central Bank Policy Response Frameworks
Monetary authorities face complex decision-making environments when energy prices reach extreme levels. The Federal Reserve's March 2026 decision to maintain interest rates whilst projecting higher inflation demonstrates the challenging balance between economic growth support and price stability objectives.
Inflation Targeting Complications
Central banks utilise core inflation measures that exclude energy prices to avoid monetary policy overreaction to temporary supply shocks. However, sustained energy price elevation creates second-round inflation effects through:
- Transportation cost increases affecting goods and services pricing
- Electricity generation expenses impacting utility rate adjustments
- Industrial input costs requiring manufacturing price adjustments
- Consumer expectation changes influencing wage negotiation dynamics
Policy makers must distinguish between temporary price level adjustments and persistent inflation trend changes when calibrating monetary responses. Historical analysis suggests that energy shocks require 6-12 months to fully impact broader price indices. These patterns often coincide with trends in US oil production decline that influence long-term market fundamentals.
Currency Market Transmission Effects
Oil price volatility creates significant currency market adjustments through petrodollar recycling mechanisms. Countries with substantial energy trade balances experience exchange rate pressures that amplify domestic economic impacts:
Energy Exporting Nations:
- Currency appreciation pressures from increased export revenues
- Fiscal budget improvements enabling increased government spending
- Current account surplus expansion affecting monetary policy options
Energy Importing Nations:
- Currency depreciation pressures from higher import costs
- Trade balance deterioration requiring policy adjustments
- Inflation imported through exchange rate pass-through effects
Strategic Reserve Utilisation Strategies
Strategic Petroleum Reserve systems globally contain approximately 1.5 billion barrels, representing roughly 15 days of global oil consumption. However, release effectiveness depends on coordination timing, volume specifications, and market communication strategies.
Release Volume Optimisation
Reserve utilisation requires careful calibration to maximise price stabilisation effects without depleting emergency capacity. Optimal release strategies consider:
| Release Volume | Market Impact | Strategic Considerations |
|---|---|---|
| 1-5 million barrels | Minimal price effect | Signal government monitoring |
| 10-30 million barrels | Moderate stabilisation | Address temporary disruptions |
| 50-100 million barrels | Significant price reduction | Counter major supply loss |
| 100+ million barrels | Market price reset | Extended conflict scenarios |
The United States Strategic Petroleum Reserve capacity of 400+ million barrels provides substantial intervention capability, though release rates are limited by infrastructure constraints to approximately 4 million barrels per day maximum.
International Coordination Mechanisms
International Energy Agency protocols enable coordinated response among member countries during supply emergencies. Synchronised releases amplify individual country impacts through:
- Volume aggregation effects creating larger market supply additions
- Geographic distribution addressing regional supply imbalances
- Duration coordination sustaining market confidence over extended periods
- Communication alignment preventing conflicting policy signals
Effective coordination requires advance planning and real-time information sharing among participating countries to optimise timing and volume decisions. These efforts often intersect with discussions about OPEC production impact on global supply balances.
Alternative Supply Activation Analysis
Global oil production capacity includes approximately 2-3 million barrels per day of spare capacity, primarily concentrated in Saudi Arabia and other Gulf Cooperation Council countries. Spare capacity activation requires 30-90 days depending on field characteristics and infrastructure readiness.
Unconventional Production Response Patterns
United States shale oil production demonstrates rapid response capabilities to sustained high prices, though economic breakeven levels vary significantly by formation:
Permian Basin Operations:
- Breakeven costs: $40-60 per barrel
- Drilling to production timeline: 2-3 months
- Peak production decline rates: 60-80% in first year
Bakken Formation Characteristics:
- Breakeven costs: $50-70 per barrel
- Infrastructure constraints limit rapid expansion
- Transportation capacity requires pipeline or rail access
Eagle Ford Development:
- Breakeven costs: $45-65 per barrel
- Condensate production provides refining advantages
- Processing facility capacity affects production economics
Shale production economics create natural price ceiling effects, as sustained prices above $80-100 per barrel stimulate rapid drilling activity increases within 6-12 months.
The next major ASX story will hit our subscribers first
Portfolio Risk Management During Energy Volatility
Professional investment managers employ sophisticated hedging strategies during periods when oil jumps above $119 a barrel on Middle East energy attacks scenarios. These strategies balance portfolio protection against implementation costs and opportunity limitations.
Multi-Asset Correlation Adjustments
Energy price volatility creates changing correlation patterns across asset classes that require dynamic portfolio rebalancing:
Equity Sector Rotations:
- Energy companies benefit from higher commodity prices
- Transportation sectors face margin compression from fuel costs
- Utilities experience input cost pressures affecting profitability
- Consumer discretionary spending shifts toward energy expenses
Fixed Income Implications:
- Inflation expectations increase bond market volatility
- Credit spreads widen for energy-intensive industries
- Treasury yields reflect Federal Reserve policy uncertainty
- Emerging market bonds face currency and fiscal pressures
Currency Exposure Management
International portfolios require currency hedging adjustments during energy crises due to exchange rate volatility increases:
- Dollar strength from flight-to-safety flows during geopolitical uncertainty
- Commodity currency appreciation in energy-exporting countries like Canada and Norway
- Emerging market pressure from higher import costs and capital outflows
- European currency volatility from natural gas price correlation with oil markets
Institutional investors typically increase hedging ratios from 50-70% normal levels to 80-90% during extended energy crises.
Long-Term Structural Market Evolution
Sustained energy price volatility accelerates structural changes in global energy systems, investment flows, and technological development priorities. These changes create permanent shifts in market dynamics beyond temporary crisis responses.
Infrastructure Investment Redirection
High oil prices stimulate massive capital allocation toward alternative energy infrastructure:
Renewable Energy Development:
- Solar photovoltaic project economics improve significantly above $100 oil
- Wind energy capacity additions accelerate due to relative cost advantages
- Energy storage systems become economically viable for grid-scale deployment
- Electric vehicle adoption rates increase due to petrol cost pressures
Traditional Energy Security:
- Pipeline capacity expansion reduces transportation chokepoint risks
- Strategic reserve capacity increases across consuming nations
- Refining capacity diversification away from high-risk regions
- Enhanced facility security measures increase operational costs
Geopolitical Risk Pricing Evolution
Sustained energy volatility permanently alters risk assessment frameworks for energy infrastructure investments. Insurance markets, project financing, and operational planning incorporate higher baseline risk assumptions:
- Political risk insurance costs increase 50-100% for Middle East projects
- Project financing requires enhanced security guarantees and force majeure provisions
- Supply contract terms include broader force majeure definitions and price adjustment mechanisms
- Emergency response planning becomes mandatory for critical infrastructure operations
What Drives Market Psychology During Energy Crises?
Energy market participants demonstrate predictable behavioural patterns during extreme volatility periods that create systematic trading opportunities for sophisticated investors whilst challenging traditional risk management approaches.
Momentum and Mean Reversion Dynamics
Psychological anchoring effects cause market participants to establish new price expectation ranges during sustained volatility. When oil consistently trades above $100 per barrel, $119 becomes perceived as a reasonable price level rather than an extreme deviation.
Short-term momentum patterns:
- Initial price moves attract trend-following algorithmic trading
- News-driven volatility creates intraday trading opportunities
- Options market makers adjust pricing models for higher volatility persistence
Medium-term mean reversion expectations:
- Fundamental analysts forecast eventual price normalisation
- Strategic reserve releases and spare capacity activation plans
- Demand destruction effects at sustained high price levels
Professional energy traders balance these competing dynamics through multi-timeframe position management and sophisticated options strategies that profit from volatility whilst limiting directional exposure.
How Do Geopolitical Events Shape Long-Term Energy Markets?
The intersection of geopolitical risk, market structure changes, and behavioural finance during extreme energy price volatility creates complex investment environments requiring enhanced analytical frameworks. Consequently, understanding these dynamics enables more effective navigation of future energy market disruptions whilst identifying structural opportunities in the evolving global energy system.
Moreover, when oil jumps above $119 a barrel on Middle East energy attacks, the ripple effects extend far beyond immediate price movements. Asian stock markets experienced significant volatility as investors processed the implications of sustained energy price elevation on economic growth prospects and corporate profitability across sectors.
Investment decisions during periods of energy market volatility involve substantial risks including the potential for significant losses. Market conditions can change rapidly, and past performance does not guarantee future results. Investors should consult with qualified financial advisers before making investment decisions based on energy market analysis or geopolitical event predictions.
Looking to Navigate Energy Market Volatility?
Discovery Alert's proprietary Discovery IQ model delivers real-time alerts on significant ASX mineral discoveries, helping investors identify actionable opportunities during periods of heightened market volatility and geopolitical uncertainty. Begin your 14-day free trial today to gain critical market intelligence and position yourself ahead of energy sector developments.