August 23, 2026
When Energy Markets Meet Geopolitical Shock: Understanding Oil's Most Volatile Trading Sessions
Energy markets operate on a fundamental tension between physical supply fundamentals and the fear premium embedded by geopolitical uncertainty. Most of the time, these two forces move independently. But when they converge simultaneously, as they did in one extraordinary trading session that sent oil prices surging sharply higher, the result is a price dislocation that forces every market participant to rapidly reassess their exposure.
The phrase oil jumps on escalating Middle East airstrikes has appeared in headlines before. What distinguishes this particular episode is not just the scale of the price move, but the structural layering of risk factors that arrived at precisely the same moment, each amplifying the other. Understanding oil geopolitics and supply dynamics is, furthermore, essential context for interpreting why these sessions unfold with such velocity.
When big ASX news breaks, our subscribers know first
Four Converging Forces Behind the 7% Oil Price Surge
Crude oil prices rarely move 7% in a single session without a compelling confluence of factors. On this occasion, at least four distinct drivers arrived simultaneously, creating a compounding effect that overwhelmed bearish positioning and caught consensus forecasts off guard.
Military Escalation Targeting Energy Infrastructure
The most visible trigger was coordinated military action in the Middle East. U.S. and Saudi forces launched strikes against Iran-backed groups operating in Iraq, directly responding to drone attacks that had already threatened upstream Saudi oil production capacity.
Within the same period, drone strikes hit a natural gas loading port on Egypt's Mediterranean coastline, with a U.S.-owned floating storage tanker confirmed as struck in the same incident. The geographic broadening of the conflict's energy footprint matters enormously to markets: it signals that no regional energy node can be assumed immune from disruption, and it forces traders to price risk into assets they previously considered peripheral to the conflict. Recent BBC reporting has further confirmed the severity of these developments.
A U.S. Inventory Drawdown That Shattered Consensus Expectations
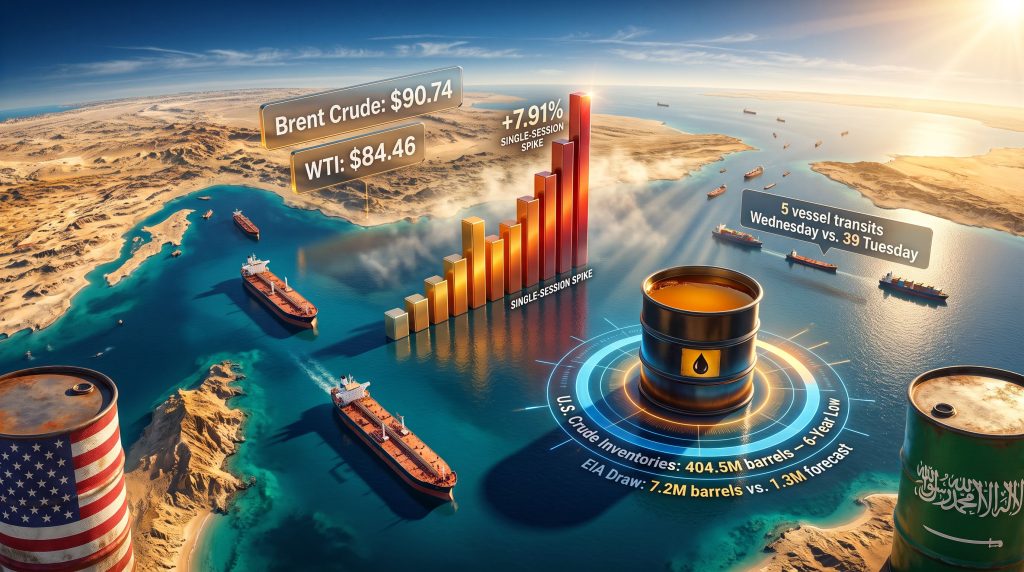
Simultaneously, the U.S. Energy Information Administration released inventory data that delivered one of the larger fundamental surprises in recent memory. Analysts had modelled a drawdown of approximately 1.3 million barrels. The actual figure came in at 7.2 million barrels, a miss of more than five times the consensus estimate.
U.S. crude stockpiles fell to 404.5 million barrels, their lowest recorded level since 2018. This is not merely a statistical footnote. Inventory levels at six-year lows materially reduce the government's capacity to deploy strategic petroleum reserve (SPR) releases as a price-dampening tool. The buffer that previously existed between supply disruption and consumer price impact has, consequently, been meaningfully eroded.
| Metric | Analyst Forecast | Actual Outcome | Deviation |
|---|---|---|---|
| Weekly crude draw | 1.3 million barrels | 7.2 million barrels | +454% above forecast |
| Closing inventory level | N/A | 404.5 million barrels | 6-year low |
| Last comparable inventory level | 2018 | 2024 | 6-year gap |
OPEC+ Supply Discipline Reinforcing the Price Floor
Adding structural support beneath the geopolitical fear premium, OPEC+ signalled its intention to pause planned production increases for approximately three months beginning in October. This decision coincides directly with the reinstatement of barrels previously withheld under voluntary cut agreements, meaning the group effectively chose to delay restoring those volumes to market at precisely the moment when geopolitical supply risk is most acute.
The timing is significant. OPEC's global market influence in shaping these pauses removes the natural market mechanism that would ordinarily cushion a supply shock, extending the window during which geopolitical risk can translate into sustained price elevation rather than a brief spike. Furthermore, OPEC demand forecasts have already signalled tightening conditions that compound this structural risk.
Houthi Maritime Disruption Accelerating Across Multiple Chokepoints
The fourth layer of pressure came from Houthi maritime activity in the southern Red Sea. Transit volumes through the Bab el-Mandeb Strait collapsed sharply, with only five commodity vessel transits recorded on Wednesday compared to 39 on the prior Tuesday, which had itself been the highest single-day count since mid-July.
Houthi forces have indicated they are considering imposing transit fees on commercial shipping in the southern Red Sea. Separately, China engaged in direct diplomatic negotiations with Houthi leadership to protect its tanker traffic from interdiction, a detail that reveals the extent to which this maritime disruption has escalated from regional nuisance to active great-power diplomatic problem.
Brent and WTI: Parsing the Price Movement in Detail
The session's price action was pronounced across both major crude benchmarks.
| Benchmark | Settlement Price | Single-Session USD Gain | Percentage Increase |
|---|---|---|---|
| Brent Crude Futures | $90.74 per barrel | +$6.65 | +7.91% |
| WTI Crude (U.S.) | $84.46 per barrel | +$5.20 | +6.56% |
| Brent (Early European Trading) | ~$88.23 per barrel | N/A | +4.9% |
| WTI (Early European Trading) | ~$82.95 per barrel | N/A | +4.7% |
The spread between Brent and WTI widened slightly during the session, reflecting differentiated risk pricing: Brent, as the internationally traded benchmark more directly exposed to Middle Eastern supply routes, attracted a larger geopolitical premium than WTI, which is more anchored to domestic U.S. fundamentals.
Analysts at DBS Bank projected that Brent crude would continue trading within a volatile band of $80 to $100 per barrel in the near term, with the conflict's trajectory acting as the primary swing variable determining where within that range prices settle on any given day.
The Strait of Hormuz: Why This Narrow Waterway Commands Global Energy Pricing Power
To understand why oil jumps on escalating Middle East airstrikes with such velocity, it is essential to understand the physical geography of global oil trade. The Strait of Hormuz, the narrow passage separating Iran from Oman at the mouth of the Persian Gulf, serves as the primary transit corridor for an estimated 20 to 21 million barrels of seaborne oil per day, representing approximately one-fifth of globally traded crude.
No alternative maritime route can absorb that volume efficiently. The Suez Canal and Bab el-Mandeb Strait together handle meaningful secondary flows, but they cannot substitute for Hormuz at scale.
Several developments in this episode directly elevated Hormuz risk:
- Iran publicly rejected an Omani proposal for joint regional management of the strait, a framework that could have reduced the risk of unilateral action
- Iran reportedly fired on vessels transiting the Strait, creating documented incidents of transit disruption
- The U.S. Treasury Department designated 10 entities and 8 tankers linked to Iran's efforts to exert financial and operational control over strait access
- The commercial shipping intelligence community began tracking a measurable decline in vessel transits through the corridor
What is less widely understood is that Hormuz is not just a physical bottleneck. It functions as a geopolitical instrument, and Iran's capacity to threaten closure often generates nearly as much market disruption as an actual closure would. The credibility of the threat is sufficient to embed a risk premium without requiring physical interdiction of tanker traffic.
The Secondary Chokepoint: Bab el-Mandeb and Its Limits
While the Strait of Hormuz represents the primary systemic risk, the Bab el-Mandeb Strait serves as a critical secondary concern. Located between Yemen and Djibouti at the southern entrance to the Red Sea, it functions as the principal alternative routing for Saudi crude exports destined for Asian markets.
Energy specialists have noted that Houthi operational effectiveness in restricting Bab el-Mandeb flows, while growing, remains considerably less decisive than a genuine Hormuz closure would be. The strait's wider geography offers more navigational options, and countermeasures deployed by naval escort operations have partially maintained transit flows.
However, the data on vessel transits tells a deteriorating story. The sharp drop from 39 transits on Tuesday to just 5 on Wednesday represents an 87% single-day collapse in shipping activity, and that kind of volatility in logistics throughput directly affects spot tanker freight rates, insurance premiums, and ultimately the landed cost of crude at Asian refineries. Reuters reporting on Israel-Iran strikes provides additional context on how rapidly these disruptions can escalate.
Scenario Modelling: How High Could Oil Go?
Investors and risk managers are currently navigating at least three credible scenarios, each with materially different price implications. The trade war impact on oil adds a further layer of complexity to this already volatile environment.
Scenario A: Contained Escalation (Base Case)
Military activity remains geographically concentrated in Iraq and Yemeni maritime zones. The Strait of Hormuz stays operationally open with intermittent political pressure. Brent consolidates in a $85 to $95 per barrel range, supported by the OPEC+ pause and sustained U.S. inventory depletion.
Scenario B: Partial Hormuz Disruption (Elevated Risk)
Iran moves to operationally restrict Hormuz transit following expanded U.S. sanctions. Brent breaks above $100 per barrel within days of a confirmed disruption event. Asian importers face acute competition for spot cargoes. SPR releases from the U.S. and IEA member states become probable, though their capacity to fully offset the supply gap is limited given current inventory levels.
Scenario C: Full Regional Escalation (Tail Risk)
Direct military confrontation between U.S. forces and Iranian military assets triggers simultaneous disruption across Hormuz, Bab el-Mandeb, and Suez Canal approach routes. Brent price discovery enters territory above $110 to $120 per barrel. Global energy inflation feeds rapidly into consumer price indices, raising recession risk across import-dependent economies.
The next major ASX story will hit our subscribers first
The Asian Exposure Problem: Who Has the Most to Lose?
A dimension of this crisis that receives insufficient analytical attention is the structural vulnerability of Asian energy importers. China, India, Japan, and South Korea collectively represent the largest pool of Persian Gulf crude demand. All four depend on Hormuz transit for the majority of their hydrocarbon imports.
China's diplomatic engagement with Houthi forces, pursued through back-channel negotiations involving at least six informed sources familiar with the discussions, reflects Beijing's recognition that its energy security is directly entangled with Red Sea maritime stability. This is a strategically unusual position for China, which typically avoids direct engagement with non-state armed groups.
India faces a comparable vulnerability, having significantly increased its reliance on Middle Eastern crude as Russian oil procurement became more logistically complex following Western sanctions. A Hormuz disruption would force Indian refiners into spot market competition with Chinese buyers for Atlantic Basin and West African alternatives, driving up both the commodity cost and the freight cost simultaneously.
What the Inventory Miss Tells Us About Structural Supply Tightness
The 7.2-million-barrel inventory drawdown deserves deeper analysis than the headline figure suggests. Strong U.S. energy exports and firm domestic consumption were identified as the primary drivers of the depletion, meaning the drain is not a temporary anomaly but a reflection of ongoing structural tightness in the domestic supply-demand balance.
When markets receive a geopolitical shock and a fundamental supply signal in the same session, the compounding effect on price is historically disproportionate. Each signal individually might produce a 2–3% price move; arriving together, they interact to produce something closer to a 7–8% dislocation. The crude oil volatility trends of recent years reinforce precisely this pattern of compounding price behaviour.
The 2018 inventory level comparison is particularly instructive. In 2018, the oil market was operating in a very different structural environment, with U.S. shale production accelerating rapidly toward its pre-pandemic peak. The fact that today's inventory levels match that period, against a backdrop of more muted production growth expectations and active geopolitical disruption, suggests the downside buffer in U.S. domestic supply is more constrained than it appears in isolation.
Frequently Asked Questions: Oil Price Volatility and Middle East Risk
Why does oil jump so sharply on Middle East airstrikes?
Crude oil markets price supply risk in real time. When military escalation threatens the physical infrastructure or transit routes through which global oil flows, traders immediately discount the probability of future supply availability. The faster and more credible the threat, the sharper the price adjustment.
What makes the Strait of Hormuz uniquely important?
Unlike other maritime chokepoints, Hormuz has no viable high-capacity alternative. Roughly one-fifth of globally traded oil passes through this single corridor daily. Any meaningful disruption to that flow cannot be rerouted efficiently, making it the single highest-impact geographic risk point in global energy logistics.
How does OPEC+ behaviour interact with geopolitical risk?
OPEC+ production discipline reduces the spare capacity buffer available to offset supply disruptions. When the group pauses planned output increases at precisely the moment geopolitical risk is elevated, it removes one of the natural market mechanisms that would otherwise moderate price spikes.
Is a $100 per barrel Brent price realistic?
Under the base case scenario of contained escalation, it remains a tail outcome. However, any confirmed operational disruption to Hormuz transit would rapidly make that threshold not just realistic but potentially conservative. Analyst projections currently span a range from $80 to well above $100 depending on how the conflict evolves.
Disclaimer: This article contains forward-looking price projections and scenario analyses based on publicly available analyst commentary and market data. These projections involve inherent uncertainty and should not be interpreted as investment advice. Commodity prices are subject to rapid change based on geopolitical developments, supply-demand fundamentals, and policy decisions beyond the scope of any predictive model.
Key Market Indicators at a Glance
| Indicator | Current Reading | Market Signal |
|---|---|---|
| Brent Crude (session peak) | $90.74 per barrel | Elevated geopolitical risk premium |
| WTI Crude (session peak) | $84.46 per barrel | Domestic supply tightness confirmed |
| U.S. Crude Inventories | 404.5 million barrels | 6-year low, reduced shock buffer |
| Weekly inventory draw | 7.2 million barrels | 454% above analyst consensus |
| Bab el-Mandeb daily transits | 5 vessels (Wednesday) vs 39 (Tuesday) | Rapid shipping disruption acceleration |
| Strait of Hormuz status | Operationally open, politically threatened | Primary near-term watch variable |
| OPEC+ output posture | 3-month pause expected from October | Supply floor structurally reinforced |
| Analyst near-term Brent range | $80 to $100+ per barrel | High volatility environment confirmed |
For readers seeking ongoing coverage of how Middle Eastern geopolitics intersects with global energy pricing, GCC oil policy, and regional infrastructure developments, Zawya Energy provides continuous reporting across these interconnected themes.
Want to Stay Ahead of the Next Major Resource Discovery Driven by Shifting Energy Markets?
When geopolitical shocks reshape commodity markets at this speed, being positioned early is everything — Discovery Alert's proprietary Discovery IQ model scans ASX announcements in real time, delivering instant alerts on significant mineral discoveries across more than 30 commodities so subscribers can act before the broader market catches on. Start your 14-day free trial at Discovery Alert today, or explore how historic discoveries have generated extraordinary returns for those who moved first.