June 6, 2026
The Hidden Architecture of Oil Market Fragility
Every seasoned energy investor understands, at least intellectually, that global oil markets rest on a surprisingly narrow physical foundation. Decades of infrastructure investment, diplomatic frameworks, and international shipping conventions have created a system that appears robust but concentrates an extraordinary share of global supply through a handful of narrow maritime passages. When those passages come under credible threat, the pricing consequences are instantaneous and severe.
That fragility was on full display on 1 June 2026, when crude futures markets absorbed a cascade of geopolitical signals and responded with one of the most dramatic single-session price surges seen in recent years. Understanding why oil jumps on Strait of Hormuz blockade risk requires more than reading headlines. It requires examining the structural mechanics underneath the market reaction. Furthermore, examining crude oil price trends across recent years reveals just how quickly geopolitical events can override demand fundamentals.
When big ASX news breaks, our subscribers know first
What Makes the Strait of Hormuz Irreplaceable in Global Energy Supply?
The Strait of Hormuz occupies a unique position in the architecture of global energy trade. Stretching approximately 33 kilometres at its narrowest navigable point, it connects the Persian Gulf to the Gulf of Oman and serves as the sole viable maritime exit for crude oil exports from Saudi Arabia, Iraq, Kuwait, the UAE, and other Gulf producers.
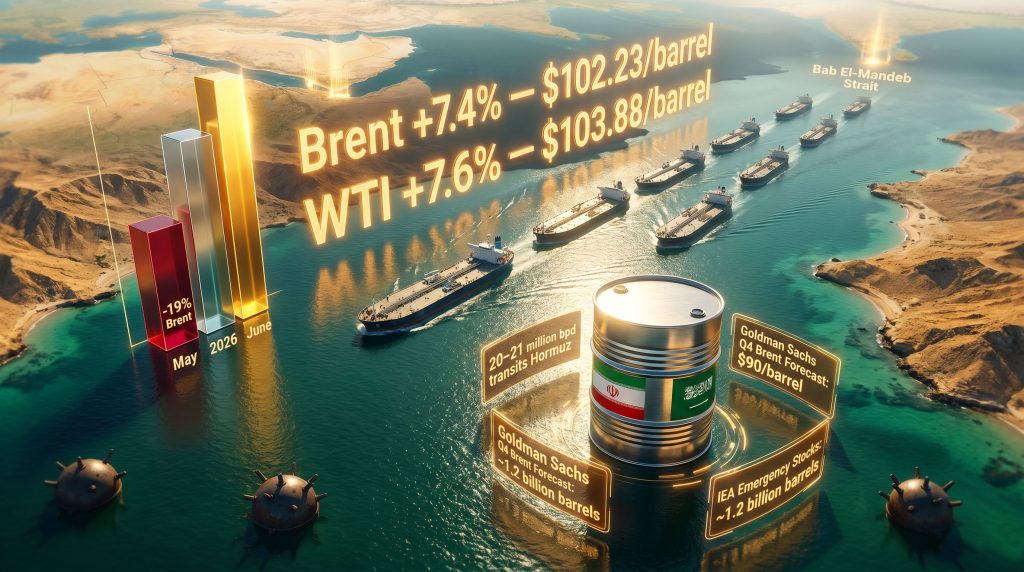
Under normal operating conditions, roughly 20 to 21 million barrels per day of petroleum liquids transit this corridor. That figure represents approximately 20% of global petroleum consumption, flowing through a channel narrower than many metropolitan motorway systems.
Crucially, there is no adequate substitute. While partial bypass infrastructure exists:
- Saudi Arabia's East-West Pipeline (Petroline) can carry approximately 5 million bpd to Red Sea terminals
- The UAE's Abu Dhabi Crude Oil Pipeline (ADCOP) offers roughly 1.5 million bpd of bypass capacity to Fujairah on the Gulf of Oman
- Combined, these alternatives cover only a small fraction of total Gulf export volumes
The arithmetic is unforgiving. Even with full utilisation of every bypass route available, the overwhelming majority of Gulf crude has no pathway to global markets that does not pass through Hormuz. That structural dependency is precisely why oil jumps on Strait of Hormuz blockade risk with such predictable force.
How Oil Futures Markets Price Geopolitical Threats
A common misconception is that commodity markets only react to confirmed supply disruptions. In reality, crude futures are probability-weighted forward-pricing mechanisms. They do not wait for tankers to stop moving. They price in the expectation of potential outcomes, weighted by perceived likelihood.
This is why even a 10 to 15% assessed probability of meaningful supply disruption can add $5 to $10 per barrel in geopolitical risk premium to Brent and WTI contracts within hours. When credibility thresholds are crossed, algorithmic trading systems and discretionary portfolio managers adjust positions simultaneously, amplifying the initial price signal.
Historical precedent reinforces this dynamic. During the 1980s Tanker War in the Persian Gulf, marine insurance premiums on Gulf-bound vessels surged by over 300% before a single major tanker was destroyed. Markets priced in the risk environment, not just the confirmed damage tally. Consequently, the trade war impact on oil in recent years follows a similar pattern, where anticipated disruption moves markets well before any physical supply change occurs.
The Strait of Hormuz functions as a geopolitical pressure valve embedded within the global supply chain. When diplomatic channels deteriorate, energy markets absorb the uncertainty before any other asset class registers the shift.
The June 2026 Price Surge: What the Numbers Actually Showed
The scale of the June 1, 2026 crude price move was striking, particularly against the backdrop of the preceding month's steep losses. The table below captures the key price levels reported across different timestamps during the trading session.
| Benchmark | Reported Price | Single-Session Gain | Percentage Move |
|---|---|---|---|
| Brent Crude (10:02 a.m. ET) | $97.14/barrel | +$6.02 | +6.6% |
| WTI Crude (10:02 a.m. ET) | $94.04/barrel | +$6.68 | +7.7% |
| WTI Crude (07:36 a.m. Saudi time) | $89.65/barrel | +$2.29 | +2.62% |
The divergence between the early morning figure and the later session readings is itself analytically significant. It shows that the price surge was not a single instantaneous event but an accelerating move as new information layers entered the market throughout the morning. Traders were not reacting to one headline. They were processing a compounding sequence of diplomatic, military, and logistical signals in real time.
The magnitude of the reversal becomes even more meaningful when placed against recent history. Both Brent and WTI had shed approximately 19% and 17% respectively across May 2026, marking their steepest monthly declines in absolute terms since March 2020, when the COVID-19 pandemic produced a historic collapse in global energy demand.
A single session in June partially erased weeks of bearish momentum, driven entirely by geopolitical supply-side risk rather than any change in demand fundamentals. For broader context on how geopolitical factors reshape markets, this oil geopolitics analysis offers a detailed examination of the forces at play.
For additional context, the March 2022 Brent spike following the Russian invasion of Ukraine saw the benchmark breach $139 per barrel at its intraday peak before retreating. The June 2026 surge, while smaller in absolute terms, occurred in a very different macro environment: global equities were trading near record highs, propelled by artificial intelligence sector momentum. Oil's move was entirely geopolitically isolated, which made the signal cleaner and more instructive from an analytical standpoint.
The Diplomatic Collapse That Triggered the Move
Iran Suspends Message Exchanges With Washington
The immediate catalyst for the June 1 price surge was a report from Iran's Tasnim news agency confirming that Tehran's negotiating team had suspended the exchange of diplomatic messages with the United States. The breakdown occurred against a backdrop of fragile indirect diplomacy that had been progressing through intermediaries.
Iran's Foreign Ministry spokesperson Esmaeil Baghaei attributed the stall to three compounding factors:
- A fundamental deficit of trust between the two parties
- Washington's adoption of contradictory negotiating positions
- Israeli military escalation in Lebanon, which Tehran viewed as incompatible with genuine ceasefire diplomacy
The timing was particularly damaging for market sentiment. Just days earlier, Washington had hosted Israel-Lebanon peace talks. When Israeli ground forces subsequently advanced further into Lebanese territory, it sent an unambiguous signal that ceasefire momentum had reversed rather than accelerated.
President Trump had indicated on Friday, 30 May, that a decision on extending a ceasefire announced in early April was imminent. Iran had consistently maintained that any agreement must include Hezbollah and Lebanon as parties. Israel had not accepted that condition. The logical gap between those positions became immediately apparent to energy traders on Monday morning.
The Resistance Front's Dual-Chokepoint Threat
The Tasnim report contained an element that significantly amplified the market reaction beyond what a standard diplomatic breakdown would typically generate. It indicated that Iran's allied Resistance Front was actively considering measures to completely block the Strait of Hormuz and simultaneously restrict passage through the Bab El-Mandeb Strait.
According to NBC News reporting on the renewed tensions, an Axios report published on X (formerly Twitter) on the preceding Friday alleged that Iran had deployed additional naval mines within the Strait of Hormuz during the previous week. Naval mine deployment represents a qualitatively different category of threat from rhetorical posturing. Mines create physical, persistent hazards that cannot be resolved through diplomatic announcements alone. Even if a ceasefire were subsequently agreed, mine-clearance operations would take days to weeks, meaning the supply disruption risk would outlast the political resolution.
As Tony Sycamore, analyst at IG Markets, noted in a published commentary, concerns about mines in the Strait of Hormuz were mounting, and even a successful diplomatic agreement would not immediately translate into restored supply flows. That analytical framing captured precisely why oil jumps on Strait of Hormuz blockade risk even when the probability of full closure remains below 50%.
Why the Bab El-Mandeb Dimension Changed the Risk Calculus
The World's Fourth-Largest Energy Chokepoint
The Bab El-Mandeb Strait connects the Red Sea to the Gulf of Aden and serves as the primary maritime corridor for oil and LNG shipments heading toward Europe via the Suez Canal. Approximately 6 to 7 million barrels per day transit this route under normal conditions, making it the world's fourth-busiest energy chokepoint.
The 2024–2025 Houthi campaign against commercial shipping in the Red Sea had already demonstrated, in operational terms, what even partial disruption to this corridor costs. Major carriers rerouted vessels around the Cape of Good Hope, adding approximately 10 to 15 days of transit time per voyage and materially increasing shipping costs, insurance premiums, and refined product prices in European markets.
The Dual-Chokepoint Scenario: Numbers That Explain the Fear
A simultaneous blockade of both Hormuz and Bab El-Mandeb would theoretically place more than 25 million barrels per day of seaborne crude in jeopardy. That figure represents a supply disruption scenario without modern precedent. Consider the scale:
- The 1973 Arab oil embargo reduced global supply by roughly 4 to 5 million bpd
- The loss of Libyan output in 2011 removed approximately 1.6 million bpd
- Russian oil supply uncertainty following the 2022 Ukraine conflict threatened disruption of roughly 5 to 7 million bpd
A dual-chokepoint blockade would dwarf all of these episodes. While analysts universally treat full closure as a low-probability scenario, the pricing of that tail risk in futures markets does not need to reflect majority probability. A 15 to 20% chance of a catastrophic, multi-week disruption is sufficient to generate the kind of $6-plus single-session move seen on 1 June.
The primary buffer against such a scenario is the Strategic Petroleum Reserve system. IEA member nations collectively hold approximately 1.2 billion barrels in combined emergency stocks, equivalent to over 90 days of net imports under normal conditions. However, SPR releases address price, not physical logistics. Tanker routing disruptions and mined waterways create operational bottlenecks that stored barrels cannot immediately resolve.
Supply Fundamentals: The Demand-Side Counterweight
Goldman Sachs Forecasts and the Two-Sided Risk Equation
Goldman Sachs published an updated outlook the day before the June 1 surge that neatly captured the binary nature of the current oil market environment. The bank's baseline Q4 2026 forecasts were:
| Benchmark | Goldman Sachs Q4 2026 Forecast |
|---|---|
| Brent Crude | $90/barrel |
| WTI Crude | $83/barrel |
The bank explicitly framed weak demand from China and Europe as the primary downside risk to those forecasts, while Middle East supply disruptions constituted the primary upside risk. The June 1 session illustrated exactly how quickly the upside scenario can overwhelm the base case when geopolitical triggers materialise.
China's Factory Activity and the Demand Contradiction
Weekend economic data released from China showed contracting or stalling factory activity heading into June. China's manufacturing PMI is a reliable leading indicator for Asian crude demand. Sustained contraction typically signals reduced refinery throughput, lower import volumes, and softer global benchmark pricing.
This demand-side weakness had been a primary driver of May 2026's steep price decline. The fact that the June 1 geopolitical catalyst completely overwhelmed the China data within the same trading session illustrates a fundamental principle of oil market psychology: acute supply-side geopolitical shocks dominate demand fundamentals in the short term, almost without exception. In addition, the US-China trade war oil prices dynamic has further complicated the demand outlook for Asian crude consumption.
Kazakhstan and Russia: Incremental Supply Variables
Two additional supply-side developments added texture to the June 1 picture without materially altering the dominant geopolitical narrative.
Kazakhstan's Energy Minister Erlan Akkenzhenov confirmed the restoration of output at the Tengiz oilfield to 290,000 tonnes per day following earlier production disruptions. Tengiz, operated by a Chevron-led consortium, is one of the world's largest single producing fields, with nameplate capacity exceeding 600,000 barrels per day.
Separately, Russian authorities were reportedly weighing a two-month ban on gasoline exports, including under certain intergovernmental supply agreements, to protect domestic fuel availability. Belarus fuel supplies were being coordinated to compensate. While unconnected to the Hormuz situation directly, these Russian supply management decisions added a further layer of complexity to global refined product markets at an already sensitive moment.
The next major ASX story will hit our subscribers first
How Geopolitical Risk Gets Embedded in Crude Pricing: A Step-by-Step Framework
Understanding the mechanics of how supply disruption risk moves from geopolitical event to futures pricing helps investors anticipate and interpret these episodes more accurately. Furthermore, OPEC's market influence operates alongside these geopolitical dynamics, often amplifying or tempering the ultimate price outcome.
Step 1 – Threat Credibility Assessment: Traders evaluate the source, specificity, and geopolitical context. A named news agency report citing an official government body carries substantially more weight than anonymous social media speculation.
Step 2 – Affected Volume Estimation: Analysts rapidly calculate what proportion of global supply is at risk. In this case, Hormuz alone covers 20% of global liquids, a figure that immediately frames the worst-case scenario.
Step 3 – Duration Probability Modelling: Short-duration disruptions attract smaller risk premiums. Threats involving naval mines, which require active clearance operations, extend the expected duration and therefore inflate the premium.
Step 4 – Front-Month Futures Repricing: The front-month crude contract reprices first and fastest, as algorithmic systems and discretionary traders simultaneously adjust exposure. This creates the sharp, compressed price movement characteristic of geopolitical events.
Step 5 – Refined Product Contagion: Gasoline, diesel, and jet fuel markets follow crude higher, transmitting the initial futures shock through to consumer-level pricing within days.
Geopolitical oil price spikes are typically front-loaded. Markets price the worst-case scenario first, then partially unwind as diplomatic clarity emerges. The June 2026 surge followed this textbook pattern precisely, with the sharpest gains concentrated in the early morning session.
Broader Energy Security Implications
Recurring Hormuz risk episodes carry strategic implications that extend well beyond short-term crude pricing. For oil-importing nations, each episode reinforces the investment case for pipeline infrastructure diversification, LNG import terminal capacity, strategic storage expansion, and accelerated energy transition investment.
The more concentrated a nation's import dependency on Hormuz-transiting crude, the higher the strategic premium attached to reducing that exposure. According to analysis from The Conversation, a sustained closure of the strait could trigger global economic chaos, underscoring why energy security planners treat this risk with such seriousness.
For Gulf producing states, the vulnerability is equally acute. Saudi Arabia and the UAE have invested significantly in bypass pipeline capacity, but as the numbers above demonstrate, existing alternatives cover only a fraction of export volumes. Economic diversification strategies such as Saudi Vision 2030 are, in part, a rational long-term response to the recognition that Hormuz dependency represents an existential risk to revenue stability.
For energy investors, the June 2026 episode serves as a reminder that geopolitical risk premiums in crude markets can re-emerge with extraordinary speed after periods of diplomatic optimism. The approximately 19% decline in Brent across May 2026, driven by ceasefire hopes and weak demand signals, was partially reversed in hours once those diplomatic assumptions were challenged.
Frequently Asked Questions
What percentage of global oil passes through the Strait of Hormuz?
Approximately 20% of global petroleum liquids, or 20 to 21 million barrels per day, transits the Strait of Hormuz under normal conditions, making it the world's single most critical oil chokepoint with no adequate alternative route for the majority of that volume.
Why did oil prices surge more than $6 in a single session?
Brent and WTI futures markets priced in the probability of severe supply disruption following reports that Iran had suspended diplomatic message exchanges with the US and that allied forces were considering blocking both the Strait of Hormuz and the Bab El-Mandeb Strait simultaneously. Additional reporting about recent mine deployments in the strait elevated the credibility and duration of the perceived threat.
What would a complete Hormuz blockade mean for oil prices?
A full closure, even temporary, would represent the largest supply shock in modern oil market history. Analyst estimates for such a scenario typically range from $120 to $150+ per barrel depending on duration, SPR response speed, and whether alternative routing could offset any portion of the disrupted volume.
What is Goldman Sachs's oil price forecast for Q4 2026?
Goldman Sachs projected Q4 2026 Brent at $90 per barrel and WTI at $83 per barrel, with Middle East supply disruptions identified as the primary upside risk and weak Chinese and European demand as the primary downside risk to those baseline projections.
How does the Bab El-Mandeb Strait add to Hormuz risk?
The Bab El-Mandeb carries approximately 6 to 7 million bpd toward Europe via the Suez Canal. A simultaneous blockade of both chokepoints would theoretically isolate over 25 million bpd of seaborne crude, a scenario with no historical parallel in terms of volume displaced.
Disclaimer: This article is for informational purposes only and does not constitute financial or investment advice. Oil price forecasts, geopolitical risk assessments, and supply disruption scenarios involve significant uncertainty. Past price behaviour during geopolitical events is not a reliable indicator of future outcomes. Readers should conduct their own research and consult qualified financial advisers before making investment decisions.
Want to Stay Ahead of the Next Major Resource Discovery?
While geopolitical shocks can move oil markets within hours, the same principle applies to mineral discoveries on the ASX — early positioning is everything. Discovery Alert's proprietary Discovery IQ model delivers real-time alerts the moment significant mineral discoveries are announced, transforming complex data across 30-plus commodities into actionable insights, so subscribers can act before the broader market catches on — start your 14-day free trial today, or explore historic discovery returns to understand just how transformative early positioning can be.