July 10, 2026
The Hidden Architecture Behind Oil's Most Violent Price Explosions
Few financial instruments reveal the raw mechanics of supply and demand quite like crude oil. Unlike equities, which can be supported by buybacks, earnings revisions, or central bank liquidity injections, physical oil obeys a brutal logic: when supply is threatened, price is the only available clearing mechanism. There is no printing press for barrels. Understanding this structural reality is the starting point for any serious analysis of whether oil is preparing for another US$100 breakout — and why the current setup deserves more attention than most investors are giving it.
When big ASX news breaks, our subscribers know first
Why Oil Markets Are Wired for Non-Linear Price Behaviour
The crude oil market operates differently from virtually every other major asset class. Its price is simultaneously determined by physical supply and demand fundamentals, geopolitical risk premiums embedded by traders, speculative positioning across futures markets, and the behavioural responses of sovereign producers whose interests rarely align with market stability.
This multi-layered pricing structure creates the conditions for what traders call non-linear price behaviour: moves that appear sudden and extreme relative to the information available, but which are entirely consistent with the underlying mechanics of the market once you understand how the system works.
Historical data confirms that oil is uniquely prone to explosive repricing events. Consider the pattern across the last four major breakouts:
| Period | Trigger Event | Price Move | Approximate Peak |
|---|---|---|---|
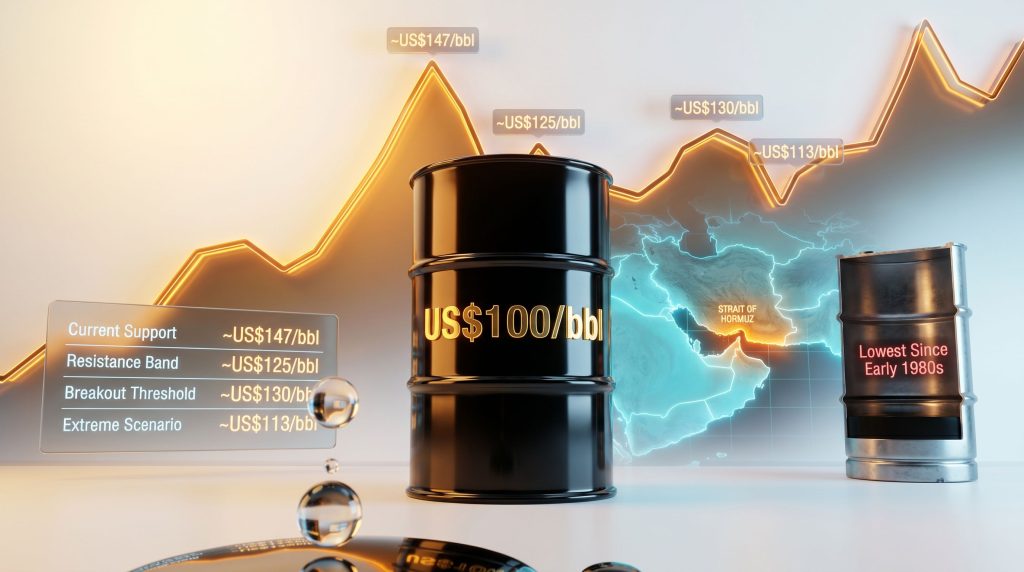
| CY2008 | Global commodity supercycle | Multi-year rally | ~US$147/bbl |
| 2011-2012 | Arab Spring and Iran sanctions | Sharp multi-month surge | ~US$125/bbl |
| CY2022 | Russia-Ukraine conflict | Rapid 6-week breakout | ~US$130/bbl |
| 2026 | Middle East conflict escalation | +70% across 6 trading sessions | ~US$113/bbl |
What these episodes share is not just the magnitude of the move, but the conditions that preceded it. In every case, crude was trading near multi-year lows, speculative positioning was relatively light, and the broader investment community had grown complacent about energy price risk. The geopolitical catalyst did not create the vulnerability; it simply revealed it.
The Strait of Hormuz: Understanding the World's Most Consequential Chokepoint
Any credible analysis of oil price risk in 2026 begins and ends with the Strait of Hormuz. This narrow waterway, approximately 33 kilometres wide at its narrowest navigable point, serves as the transit corridor for roughly 20 percent of the world's total oil supply. No alternative routing fully compensates for a sustained closure. Pipeline bypass capacity exists but is insufficient to absorb the full volume that moves through the strait daily.
What makes Hormuz so consequential from a market pricing perspective is not just the volume of oil it carries, but the speed at which disruption translates into physical scarcity. Unlike a mining strike or a refinery outage, which plays out over weeks, a military interdiction of the Strait of Hormuz creates an immediate supply deficit measured in millions of barrels per day. Markets price this instantaneously.
Recent events have demonstrated this sensitivity in real time. Reports of Iranian obstruction of commercial vessel traffic triggered immediate repricing, even before any confirmed physical supply disruption materialised. This is the geopolitical risk premium at work: markets do not wait for the supply disruption to occur; they price the probability of it happening. Furthermore, the trade war impact on oil prices adds an additional layer of complexity that sophisticated traders must account for when assessing overall supply risk.
A factor that remains underappreciated in mainstream commentary is the specific vulnerability of Kharg Island, the terminal through which the substantial majority of Iran's crude exports are loaded. Any credible military threat to this infrastructure represents not just a symbolic escalation but a direct attack on Iranian export capacity measured in multiple millions of barrels per day. The market's sensitivity to even rumours of such action is therefore rational, not speculative excess.
The Depleted Safety Net: What a Hollowed-Out SPR Means for Price Ceilings
One of the most structurally significant but least discussed factors in the current oil market setup is the condition of the United States Strategic Petroleum Reserve. The SPR currently sits near its lowest level since the early 1980s, a consequence of aggressive drawdowns deployed during previous price spikes.
This matters for a reason that goes beyond the simple arithmetic of available emergency supply. During the 2022 energy crisis, coordinated SPR releases helped moderate the pace of price increases, signalling to speculative markets that policymakers retained meaningful capacity to intervene. That signal itself had a dampening effect on futures positioning.
With the SPR materially depleted, that signal has weakened considerably. Sophisticated market participants understand that the government's ability to suppress price spikes through emergency releases is now structurally constrained. This changes the risk calculus for traders holding short positions during a geopolitical escalation: the probability of a policy-driven price cap being imposed from above is lower than at any point in the past four decades.
"The depletion of the SPR does not simply reduce the volume of available emergency supply. It removes a psychological ceiling on upside price risk that previously acted as a brake on speculative momentum during geopolitical crises."
Russia's Hidden Supply Constraint: What Official Data Doesn't Capture
While Middle East tensions dominate headlines, an underappreciated supply tightness is building in global refined product markets as a result of ongoing damage to Russian energy infrastructure. Drone and missile strikes on Russian refinery capacity have materially disrupted processing operations, creating a hidden tightness that does not show up cleanly in headline crude inventory data.
This is an important distinction for analysts. Crude oil inventories and refined product availability are related but not identical measures of market tightness. A refinery under capacity constraints absorbs less crude, which can temporarily inflate crude inventory figures even as diesel and jet fuel markets tighten. The true signal of supply stress in this environment comes from refined product crack spreads and physical delivery premiums, not headline inventory numbers.
Combined with existing Western sanctions limiting the effective reach of Russian crude exports, global effective supply is materially tighter than official production figures from OPEC's market influence and the International Energy Agency suggest. This hidden tightness is a factor that professional energy traders monitor closely but which rarely features in mainstream financial media coverage.
Anatomy of a Six-Day, 70 Percent Rally: How Oil Prices Actually Move
The mechanics of rapid crude price breakouts follow a consistent sequence that is worth understanding in detail, particularly for investors who have not witnessed one in real time.
-
Trigger event: A military escalation, chokepoint threat, or major infrastructure attack introduces immediate supply uncertainty into futures markets.
-
Initial repricing: Spot and near-month futures prices jump sharply as traders rapidly discount worst-case supply scenarios into current price.
-
Short squeeze acceleration: Institutional traders holding short positions face margin calls and are forced to cover simultaneously, amplifying upward momentum in a self-reinforcing loop.
-
Algorithmic momentum extension: Trend-following systematic funds detect the breakout signal and add long exposure, extending the move beyond what fundamental supply analysis alone would justify.
-
Peak and partial retracement: As the immediate uncertainty resolves through ceasefire negotiations, supply rerouting, or diplomatic intervention, prices retrace from peak levels.
-
Structural floor reset: Critically, even after retracement, prices rarely return fully to pre-event levels if the underlying supply vulnerability has been structurally exposed rather than resolved.
The 2026 Middle East escalation followed this sequence with textbook precision. WTI and Brent futures moved from approximately US$70 per barrel to US$113 per barrel within six trading sessions, a gain exceeding 70 percent. The move subsequently retraced as ceasefire arrangements were announced, returning crude to the US$70 range where it currently trades. According to CommSec's James Gruber, oil prices jumped 4.8 per cent overnight to US$91.98 at one stage during this volatile period, illustrating just how rapidly prices can shift within a single session.
The next major ASX story will hit our subscribers first
Where Oil Stands Now: Reading the Post-Rally Setup
The complete retracement of the war premium is itself a significant data point. From a technical market structure perspective, crude has essentially returned to the same price level from which the explosive rally launched, effectively resetting the clock on the geopolitical risk premium without resolving any of the underlying supply vulnerabilities that enabled it.
Key price levels currently define the market's structure:
| Price Level | Market Significance |
|---|---|
| ~US$70/bbl | Current trading range; post-rally retracement support |
| ~US$80-85/bbl | First meaningful resistance zone; prior consolidation range |
| ~US$100/bbl | Psychological and structural breakout threshold |
| ~US$113/bbl | Recent conflict-driven peak |
| ~US$130+/bbl | Analyst-projected scenario under sustained Hormuz closure |
A weekly close above US$80 per barrel accompanied by rising volume would represent the first technically meaningful signal that a fresh bullish trend is reasserting itself. A sustained break above US$85 would likely trigger systematic buying from quantitative trend-following funds, accelerating the move.
The critical discipline here is to allow price to confirm the narrative before committing capital. Geopolitical analysis can identify the conditions for a price move, but only price action itself confirms that those conditions are being absorbed by market participants in the way the analysis suggests.
The Four Scenarios That Could Reignite the US$100 Breakout Thesis
Scenario 1: Strait of Hormuz Escalation Resumes
A breakdown in ceasefire arrangements triggering renewed US-Iran military exchanges represents the highest-impact scenario. Analysts project crude could exceed US$130 per barrel under a sustained closure, with initial market repricing occurring within 24 to 48 hours of confirmed interdiction.
Scenario 2: Kharg Island Infrastructure Becomes a Military Target
Direct strikes on Iran's primary oil export terminal would remove a significant portion of Iranian export capacity from global supply immediately. The market reaction would be instantaneous, with the potential for multi-week elevated pricing as alternative supply sources are assessed.
Scenario 3: Diplomatic Resolution and Price Moderation
Successful US-Iran negotiations producing a credible agreement and the resumption of Iranian oil flows represent the primary bearish scenario. In line with this, oil prices fluctuate as investors await a US-Iran deal, with additional supply entering the market potentially pushing crude toward US$60 to US$65 per barrel, reversing the structural tightness that currently underpins the bullish case.
Scenario 4: Russian Infrastructure Disruptions Compound
Continued escalation of strikes on Russian refinery and pipeline infrastructure would tighten global refined product markets over a period of weeks to months. This scenario is less dramatic than a Hormuz event but produces a more structurally persistent form of price pressure.
The US$100 Threshold: Why This Number Is More Than Psychology
The US$100 per barrel level functions as a genuine economic inflection point, not merely a psychological round number. Below this threshold, most demand destruction mechanisms remain dormant. Consumers absorb higher fuel costs, industrial users tolerate elevated input prices, and central banks treat energy inflation as a transitory factor.
Above US$100, a qualitatively different set of responses is activated:
- Central banks begin formally incorporating sustained energy inflation into monetary policy deliberations
- Governments implement emergency demand-side interventions, including fuel subsidies, consumption restrictions, and windfall taxes on energy producers
- Industrial users accelerate efficiency investments and fuel-switching decisions that structurally reduce oil demand over subsequent years
- Sovereign wealth funds and pension allocators begin rebalancing toward energy sector overweights
This threshold has been breached and sustained during each of the last three major geopolitical supply shocks, and each time it has triggered the full suite of responses described above. The duration of these US$100-plus regimes has varied considerably, from months to years, depending on the persistence of the underlying supply disruption.
Risk Management Principles for Navigating Volatile Oil Markets
For investors considering exposure to the oil price thesis, disciplined risk management is not optional; it is the primary determinant of whether a correct directional view actually translates into a positive outcome.
Several principles are worth internalising before positioning, and understanding commodity volatility hedging strategies can be particularly valuable in this context:
- Position sizing discipline: Allocate only what can be entirely lost without material impact on broader portfolio health. Commodity markets can move against positions at speeds that leave little room for adjustment.
- Predefined stop-loss levels: Entering a position without a predetermined exit point on the downside is not investing; it is speculating without a risk framework. A defined stop-loss, such as 5 percent below entry, limits downside while preserving upside exposure.
- Price confirmation over narrative: Geopolitical analysis identifies the conditions for a move. Price action confirms whether markets are actually responding to those conditions. Entering on narrative alone, before price confirms, is among the most common and costly errors in commodity trading.
- Speed awareness: Geopolitical oil spikes are among the fastest-moving events in financial markets. The entire 70 percent move in the most recent escalation unfolded in less than a week. Traders who were positioned before the catalyst benefited most; those who attempted to react after the move had already largely occurred captured a fraction of the opportunity.
Disclaimer: The scenarios, frameworks, and analysis presented in this article are intended for educational and informational purposes only. They do not constitute financial advice. Past performance of oil markets during geopolitical events does not guarantee future outcomes. Readers should consult a licensed financial adviser before making any investment decisions related to commodity markets or energy sector instruments.
What Australian Investors Should Understand About Oil Exposure
For Australian-based investors, accessing oil price exposure involves navigating an additional layer of complexity beyond the commodity itself. USD-denominated oil markets interact with the AUD/USD exchange rate in ways that can amplify or partially offset price movements depending on currency direction.
Indirect exposure options available through ASX-listed instruments include:
- Energy sector ETFs with significant weighting toward global oil and gas producers
- ASX-listed energy companies with material oil and gas operations that provide leveraged operational exposure to crude price movements
- Commodity-linked structured products and contracts for difference, which carry their own specific risk characteristics and are appropriate only for investors who fully understand the instruments
The key analytical insight for Australian investors is that ASX-listed energy companies often exhibit beta greater than one relative to underlying crude price movements, meaning their share prices tend to amplify both upside and downside oil price moves. This leverage can be advantageous in a bullish oil scenario but requires proportionally greater risk management discipline.
Keeping the Thesis in Perspective
The case for monitoring crude oil price trends for a potential renewed move toward US$100 per barrel rests on a convergence of factors rather than any single catalyst. The SPR remains historically depleted. Russian refinery capacity is under sustained pressure. The Strait of Hormuz continues to represent a critical vulnerability in global energy logistics. US crude inventories are drawing at a pace consistent with tightening physical markets.
None of these factors guarantee that oil is preparing for another US$100 breakout. Markets are probability distributions, not certainties, and the diplomatic resolution scenario is a genuine and meaningful possibility. What the current setup does offer is an asymmetric risk profile: meaningful upside potential if the supply vulnerabilities are realised, against a downside that is structurally bounded by OPEC+ production discipline and global demand floors.
The traders who benefited most from the last breakout were not those who reacted to the news. They were those who understood the structural setup in advance and had already identified their entry criteria, their risk parameters, and their exit strategy. The current environment offers a second look at a similar setup. Whether it develops into a comparable opportunity depends entirely on what price does next.
For further analysis of energy sector developments and Australian market commentary, readers can explore The Market Online, which covers domestic and global energy market dynamics across its dedicated Energy news section.
Want to Stay Ahead of the Next Major ASX Resource Discovery?
While oil markets navigate geopolitical volatility and supply shocks, Discovery Alert's proprietary Discovery IQ model scans ASX announcements in real time, delivering instant alerts on significant mineral discoveries so subscribers can act before the broader market responds — explore historic discoveries and their returns, then begin a 14-day free trial to position yourself ahead of the next major opportunity.