June 25, 2026
When the Chokepoint Opens: Understanding Oil's Freefall Toward $70
Every few years, global energy markets are forced to confront a simple but unsettling truth: a single maritime passage, barely 33 kilometres wide at its narrowest point, can hold the entire world's industrial economy to ransom. The Strait of Hormuz has long functioned as the jugular vein of global crude supply, and when that vein was squeezed following military strikes on Iran in late February 2026, markets responded with a ferocity not seen since the most acute geopolitical energy shocks of prior decades. Brent crude surged past $126 per barrel. Insurance premiums on tanker voyages spiked. Refinery procurement teams scrambled for alternative sources.
Now, the reversal is equally dramatic. As crude slips toward $70 after Hormuz tankers return to normal operating patterns, markets are processing a different kind of shock: not scarcity, but sudden surplus. Understanding what that means for producers, importers, traders, and long-term energy investors requires looking beyond the headline price moves and into the structural mechanics driving them.
When big ASX news breaks, our subscribers know first
The $56 Collapse: Mapping Oil's Full Price Arc in 2026
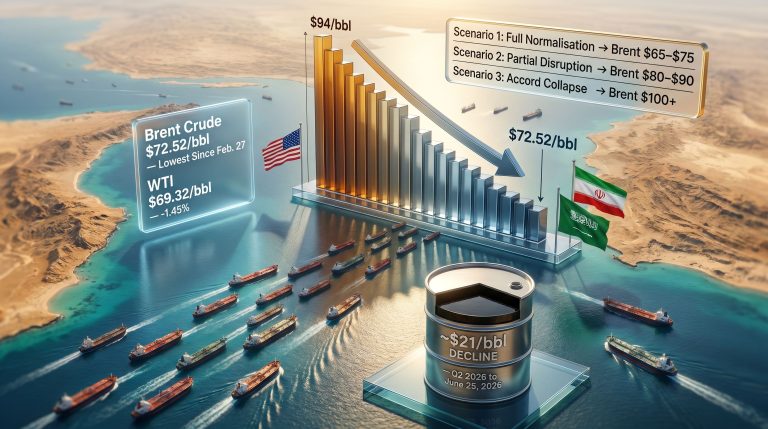
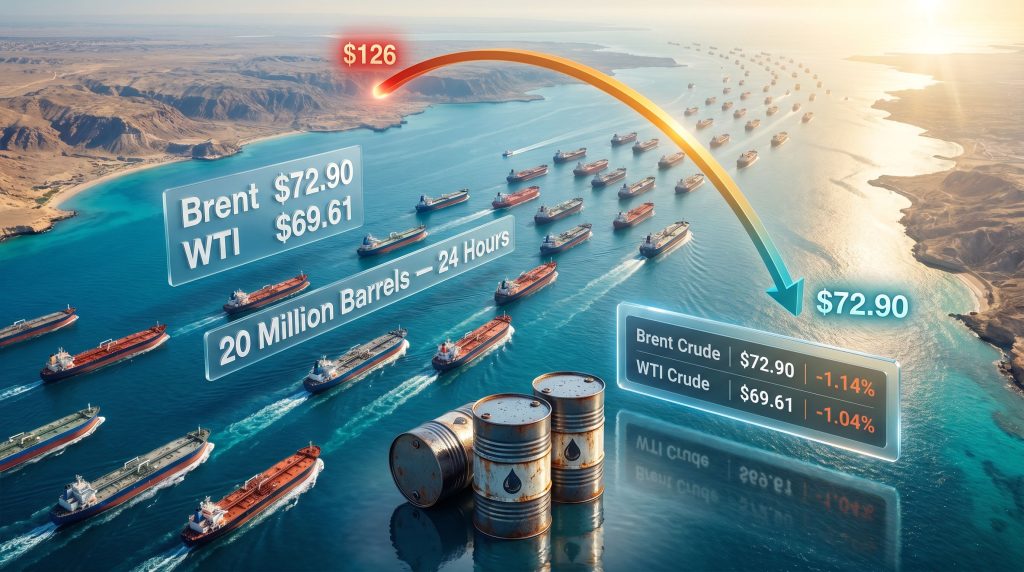
The scale of the price reversal between the February crisis peak and late June 2026 is extraordinary by any historical measure. Brent crude lost more than $53 per barrel in a matter of weeks, dropping from above $126 to approximately $72.90 by June 25, 2026. WTI crude tracked a similar trajectory, touching $69.61 and edging toward the psychologically significant $70 threshold.
The prior session had already signalled the severity of the selling pressure, with Brent declining to $75.71 (down 1.8%) and WTI falling to $72.13 (down 1.5%). At those levels, Brent was trading at its weakest point since February 27, while WTI had retreated to pricing last seen in early March. Furthermore, monitoring crude oil price trends in the lead-up to the crisis provides essential context for how dramatically the supply picture has shifted.
| Benchmark | Price (USD/bbl) | Daily Change |
|---|---|---|
| Brent Crude (Jun 25) | $72.90 | -1.14% |
| WTI Crude (Jun 25) | $69.61 | -1.04% |
| Brent (Prior Session) | $75.71 | -1.80% |
| WTI (Prior Session) | $72.13 | -1.50% |
| Peak Crisis Price (Brent) | $126+ | N/A |
What these numbers represent is not merely a correction. They signal the near-complete unwinding of a geopolitical risk premium that had been embedded in global oil pricing since the US-Israel strikes on Iranian targets in late February 2026. Separating the fundamental value of crude from its crisis premium is essential for any meaningful analysis of where prices go from here.
The Strait of Hormuz: Why 33 Kilometres Can Move Global Markets
The Strait of Hormuz connects the Persian Gulf to the Gulf of Oman and ultimately to the broader global seaborne crude trade. Its strategic importance cannot be overstated. Estimates have historically placed somewhere between 20% and 30% of the world's seaborne oil exports transiting through this passage. Even a partial restriction on tanker movement through the strait creates an immediate tightening of global supply that futures markets price in within hours.
What makes Hormuz uniquely vulnerable as a chokepoint is not just its physical narrowness, but the concentration of regional producers that depend on it for export access. Qatar, Kuwait, Iraq, the UAE, and Saudi Arabia all rely on Hormuz to varying degrees to move crude to export terminals and onward to Asian and European refiners. Iran, which borders the strait on its northern edge, has historically wielded the implicit or explicit threat of transit restriction as a geopolitical lever. The interplay between oil and geopolitics has rarely been more starkly illustrated than in the 2026 crisis.
The 2026 Crisis: From Strike to Strangulation
The sequence of events that drove Brent above $126 followed a recognisable pattern from prior Middle East supply shocks, but with a sharper initial reaction:
-
Late February 2026: Joint US-Israeli military strikes on Iranian targets trigger an immediate retaliatory response from Tehran, including a tightening of Hormuz transit controls.
-
March through May 2026: Global crude benchmarks repeatedly breach the $100 per barrel level. War-risk insurance premiums on tankers surge, adding a further cost premium to any cargo exiting the Gulf.
-
Early June 2026: Diplomatic channels between Washington and Tehran begin producing substantive progress toward an interim framework.
-
June 24–25, 2026: Tanker traffic resumes at normalised volumes. Three vessels that had been stranded in the strait, carrying a combined 5 million barrels of crude, begin their passage. US Energy Secretary Chris Wright confirms that approximately 20 million barrels of oil moved through the strait within a single 24-hour period, consistent with pre-crisis flow rates.
-
June 25, 2026: Crude prices register their sharpest multi-session decline since the conflict began.
Physical Markets and the Anatomy of a Mini Glut
One of the most instructive signals in commodities markets is not the futures price itself, but the relationship between futures and physical cargo pricing. When physical crude trades at a discount to the forward curve, it reveals that immediate supply is exceeding what refiners and traders are willing to absorb at prevailing prices.
As of late June 2026, physical crude cargoes across global markets were trading at precisely those discounts. This is the defining characteristic of what market participants were calling a mini glut: a temporary but significant mismatch between restored supply and demand capacity that cannot adjust instantaneously.
Neil Crosby, head of research at Sparta Commodities, described the situation to Reuters as involving the prospect of a significant rush of physical supply out of the Arab Gulf, with the market now in a mini glut while demand needs to be drawn back in. That framing captures something important about how commodity markets actually function: demand suppressed by months of $100-plus pricing does not simply return the moment prices fall. Consumers, industrial users, and refiners have adjusted their behaviour and will take time to re-engage.
Why Demand Cannot Recover Instantly
The demand-side dynamics following a sustained price shock are more complex than they appear. During the period when Brent was consistently above $100 per barrel, several structural adjustments occurred across the consumer landscape:
- Industrial energy users accelerated fuel efficiency programmes and in some cases switched to alternative energy sources where feasible.
- Asian refinery procurement desks shifted toward lighter, non-Gulf crude grades available at lower logistical risk premiums, including blends from West Africa and the Americas.
- Speculative positioning in oil futures built up significant net long exposure as traders bet on continued supply disruption. That positioning is now being unwound at speed.
- Government strategic petroleum reserve (SPR) releases in various consuming nations had supplemented supply during the crisis period, reducing the urgency of spot market purchases.
Each of these adjustments takes time to reverse. The physical crude discount environment is the market's way of signalling that the supply side has moved faster than the demand side can accommodate.
Futures Market Mechanics: The August Delivery Squeeze
Bob Yawger, director of energy futures at Mizuho, told Reuters that traders were selling the flood of oil coming to market from the Middle East and trying to unload contracts quickly, with particularly heavy selling pressure concentrated in August delivery contracts.
This observation points to a specific and often underappreciated dynamic in oil futures markets. When a supply shock reverses, traders who had built long positions in near-term delivery contracts face a rapidly deteriorating mark-to-market position. In addition, monitoring WTI and Brent futures positioning data provides further insight into how the unwinding is progressing across both benchmarks.
The August contract, as the next prompt delivery period at the time of the price decline, became the focal point for position liquidation. This type of technically-driven selling amplifies fundamental price moves. The market is not simply responding to more oil; it is also responding to the mechanical unwinding of speculative positioning that had been calibrated to a world of constrained Hormuz transit. When that thesis breaks, the exit becomes self-reinforcing.
The distinction between fundamental selling (too much oil) and technical selling (too many longs) is critical for investors trying to identify where the price floor actually sits. Both are happening simultaneously in June 2026, which explains why the price move has been so rapid.
Iran's Export Recovery: The Variable That Could Define H2 2026
Layered on top of the Hormuz reopening is a second and potentially more durable supply variable: the prospect of Iran materially increasing crude exports under a temporary reprieve from US sanctions. Iran's production capacity has been constrained for years under successive sanctions regimes, and even a partial restoration of export volumes would add meaningfully to global supply.
The critical uncertainty is how far any interim deal actually extends, and how quickly Iranian production can respond to relaxed export restrictions. Iran's upstream infrastructure has suffered from years of underinvestment due to sanctions-related financing constraints. While the country's geological endowment remains significant, the pace at which productive capacity can be restored is a genuine technical question.
Analysts have noted that the oil prices fell sharply as Hormuz reopening hopes gained momentum, illustrating how swiftly sentiment can shift when diplomatic signals change direction.
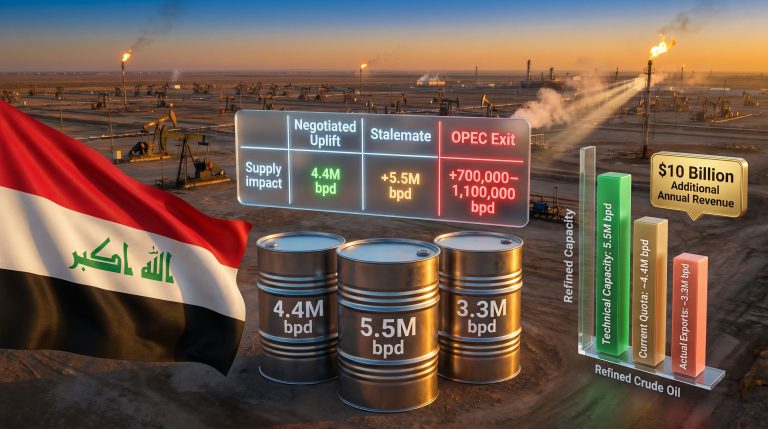
| Scenario | Estimated Additional Supply | Brent Price Implication |
|---|---|---|
| Partial sanctions relief | +500,000 to 800,000 bbl/day | Moderate downward pressure |
| Full interim deal implementation | +1.0 to 1.5 million bbl/day | Significant surplus conditions |
| Deal collapse or re-imposition | Minimal change | Price floor support near $70 |
Analysts tracking the region have noted that full stabilisation of production flows across Qatar, Iraq, and Saudi Arabia may not be complete until Q4 2026, introducing a window of continued uncertainty that could generate volatility in either direction depending on diplomatic developments.
The next major ASX story will hit our subscribers first
OPEC+ and the Cartel's Uncomfortable Position
The alliance's strategic position has become considerably more complicated since the Hormuz situation evolved. During the months of high prices, OPEC+ benefited from a form of involuntary supply restriction that it did not need to engineer through formal quota mechanisms. The strangling of Hormuz transit did the work for them. However, OPEC's market influence is now being tested in a way that voluntary production discipline alone may struggle to address.
Now, with that dynamic reversing, the cartel faces a genuine strategic dilemma with three broad pathways:
- Defend price floors through additional voluntary production cuts, at the cost of ceding further market share to non-OPEC producers, particularly US shale.
- Allow markets to clear the current surplus, accepting near-term price weakness while preserving production capacity and market position.
- Accelerate planned production increases, a more aggressive approach that could push prices lower in the short term but consolidate long-run market positioning.
Saudi Arabia's position is particularly constrained. The IMF has estimated the Kingdom's fiscal breakeven oil price for 2026 at approximately $80 to $90 per barrel, creating a structural tension with Brent trading near $70. At current prices, the Kingdom is generating insufficient oil revenue to fund its Vision 2030 economic transformation programme without drawing on reserves or increasing debt issuance.
The $70 Floor: Who Wins, Who Loses
Price normalisation toward $70 per barrel reshapes the economic landscape across the full spectrum of energy market participants. The impacts are far from uniform. Consequently, understanding the oil market trade risks that compound the demand-side uncertainty is essential for a complete picture.
| Stakeholder Group | Impact at $70/bbl | Key Consideration |
|---|---|---|
| Oil-importing nations (India, China, EU) | Positive, reduced import costs | Demand recovery may be gradual |
| Gulf producer states | Negative, below fiscal breakeven | Saudi breakeven estimated at $80–90/bbl |
| US shale producers | Mixed, marginal wells uneconomic | Basin breakevens range from $45–65/bbl |
| Global shipping and logistics | Positive, lower bunker fuel costs | Insurance premiums normalising |
| Renewable energy investment | Neutral to mildly negative | Long-term transition thesis intact |
| Commodity-linked currencies (CAD, NOK) | Negative, depreciation pressure | Strong correlation with oil price direction |
For India specifically, the price normalisation carries significant macroeconomic relief. As one of the world's largest crude importers, India's current account deficit was under material pressure during the months when Brent traded above $100. Sustained pricing closer to $70 would reduce import bills meaningfully, though the full benefit depends on the repricing timeline for long-term supply contracts and domestic fuel pricing policy.
Scenario Modelling for Crude Pricing Through Q4 2026
Scenario A: Sustained Diplomatic Progress (Base Case)
The US-Iran interim framework holds and Iranian exports increase gradually. OPEC+ maintains current production discipline without significant additional cuts. Brent stabilises in a $68 to $78 range through the end of 2026. Physical crude discounts narrow as demand progressively absorbs incremental supply.
Scenario B: Deal Fragility and Renewed Tension (Downside Risk for Supply)
The interim agreement breaks down and the US reimports sanctions pressure on Iranian exports. Hormuz transit uncertainty returns, though at lower intensity than the peak crisis period. Brent rebounds toward $85 to $95 as risk premiums re-enter pricing and speculative long positions are rebuilt rapidly.
Scenario C: Full Supply Normalisation With Demand Disappointment (Bear Case)
Iran achieves a more complete export recovery than expected. Global demand growth disappoints, particularly if major Asian economies show weaker industrial output. OPEC+ discipline fractures under sustained price pressure. Brent tests $60 to $65 support levels in Q4 2026, with refinery margins compressing and upstream investment decisions deferred across the sector.
Key Facts Investors Should Monitor Going Forward
As crude slips toward $70 after Hormuz tankers return to normalised operations, several indicators will determine whether the current price level represents a floor or a transition toward deeper weakness:
- The trajectory of physical crude cargo premiums and discounts relative to futures, as a leading indicator of supply-demand balance
- The pace of Iranian export volume recovery under any interim sanctions arrangement and Tehran's capacity to restore production quickly
- OPEC+ communication and compliance data, particularly any indications that member discipline is fracturing under the lower-price environment
- August contract open interest and positioning in WTI and Brent futures, as the technical unwinding of long positions plays out
- Saudi Arabia's fiscal signalling, including any statements about production policy in the context of the Kingdom's breakeven constraints
- The durability of the US-Iran diplomatic framework beyond its initial interim phase
Disclaimer: This article contains forward-looking scenarios and market analysis based on publicly available information as of June 25, 2026. Oil price projections involve significant uncertainty and should not be construed as financial or investment advice. Markets may diverge materially from any scenario described here based on geopolitical, macroeconomic, or supply-side developments that cannot be predicted with precision.
Want To Stay Ahead of the Next Major Commodity Discovery Before the Market Catches On?
While oil's dramatic swing from $126 to $70 demonstrates how swiftly commodity markets can shift, Discovery Alert's proprietary Discovery IQ model scans the ASX daily to deliver real-time alerts on significant mineral discoveries — transforming complex data into actionable insights the moment announcements hit. Explore historic discoveries and their extraordinary returns, then begin your 14-day free trial at Discovery Alert to position yourself ahead of the next major market move.