
July 25, 2026
The Mechanics of a War Premium Collapse: How Oil Markets Reprice at Speed
Few forces in commodity markets move as fast as the unwinding of a geopolitical risk premium. When supply disruptions tied to conflict or sanctions are suddenly reversed, crude oil prices do not ease gradually — they reprice in waves, as every forward contract, physical cargo agreement, and speculative position recalibrates simultaneously. Understanding this dynamic is essential to making sense of why oil prices on rising Middle East supply have become the dominant narrative in global energy markets heading into the second half of 2026.
The structural tension at play right now is not simply about conflict and resolution. It is about the gap between what markets were pricing and what is physically happening. For months, crude oil price trends embedded a substantial disruption premium into every barrel traded globally. As that premium evaporates, the downward repricing is not a sign of demand weakness. It is the market correcting an overestimate of sustained disruption risk.
When big ASX news breaks, our subscribers know first
From Risk Premium to Physical Reality: The Central Tension in Crude Pricing
What a War Premium Actually Looks Like in Price Terms
A war premium in oil pricing reflects the additional cost buyers are willing to pay above fundamental supply-demand equilibrium to insure against worst-case disruption scenarios. During periods of active conflict near critical energy infrastructure, this premium can add anywhere from $5 to $25 per barrel to benchmark prices, depending on the severity and duration of perceived supply risk.
What makes the current unwinding so analytically interesting is its velocity. According to IG Markets analyst Tony Sycamore, the pace of the decline surprised a large portion of market participants, with the market pricing in a far faster return of Middle Eastern barrels than most observers had anticipated even two weeks prior. This speed is itself a market signal: it reflects how aggressively the premium had been built up, and how quickly consensus can shift when credible supply resumption data arrives.
The repricing is not merely psychological. It is being driven by concrete physical evidence of returning supply, which makes this cycle different from some past geopolitical unwinds where sentiment moved ahead of actual barrel flows. Furthermore, the oil price crash dynamics observed in prior cycles offer a useful analytical baseline for understanding the current repricing speed.
What the Brent Futures Curve Reveals
One of the clearest technical indicators of near-term oversupply expectations is the structure of the Brent futures curve. As of June 25, 2026, August Brent futures were trading at $72.52 per barrel, while September Brent was priced at $73.59 per barrel. This configuration, known as contango — where near-term prices sit below forward prices — is a textbook signal of ample prompt-month supply.
In a tighter market, the opposite structure, called backwardation, prevails, where buyers pay a premium for immediate delivery. The shift from backwardation to contango in the Brent curve is a structural confirmation that physical supply is returning to the market faster than demand can absorb it in the near term.
For traders and physical cargo buyers, this has immediate practical implications. Refiners have less incentive to build inventories aggressively when the forward curve signals cheaper barrels are available later. Speculative long positions become harder to hold when the carry economics turn negative.
How Large Is This Price Move? Putting the Numbers in Perspective
Crude Price Performance: Statistical Snapshot (June 25, 2026)
| Benchmark | Price (June 25, 2026) | Change | % Move | Context |
|---|---|---|---|---|
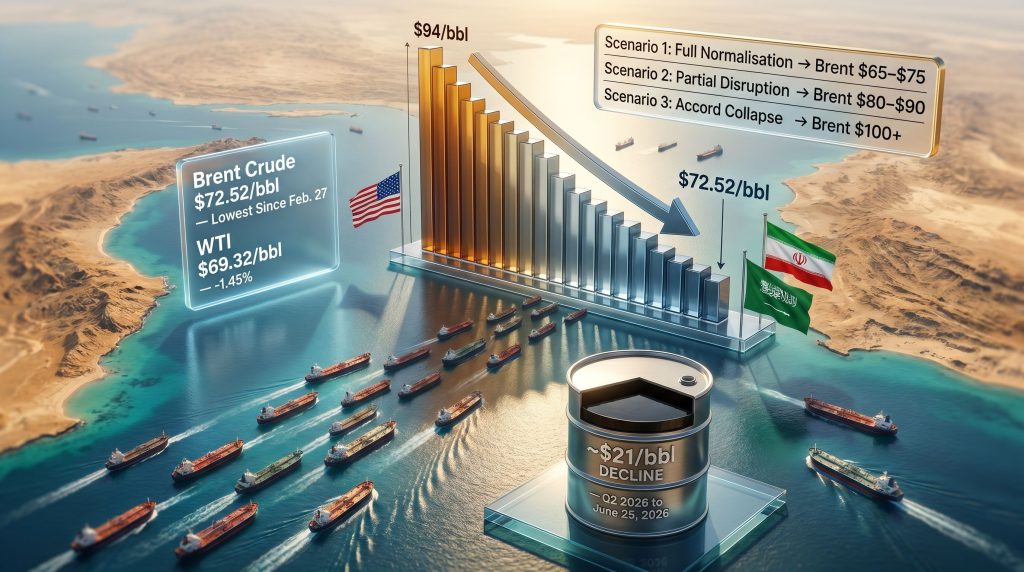
| Brent Crude (Aug. Futures) | $72.52/bbl | -$1.22 | -1.65% | Lowest since Feb. 27 |
| WTI Crude | $69.32/bbl | -$1.02 | -1.45% | Lowest since Feb. 27 |
| Brent (Prior Session) | ~$73.74/bbl | -$3.00+ | ~-4% | Multi-week low |
| Brent Q2 2026 Average | ~$94/bbl | — | — | Conflict-era peak |
| WTI Q2 2026 Average | ~$87/bbl | — | — | Conflict-era peak |
The scale of the decline from Q2 2026 peaks is substantial. Brent has fallen approximately $21 per barrel from its conflict-era Q2 average of around $94, representing a decline of roughly 22%. WTI has shed a comparable proportion from its Q2 average of approximately $87 per barrel.
A single-session drop of over $3 on June 24 amplified market anxiety and compressed risk premiums further, as stop-loss orders triggered and momentum traders extended the move. Historically, single-day declines of this magnitude in crude benchmarks tend to generate self-reinforcing selling pressure in the short term, regardless of underlying fundamental validity.
Comparing this repricing velocity to historical analogues is instructive. The post-Gulf War unwinding of supply risk in the early 1990s and the sharp crude corrections following peak COVID-era demand recovery both featured similar dynamics: price spikes built on disruption fears, followed by rapid corrections once physical supply realities reasserted themselves. According to Commonwealth Bank's energy market analysis, these cycles share consistent structural features that help frame current price behaviour.
The Supply-Side Mechanics Driving Oil Prices Lower
The Strait of Hormuz: From Strategic Chokepoint to Resuming Conduit
Approximately one-fifth of global oil supply transits the Strait of Hormuz, making it the single most consequential maritime chokepoint in the energy world. When the conflict disrupted flows through this passage, the supply risk embedded in crude prices was not theoretical. It reflected the potential loss of millions of barrels per day from global markets.
The reversal of that disruption is now unfolding in real time. US Energy Secretary Chris Wright confirmed on June 25, 2026 that at least 20 million barrels had exited the strait within a single 24-hour window, with throughput approaching pre-conflict levels. Wright further indicated that full normalisation would require additional weeks due to the need for demining operations along shipping lanes.
Several developments are accelerating this process:
- Oman opened temporary tanker routing corridors to allow departures from the Strait while permanent lanes are cleared
- The International Maritime Organization (IMO) and Omani maritime authorities are coordinating vessel movements through the transitional period
- Qatar's prime minister visited Oman specifically to initiate trilateral negotiations on long-term Strait governance involving Iran, Iraq, and Gulf states
- Wright publicly stated that Iran would not be able to close the strait again — a statement that carries significant weight as a market signal by reducing the perceived probability of re-closure
This last point deserves particular attention. When a senior US energy official makes a categorical public statement about the permanent accessibility of a critical supply route, it structurally reduces the risk premium that markets can justify embedding in forward prices, even if the underlying geopolitical situation remains fluid.
Iran's Export Recovery: A Compounding Supply Catalyst
Beyond the Strait reopening, Iran's return to global export markets represents a second, independent supply catalyst that is compounding downward price pressure. An initial accord reached in late June 2026 established a 60-day negotiation window covering Iran's nuclear programme, Strait management, and the framework for sanctions relief.
Under the temporary reprieve from US sanctions accompanying this accord, Iranian crude is re-entering global markets at an accelerating pace. The supply significance of this development is substantial. Analysts had previously modelled a potential 2 million barrel-per-day disruption risk from Iran during the conflict period. The unwinding of that risk represents equivalent upward pressure on available global supply.
Importantly, rising Middle Eastern supply volumes have a second-order effect beyond simply adding barrels to global totals. As Iranian and broader Middle Eastern cargoes re-enter the market, they compress spot cargo differentials on physical crude globally. Asian buyers, particularly in China and India, who pivoted to alternative suppliers during the disruption period, now have access to competitively priced Middle Eastern crude again. This displaces higher-cost alternative barrels and puts downward pressure on differentials across North Sea, West African, and US crude grades.
However, it is worth noting that analysts tracking trade war oil pressures have cautioned that demand-side factors from ongoing global trade tensions could compound any supply-driven price decline, creating additional downside risk to consensus forecasts.
Critical risk caveat: The 60-day negotiation window is the single most important variable for oil price direction heading into Q3 2026. If discussions over Iran's nuclear programme stall or collapse, markets could rapidly reprice Brent back toward the mid-$90s, with tail-risk scenarios projecting a breach of $100 per barrel in any renewed Strait closure scenario.
OPEC+ Production Policy: A Compounding Variable
Adding further complexity to an already dynamic supply picture, OPEC+ production increase commitments of over 200,000 barrels per day are arriving simultaneously with Middle Eastern supply normalisation. The confluence of these two supply streams creates a compounding oversupply dynamic that bears monitoring closely. OPEC's market influence over price formation remains substantial, even as geopolitical factors dominate near-term trading narratives.
Saudi Arabia's fiscal breakeven oil price sits in the $80 to $90 per barrel range, which means current prices are already testing the kingdom's budget assumptions. This creates a strategic tension: Saudi Arabia and other core OPEC+ members have both the incentive to defend price floors and the policy tools to pause or reverse production increases if prices deteriorate further. The OPEC production impact on global balances will be a critical factor in determining whether prices stabilise or continue their downward trajectory. Whether that discipline can be maintained as prices fall toward levels that threaten fiscal sustainability remains an open question.
Why Bullish US Inventory Data Was Ignored by Markets
A 42-Year Low in US Crude Stocks That Moved Nothing
In most market environments, a report from the US Energy Information Administration showing crude inventories at their lowest level since 1984 would be unambiguously bullish for oil prices. The signal it sends is clear: domestic supply is tight, refinery demand is high, and the emergency reserve buffer is being drawn down.
Yet markets were effectively unmoved by this data. Traders focused almost entirely on Strait of Hormuz reopening dynamics and the forward supply implications of Iran's export recovery. This disconnect illustrates a well-understood principle in commodity price discovery: when a powerful macro-level supply narrative is in motion, domestic inventory signals lose their typical influence on price formation.
The inventory draw itself reflected strong refinery throughput combined with releases from the Strategic Petroleum Reserve (SPR). Both factors suggest the tightness is partly manufactured by high utilisation rates rather than structural scarcity, which may explain why markets treated the data as less definitive than the headline number implies.
The analytical question this raises is important: US inventory tightness remains a latent bullish factor. If geopolitical risks re-escalate and Middle Eastern supply normalisation stalls, the combination of tight US stocks and renewed Strait uncertainty could produce a rapid and violent reversal of the current downtrend.
Analyst Forecasts: Where Do Oil Prices Go From Here?
Macquarie's Base Case and the Goldman Range
| Benchmark | Q2 2026 Average | Q3 2026 Forecast (Macquarie) | Implied Decline |
|---|---|---|---|
| Brent Crude | ~$94/bbl | ~$67/bbl | ~-$27/bbl (-29%) |
| WTI Crude | ~$87/bbl | ~$62/bbl | ~-$25/bbl (-29%) |
Macquarie's analytical framework rests on the premise that supply chains adapt to geopolitical normalisation faster than conventional risk models assume. Their Q3 2026 forecasts of $67 Brent and $62 WTI embed assumptions of full Strait reopening, sustained Iranian export recovery, and no major breakdown of the initial accord.
Goldman Sachs has outlined a longer-term range of $70 to $85 per barrel for Q4 2026, contingent on no renewed major disruption. The spread between Macquarie's more aggressive Q3 forecast and Goldman's Q4 range reflects the degree of analytical uncertainty still embedded in consensus views. Goldman Sachs notes that supply disruption tail risks remain a meaningful upside scenario that markets should not entirely discount.
Three Scenarios Every Market Participant Should Understand
Scenario 1: Full Normalisation (Base Case)
- Strait fully demined and reopened within 4 to 6 weeks
- Iranian exports recover toward pre-conflict volumes over 60 to 90 days
- Brent stabilises in the $65 to $75 range through Q3 2026
Scenario 2: Partial Disruption (Risk Case)
- Negotiations during the 60-day window stall on nuclear programme issues
- Iran curbs export recovery; Strait faces intermittent disruption
- Brent rebounds toward the $80 to $90 range
Scenario 3: Accord Collapse (Tail Risk)
- Diplomatic framework breaks down; renewed Strait closure risk emerges
- Global supply disruption of 2 or more million barrels per day
- Brent potentially exceeds $100 per barrel; WTI follows into the mid-$90s
The next major ASX story will hit our subscribers first
The Broader Macroeconomic Implications of Falling Oil Prices
Inflation, Central Banks, and Emerging Markets
The transmission mechanism from crude oil prices to broader macroeconomic outcomes is well-documented. A sustained decline in Brent toward the $65 to $72 range would represent a meaningful deflationary impulse for major economies still navigating elevated inflation environments.
Lower energy input costs reduce transport expenses, manufacturing overheads, and ultimately consumer price pressures. For the US Federal Reserve and the European Central Bank, a sustained oil price decline arriving alongside moderating core inflation could alter the calculus around future rate decisions, potentially providing additional policy flexibility.
The deflationary tailwind is most pronounced for oil-importing emerging market economies, particularly India, China, and Southeast Asian nations that carry significant energy import burdens. A $20 per barrel decline in crude prices can meaningfully improve current account balances, reduce subsidy obligations, and ease domestic inflationary pressures in these economies simultaneously.
Regional Stakeholder Interests in Strait Stability
| Actor | Strategic Interest | Position on Strait Reopening |
|---|---|---|
| Saudi Arabia | Fiscal stability; oil revenue | Supportive; needs stable export routes |
| Iran | Sanctions relief; export recovery | Conditionally supportive |
| Oman | Regional stability; transit facilitation | Active mediator |
| Qatar | LNG security; diplomatic leverage | Engaged in governance talks |
| United States | Energy security; inflation management | Actively facilitating reopening |
| Iraq | Oil export revenue | Aligned with normalisation |
Frequently Asked Questions
What is causing oil prices to fall right now?
Oil prices on rising Middle East supply are declining primarily because of expanding supply expectations driven by the Strait of Hormuz reopening and Iran's anticipated return to global export markets under a temporary sanctions reprieve established by the initial US-Iran accord of late June 2026.
How much have oil prices fallen from their recent peak?
Brent crude has declined from a Q2 2026 average of approximately $94 per barrel to around $72.52 per barrel as of June 25, 2026, representing a fall of roughly $21 per barrel or approximately 22% from the conflict-era average.
Could oil prices rise again if the diplomatic accord breaks down?
Yes. Analysts identify a tail-risk scenario in which the 60-day negotiation window collapses, potentially pushing Brent back toward the $90 to $97 range or beyond $100 per barrel in a worst-case full Strait closure scenario. The accord's durability remains the most critical near-term price variable.
Why did historically low US crude inventory data fail to support prices?
Despite US crude stocks reaching their lowest level since 1984, traders prioritised forward-looking supply implications of the Strait of Hormuz reopening and Iran's export recovery over the domestic inventory signal. Consequently, competing macro narratives overwhelmed the traditionally bullish inventory data point.
What do analysts forecast for oil prices in Q3 2026?
Macquarie analysts forecast Brent crude to average approximately $67 per barrel and WTI to average approximately $62 per barrel in Q3 2026, representing a decline of roughly 29% from Q2 averages, assuming oil prices on rising Middle East supply continue to normalise on their current trajectory.
Disclaimer: This article contains forward-looking analysis, price forecasts, and scenario projections sourced from third-party analysts including Macquarie and Goldman Sachs. These represent analytical estimates, not guarantees of future market outcomes. Commodity prices are subject to rapid and unpredictable change. Nothing in this article constitutes financial or investment advice. Readers should conduct independent research before making any investment decisions.
Want to Stay Ahead of the Next Major Commodity Market Shift?
While oil markets reprice at speed, significant mineral discoveries on the ASX can move even faster — Discovery Alert's proprietary Discovery IQ model delivers real-time alerts the moment a major discovery is announced, turning complex data across 30+ commodities into a single, actionable insight. Explore Discovery Alert's discoveries page to see how historic ASX discoveries have generated substantial returns, and begin your 14-day free trial today to ensure you're positioned before the broader market catches on.