July 31, 2026
The oil price rally triggered by recent developments demonstrates how geopolitical tensions continue to reshape global energy markets in 2026. When the US Israel launch major attack on Iran occurred in late February, crude oil prices surged to $73 per barrel, marking the highest levels witnessed since July 2025. The global energy landscape sits at a critical juncture where technological advancement converges with geopolitical instability.
As artificial intelligence drives unprecedented electricity demand and renewable infrastructure reshapes traditional power networks, regional conflicts in strategic oil-producing territories threaten to disrupt carefully balanced supply chains. The intersection of these forces creates a complex web of vulnerabilities that extends far beyond immediate price volatility, potentially triggering structural shifts in how nations approach energy security and investment strategy.
Understanding these interconnected dynamics requires examining historical precedents while acknowledging that modern energy markets operate within fundamentally different parameters than previous decades. Today's global economy faces unique challenges where digital infrastructure dependencies amplify traditional energy security concerns, creating cascading effects that ripple through financial markets, manufacturing sectors, and consumer pricing structures.
Understanding Energy Market Volatility During Regional Conflicts
Energy markets demonstrate remarkable sensitivity to geopolitical tensions, with pricing mechanisms that incorporate both immediate supply disruption risks and forward-looking uncertainty about conflict duration and scope. Furthermore, the recent US Israel launch major attack on Iran has intensified these concerns, with current market conditions reflecting heightened sensitivity as Brent crude reached $73 per barrel as of late February 2026.
Historical Context for Oil Price Surges
Past regional conflicts provide essential context for understanding contemporary market responses. The 1973 Arab Oil Embargo demonstrated how coordinated supply restrictions could generate dramatic price increases, with crude oil rising from approximately $3 per barrel to $12 per barrel within months, representing a staggering 300-400% increase that reshaped global economic policy frameworks.
Similarly, the 1991 Gulf War illustrated market psychology during active military operations. Oil prices surged from roughly $15 per barrel in July 1990 to $40 per barrel by October 1990, showcasing how conflict expectations drive immediate price adjustments even before actual supply disruptions materialise. The Iran-Iraq War of 1980-1988 provided a different lesson, demonstrating how prolonged regional conflicts can sustain elevated pricing over extended periods, with crude reaching approximately $40 per barrel at peak levels in 1981.
Modern Market Sensitivity Factors
Contemporary energy markets operate within fundamentally different structural conditions compared to previous decades. However, several key factors continue to influence current market sensitivity:
- Strategic reserve deployment capabilities across multiple nations provide buffer mechanisms
- Alternative transportation routes offer partial supply chain redundancy
- Renewable energy adoption reduces absolute dependence on petroleum products
- Financial instrument sophistication enables more complex risk hedging strategies
Current market participants incorporate these factors into pricing models, creating more nuanced risk premiums that reflect both immediate threats and medium-term mitigation possibilities. Consequently, the integration of these elements explains why modern markets may exhibit different volatility patterns compared to historical precedents.
When big ASX news breaks, our subscribers know first
Critical Energy Infrastructure Vulnerability Assessment
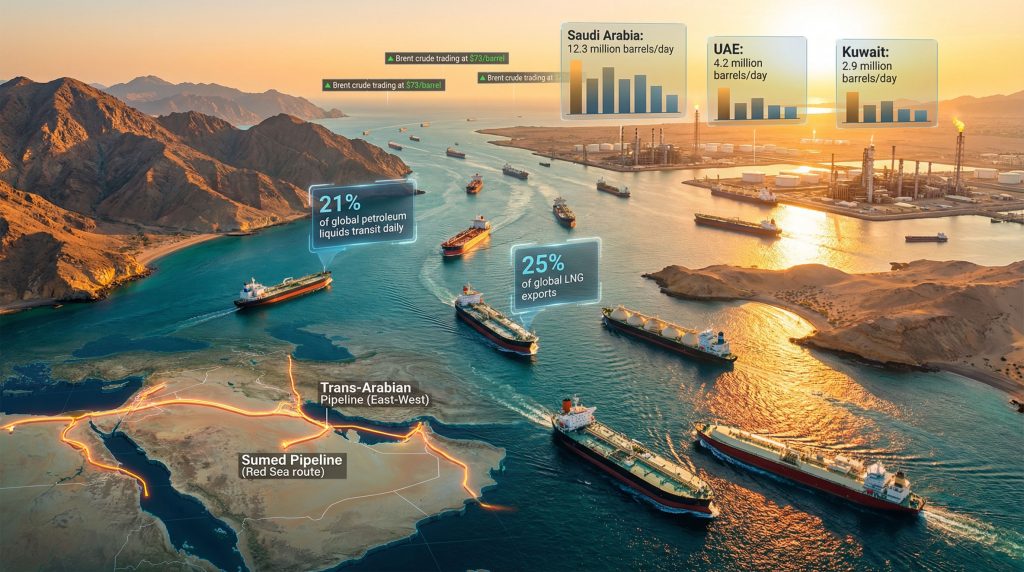
The Strait of Hormuz represents perhaps the most strategically significant energy chokepoint globally, with approximately 20% of global oil supply transiting through this narrow waterway according to recent industry analysis. This concentration creates acute vulnerability for global energy security, particularly given the waterway's geographic constraints and surrounding geopolitical tensions following the recent military action.
Regional production facilities face multiple layers of risk exposure. Major Gulf producers maintain substantial output capacity, with combined production reaching millions of barrels daily across Saudi Arabia, UAE, Kuwait, and other regional operators. The concentration of production infrastructure in coastal areas creates particular vulnerability to both direct military action and defensive countermeasures that could disrupt normal operations.
Regional Production Capacity Analysis
Current production capabilities across the region represent significant portions of global supply. In addition, Saudi Arabia exploration licenses have expanded their strategic importance in recent months:
| Producer | Daily Capacity | Strategic Importance |
|---|---|---|
| Saudi Arabia | 12.3 million barrels | OPEC+ swing producer |
| UAE | 4.2 million barrels | Regional stability anchor |
| Kuwait | 2.9 million barrels | Historical reliability |
| Qatar | 77 million tonnes LNG/year | Global LNG leadership |
Transportation Infrastructure Risks
Beyond production facilities, transportation networks face distinct vulnerability categories. Maritime shipping routes depend on narrow geographic passages that can be disrupted through various means, from direct military action to defensive naval deployments that effectively reduce throughput capacity.
Pipeline infrastructure offers alternative routing options, though with limited capacity compared to maritime transportation. The Trans-Arabian Pipeline system, Sumed Pipeline route through Egypt, and Baku-Tbilisi-Ceyhan corridor provide partial alternatives, though each operates under distinct capacity constraints and geographic limitations.
Energy Market Risk Pricing Mechanisms
Financial markets incorporate geopolitical uncertainty through sophisticated pricing mechanisms that reflect both immediate supply concerns and forward-looking scenario analysis. Current Brent crude pricing at $73 per barrel represents baseline commodity value enhanced by embedded risk premiums that market participants continuously adjust based on evolving conflict dynamics.
Risk Premium Calculation Methods
Energy traders utilise multiple analytical frameworks to quantify geopolitical risk:
- Historical volatility analysis comparing current conditions to past conflict periods
- Supply disruption probability modelling incorporating intelligence assessments and military capability analysis
- Duration scenario planning estimating potential conflict timeframes and resolution mechanisms
- Correlation analysis examining relationships between regional tensions and broader commodity movements
Research from energy policy organisations suggests that geopolitical risk premiums typically range between $5-15 per barrel during periods of elevated regional tension. However, specific premiums vary based on conflict proximity to major production areas and perceived escalation probability following events such as the US Israel launch major attack on Iran.
Forward Market Positioning
Options markets provide valuable insights into trader expectations about future price movements. Implied volatility levels, call-put spreads, and forward curve positioning reveal collective market assessment of both upside risk potential and downside correction probabilities.
Current market positioning suggests traders are prepared for significant price swings in both directions, reflecting uncertainty about conflict duration and potential diplomatic resolution mechanisms. This positioning creates additional volatility as traders adjust hedging strategies based on evolving news developments and trade war impact considerations.
Alternative Supply Route Activation Potential
Strategic petroleum reserves represent the most immediate alternative supply mechanism available during regional supply disruptions. The United States maintains approximately 350 million barrels in strategic reserves, while China's strategic reserves are estimated to exceed 500 million barrels, though exact inventory levels remain undisclosed by Chinese authorities.
Strategic Reserve Deployment Timeline
Reserve deployment follows established protocols developed after previous oil crises:
- Authorisation phase: 1-2 weeks for political decision-making and international coordination
- Physical deployment: 2-3 weeks from authorisation to market supply availability
- Market impact: Immediate psychological effects, with physical supply benefits materialising over subsequent months
International Energy Agency coordination mechanisms enable synchronised releases across multiple member countries, amplifying market impact and ensuring equitable burden-sharing during supply emergencies. Furthermore, these mechanisms have become increasingly important following recent geopolitical developments.
Pipeline Alternative Assessment
Alternative pipeline routes offer varying degrees of supply replacement capability:
Trans-Arabian Pipeline (East-West): Connects eastern Saudi production areas to Red Sea export terminals, providing partial bypass of Strait of Hormuz routing constraints. Current utilisation and spare capacity levels determine immediate activation potential.
Sumed Pipeline: Links Red Sea and Mediterranean regions through Egyptian territory, offering alternative routing for crude destined for European and North American markets. Capacity constraints limit total throughput compared to maritime alternatives.
Baku-Tbilisi-Ceyhan (BTC): Provides Caspian region crude access to Mediterranean export terminals, though geographic distance from Gulf production areas limits direct supply replacement capability.
Energy Import Dependency Risk Analysis
Nations with high petroleum import dependency face disproportionate vulnerability during Middle East supply disruptions. Analysis of import dependency patterns reveals varying degrees of exposure across major consuming countries:
| Country | Import Dependency | Primary Suppliers | Vulnerability Level |
|---|---|---|---|
| Japan | 99.7% | Saudi Arabia, UAE | Critical exposure |
| South Korea | 95.8% | Saudi Arabia, Kuwait | High vulnerability |
| India | 87.2% | Iraq, Saudi Arabia | Significant risk |
| China | 73.5% | Saudi Arabia, Russia | Moderate exposure |
Manufacturing Sector Implications
High import dependency translates into manufacturing competitiveness challenges during supply disruptions. Energy-intensive industries face particular vulnerability:
- Petrochemical manufacturing experiences direct feedstock cost impacts
- Steel production confronts elevated energy input costs
- Automotive manufacturing faces both direct energy costs and supply chain disruptions
- Chemical processing encounters raw material availability constraints
Countries with limited strategic reserves and restricted alternative supply access face the most acute vulnerability during extended supply disruptions. Consequently, the US Israel launch major attack on Iran has highlighted these structural vulnerabilities across multiple sectors.
OPEC+ Production Response Strategies
OPEC+ maintains significant spare production capacity that could potentially offset regional supply disruptions. Saudi Arabia operates approximately 2.5 million barrels per day of spare capacity, while UAE maintains additional capacity of roughly 1.2 million barrels daily. Combined OPEC+ emergency reserves total an estimated 4.8 million barrels per day, though full deployment requires technical preparation and political consensus.
Recent developments indicate OPEC+ flexibility in responding to market conditions. Prior to current regional tensions, OPEC+ ministers were considering modest supply increases for April production quotas. However, military escalation introduces significant uncertainty into production policy calculations, potentially altering the organisation's supply strategy through OPEC production impact considerations.
Production Deployment Considerations
Activating spare production capacity involves multiple practical considerations:
- Technical preparation: Bringing offline capacity to full production requires 2-4 weeks
- Quality specifications: Spare capacity crude may differ from regular production streams
- Transportation logistics: Additional production requires available shipping and pipeline capacity
- Market coordination: Large volume increases need careful timing to avoid excessive price volatility
Non-OPEC Producer Coordination
Non-OPEC producers possess limited spare capacity compared to OPEC+ members, though several nations could contribute to emergency supply responses:
- United States: Shale production can respond relatively quickly to price signals, though infrastructure constraints limit immediate impact
- Brazil: Offshore production platforms operate near capacity with limited short-term expansion potential
- Canada: Oil sands operations require extended lead times for production increases
The next major ASX story will hit our subscribers first
Long-Term Energy Transition Implications
Regional energy supply disruptions often accelerate policy initiatives toward supply diversification and renewable energy deployment. Historical precedents suggest that acute energy security concerns drive both governmental policy changes and private sector investment reallocation toward alternative energy sources, including renewable energy solutions for mining operations and other sectors.
Renewable Investment Acceleration
Energy security concerns create powerful political momentum for renewable energy expansion:
- Grid resilience infrastructure receives increased funding priority
- Strategic mineral supply chains face enhanced security scrutiny
- Energy storage deployment accelerates to manage renewable intermittency
- Transmission network expansion enables geographic load balancing
These policy shifts often outlast the immediate crises that trigger them, creating structural changes in energy investment patterns and technology deployment timelines. For instance, US officials and their Israeli counterparts have reportedly launched a coordinated military campaign, which underscores the need for energy independence strategies.
LNG Market Restructuring
Liquefied natural gas markets demonstrate particular sensitivity to regional supply disruptions, given the concentrated nature of LNG export infrastructure in conflict-prone regions. European energy security concerns drive accelerated efforts to diversify LNG supply sources and reduce dependency on Middle Eastern exports.
Long-term contracting patterns may shift toward suppliers in more stable geographic regions, potentially including North American producers, Australian exporters, and emerging African LNG projects. These structural shifts create lasting changes in global energy trade patterns that extend beyond immediate crisis resolution.
Financial Market Early Warning Systems
Energy commodity futures markets provide sophisticated early warning mechanisms for supply disruption risks. Forward curve analysis, volatility patterns, and cross-commodity correlations offer insights into trader expectations about future supply conditions.
Commodity Market Indicators
Several key indicators provide early signals of escalating energy security concerns:
- Forward curve backwardation: When near-term prices exceed longer-term contracts, indicating immediate supply tightness
- Volatility surface patterns: Options pricing reveals expected price movement ranges over various timeframes
- Crack spread movements: Refining margins indicate downstream supply chain stress
- Cross-commodity correlations: Relationships between crude oil, natural gas, and refined products signal broad-based supply concerns
Currency and Bond Market Reactions
Energy supply disruptions create predictable patterns in broader financial markets:
Oil-exporting nations typically experience currency strengthening as energy export revenues increase, improving current account balances and foreign exchange reserves.
Import-dependent economies face currency pressure as higher energy import costs strain current accounts, while government bond yields may increase due to inflation concerns and fiscal impact from energy subsidies.
Safe-haven asset flows toward gold, US Treasuries, and other traditional hedges against geopolitical uncertainty provide additional confirmation of market stress levels. Furthermore, intelligence sources indicate that major combat operations may continue to influence these market dynamics.
Strategic Energy Alliance Realignments
Regional energy supply disruptions often catalyse strategic partnership realignments as nations seek to diversify supply sources and reduce vulnerability to single-region concentration risks. These partnerships extend beyond immediate crisis response to create lasting changes in global energy trade relationships.
Infrastructure Investment Priorities
Energy security concerns drive infrastructure investment toward supply chain redundancy:
- Pipeline route diversification reduces dependence on single transportation corridors
- LNG terminal expansion enables flexible sourcing from multiple suppliers
- Strategic storage facility development provides domestic supply buffers
- Interconnection infrastructure enables mutual support during regional disruptions
These investments require multi-year development timelines but create lasting improvements in energy security resilience.
Partnership Framework Evolution
Traditional energy partnerships face reassessment during supply crisis periods. Nations may accelerate negotiations with alternative suppliers, modify long-term contract terms to include force majeure provisions, or develop mutual support agreements for emergency supply sharing.
Regional cooperation frameworks often emerge from crisis periods, creating institutional mechanisms for coordinated response to future supply disruptions.
Economic Scenario Investment Implications
Energy supply disruptions create differentiated investment scenarios across sectors and geographic regions. Understanding these implications enables more effective portfolio positioning during periods of elevated geopolitical risk.
Inflation Impact Modelling
Energy cost increases transmit through economic systems via multiple channels:
- Direct consumer impact: Transportation fuel and heating costs affect household budgets
- Industrial production costs: Manufacturing input expenses increase across energy-intensive sectors
- Services sector effects: Transportation and logistics cost increases affect service delivery pricing
- Secondary effects: Wage negotiations and pricing power shifts create sustained inflation pressure
Central banks face complex policy decisions when energy-driven inflation conflicts with economic growth objectives, potentially creating extended periods of elevated inflation expectations.
Sector-Specific Investment Analysis
Different economic sectors exhibit varying sensitivity to energy supply disruptions:
Energy companies typically benefit from higher commodity prices, though those with production exposure in conflict zones face operational risks that may offset pricing benefits.
Transportation sectors confront direct cost increases from fuel price rises, with airlines, trucking companies, and shipping operators facing margin compression unless they can pass costs to customers.
Manufacturing competitiveness shifts based on energy intensity and geographic location, with energy-efficient operations gaining competitive advantages over higher-consumption alternatives.
Consumer discretionary spending patterns change as energy costs consume larger portions of household budgets, affecting retail, hospitality, and entertainment sectors.
Investment strategies during energy supply disruption periods require careful analysis of these sector-specific dynamics, combined with assessment of potential conflict duration and resolution mechanisms. Successful portfolio positioning often involves balancing direct energy sector exposure with defensive positions in sectors less vulnerable to energy cost volatility.
Disclaimer: This analysis incorporates forward-looking scenarios and market assessments that involve inherent uncertainty. Energy market conditions, geopolitical developments, and economic impacts can change rapidly based on evolving circumstances. Investment decisions should consider multiple risk factors and professional guidance appropriate to individual circumstances.
Looking to Capitalise on Energy Market Volatility?
Discovery Alert's proprietary Discovery IQ model delivers real-time alerts on significant ASX mineral discoveries, including critical energy transition commodities that surge during geopolitical tensions. Discover why historic mineral discoveries can generate substantial returns during market uncertainty by exploring Discovery Alert's dedicated discoveries page, and begin your 14-day free trial today to position yourself ahead of volatile energy markets.