
August 11, 2026
When Chokepoints Become Catalysts: The Physics of Oil Price Shock
Every energy crisis in modern history has shared a common denominator: a physical bottleneck where the volume of supply attempting to pass through a geographic constraint exceeds the system's tolerance for disruption. The 1973 Arab oil embargo, the 1979 Iranian Revolution, the 1990 Gulf War, and the 2011 Libyan civil war all demonstrated that even partial supply interruptions at strategic nodes can trigger price dislocations that take years to fully unwind. Today, the world is watching that same mechanism activate in real time, and the question of whether Brent could hit $100 as the Hormuz crisis flares again is no longer a fringe scenario entertained by geopolitical risk boutiques. It is a live pricing question sitting inside the models of every major institutional energy desk.
Understanding why requires looking beyond the daily price ticker and examining the structural architecture of global oil supply, where a single 33-kilometre navigable corridor serves as the load-bearing wall of the entire edifice. The oil price shock this represents is reshaping how producers, traders, and governments are approaching energy security planning.
When big ASX news breaks, our subscribers know first
The Hormuz Geometry: Why Narrowness Equals Leverage
The Physical Dimensions of Maximum Systemic Risk
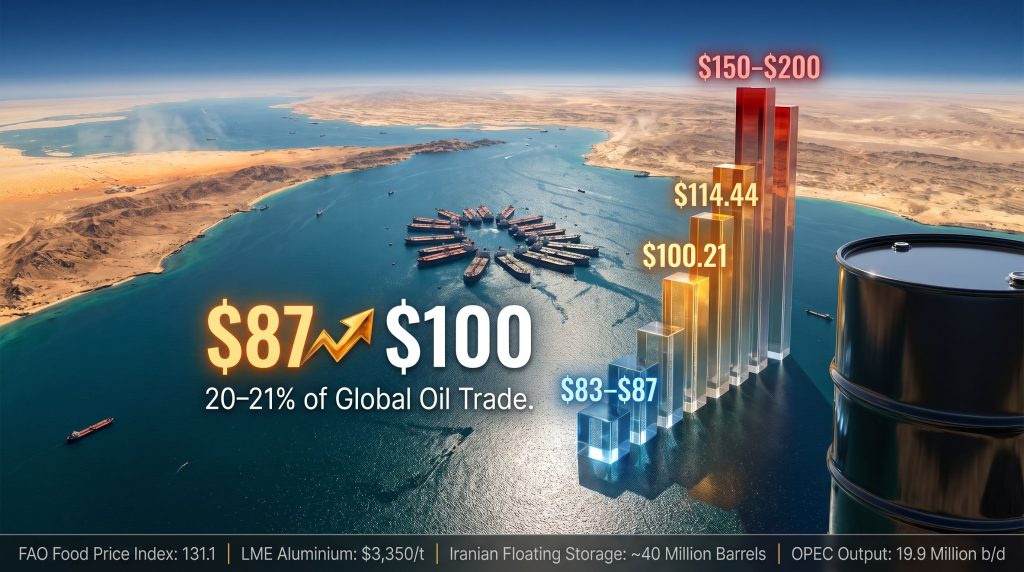
The Strait of Hormuz's strategic significance cannot be overstated. Approximately 20 to 21 percent of all globally traded oil passes through this corridor every single day, a volume so large that no alternative routing infrastructure exists at the scale needed to absorb a complete closure. The strait's navigable channel, constrained to roughly 33 kilometres at its narrowest functional point, operates with two-mile-wide inbound and outbound shipping lanes separated by a two-mile buffer zone. This geometry means that even a credible threat of interdiction, rather than an actual blockade, is sufficient to trigger insurance premium surges, vessel rerouting decisions, and forward curve repricing.
Unlike the Suez Canal, which has established workarounds via the SUMED pipeline and Cape of Good Hope routing, or the Bab el-Mandeb Strait, which at least offers partial overland alternatives through East Africa, Hormuz lacks any bypass capable of handling the full volume of Persian Gulf exports. Saudi Arabia's East-West Pipeline can move crude to the Red Sea terminal at Yanbu, but its capacity is insufficient to absorb total Gulf export volumes during a prolonged closure. This is the physical constraint that transforms every escalation in the region from a geopolitical news event into a direct supply-side pricing mechanism.
Translating Disruption Into Dollars Per Barrel
Goldman Sachs modelling suggests that a complete one-month closure of the Hormuz Strait would add approximately $15 per barrel to Brent prices in the absence of coordinated strategic petroleum reserve releases or meaningful spare pipeline capacity activation. That single figure, placed against Brent's August 2026 trading range of $83 to $87 per barrel, reveals exactly how close the market already sits to the psychologically and technically significant $100 threshold.
This crisis has already demonstrated the price trajectory. Brent breached $100.21 per barrel in mid-March before surging further to $114.44 in early May as regional hostilities intensified. Furthermore, tail-risk modelling from energy research firms has extended that range significantly further, with extreme-case scenarios projecting $150 to $200 per barrel in the event of a multi-month, unresolved closure accompanied by broader military escalation. These are low-probability scenarios, but the fact that institutional risk frameworks are stress-testing them represents a meaningful shift in how the market is pricing optionality.
Analysts tracking the trade and geopolitics dimension of this crisis note that the price signal is being amplified by simultaneous diplomatic breakdown across multiple fronts, making near-term resolution considerably harder to model.
"The $100 threshold for Brent functions less as a ceiling and more as a pressure gauge. Whether it is breached depends almost entirely on the physical duration of supply withdrawal and the speed at which compensating mechanisms can be deployed, not on sentiment or rhetoric alone."
Iran's Export Collapse: Quantifying the Supply Vacuum
Kharg Island Goes Dark
The most concrete evidence that the Hormuz crisis has moved beyond geopolitical posturing into physical market disruption is the complete cessation of loading activity at Iran's Kharg Island terminal, the country's primary crude export hub responsible for the overwhelming majority of Iranian seaborne oil sales. According to vessel-tracking data compiled by Kpler, during the first ten days of August 2026, not a single Very Large Crude Carrier was recorded loading at Kharg Island. That represents a near-total halt to Iranian export operations.
The downstream consequence of this loading freeze is equally significant. Iranian crude held in floating storage has accumulated to approximately 40 million barrels, a figure that represents roughly double the volume observed in early July when Hormuz navigation remained largely functional. This floating storage build is a critical market signal: it indicates that Iranian production continues but has nowhere to go, creating a structural overhang that will only dissolve when either exports resume or storage capacity is exhausted.
Paradoxically, this supply withdrawal is already providing price support, with Brent recovering from a mid-July trough back toward $87 per barrel by mid-August. The market is effectively pricing the probability of escalation into the forward curve, which is itself a form of self-fulfilling tightening. According to reporting from The Guardian, the stalled US-Iran peace talks remain the single most critical variable in whether prices stabilise or push higher through the remainder of the year.
The Six-Condition Impasse and Its Diplomatic Calculus
Tehran's position is unambiguous: the strait will remain inaccessible until Washington satisfies a set of six sweeping geopolitical demands that analysts across the board characterise as structurally incompatible with the current US negotiating posture. The situation was further complicated when President Trump publicly demanded that Iran provide financial compensation for casualties across decades of conflict-related incidents, a condition that effectively paralysed the parallel Iran-Oman diplomatic channel that had previously represented the most credible near-term pathway to de-escalation.
The practical consequence of this deadlock is visible in transit data. Hormuz vessel traffic collapsed to just six vessels on a single Monday in August, a figure so far below pre-crisis norms that it signals the strait has effectively ceased functioning as a global energy corridor for practical purposes. The gap between that number and the hundreds of transits typically recorded weekly represents a physical supply deficit that no amount of diplomatic signalling can mask.
The Attack Landscape: Incidents Reshaping Maritime Risk Pricing
The maritime threat environment surrounding the Hormuz corridor has expanded well beyond the strait itself, creating what risk analysts describe as a layered threat architecture that extends from the Red Sea through the Gulf of Oman.
| Incident | Location | Consequence |
|---|---|---|
| Suspected Houthi attack on Egyptian cargo vessel | Bab el-Mandeb Strait | Three sailors killed |
| US helicopter missile strike on Vela Nova container ship | Gulf of Oman | Pakistani-flagged vessel struck amid escalating naval operations |
| Houthi missile attack on Aramco's Jazan refinery | Saudi Arabia | 400,000 b/d facility shut down through September |
| ADNOC reports 15 vessel attacks | Hormuz corridor | Accelerated fleet expansion and tender activity in response |
Bank of America analysts have stated that the Hormuz corridor currently requires ten times the number of vessels presently operating to stabilise oil market flows, a logistical deficit so large that it cannot be bridged through commercial shipping markets in any timeframe relevant to near-term supply security.
A detail that receives insufficient attention in mainstream coverage is the significance of the Jazan refinery attack specifically. At 400,000 barrels per day of capacity, Jazan represents a meaningful fraction of Saudi Arabia's domestic refining infrastructure. Its shutdown through September removes a key buffer from the regional supply system at precisely the moment when global refinery utilisation is already constrained by the broader crisis environment. The trade war oil impact on refinery margins is compounding these pressures, creating a particularly difficult operating environment for processors outside the Gulf region.
OPEC Output and China's Restocking: A Bilateral Price Pressure Dynamic
OPEC's Partial Recovery Falls Short of the Gap
OPEC collective production rose by 1.17 million barrels per day in the most recent reporting period, reaching 19.9 million b/d, a recovery from the multi-decade production low recorded in May. Output gains were concentrated in Iraq and Kuwait, with Gulf producers managing only partial restoration of pre-crisis capacity levels. Despite the headline increase, production continues to trail formal quota targets, meaning the theoretical spare capacity that might offset Hormuz-related shortfalls is considerably smaller in practice than it appears on paper.
This is a subtle but critical distinction for market pricing. OPEC's market influence is being tested at a structural level: spare capacity that exists on a quota allocation spreadsheet but cannot be physically moved through an effectively closed strait provides no real-world supply relief. The buffer is constrained not by production capability but by export routing, which transforms the OPEC recovery story from a bearish supply signal into something considerably more ambiguous.
China's Shandong Drawdown: The Demand Accelerant
Crude oil inventories held by independent refiners in Shandong province, the operational heart of China's so-called teapot refinery sector, fell by a record 35 million barrels in July 2026, equivalent to a sustained draw rate of 1.1 million barrels per day. This inventory depletion, driven in part by improving Chinese refined product export conditions, has pushed teapot refinery utilisation rates down to approximately 50% following multi-year highs seen in June and July.
The restocking imperative this creates is straightforward: refiners running at half capacity with depleted feedstock inventories must purchase replacement crude in volume. The most likely beneficiaries are Iranian and Russian barrels, given their price competitiveness relative to alternatives, which creates a feedback loop where Chinese restocking demand partially sustains the very supply chains most disrupted by the Hormuz crisis.
"The convergence of collapsing Iranian export supply with surging Chinese restocking demand creates a bilateral price pressure mechanism that tightens the physical market from both the supply and demand side simultaneously, a dynamic that amplifies rather than offsets the directional price signal."
The UAE's Infrastructure Response: Engineering a Hormuz Bypass
ADNOC's response to the crisis represents one of the most significant single-entity infrastructure commitments in the global oil market's recent history. The Abu Dhabi national oil company has committed $1.3 billion to acquire six VLCCs and five Very Large Gas Carriers on the secondary tanker market, expanding its fleet specifically to maintain export continuity through a disrupted transit environment.
Simultaneously, ADNOC is evaluating a multibillion-dollar 9.6 million tonne per annum LNG export terminal at Fujairah on the UAE's east coast, connected to western gas fields via pipeline and designed entirely around the assumption that Hormuz cannot be relied upon as a permanent export corridor. This is a strategic infrastructure commitment, not a tactical response. Building a Fujairah LNG terminal requires years of construction and regulatory work, which means ADNOC's leadership has concluded that Hormuz transit risk is now a structural feature of the UAE's export environment, not a temporary disruption.
ADNOC's issuance of its eighth spot crude tender since June further underlines the urgency of maintaining market presence despite operational constraints. For context, a typical quarter might see two or three such tenders. Eight in roughly ten weeks signals an organisation operating in crisis-response mode.
The next major ASX story will hit our subscribers first
Scenario Framework: Four Pathways for Brent Through the Crisis
| Scenario | Key Conditions | Brent Price Range | Assessment |
|---|---|---|---|
| Bear Case | Diplomatic breakthrough, partial strait reopening, coordinated strategic reserve releases | $75 to $85/bbl | Low-moderate probability given current negotiating deadlock |
| Base Case | Prolonged partial disruption, OPEC partial offset, Chinese restocking provides demand floor | $85 to $95/bbl | Most likely near-term trajectory |
| Bull Case | Full Hormuz closure sustained, Iranian loadings remain near zero, Houthi attacks expand | $100 to $115/bbl | Elevated probability if current trajectory continues |
| Extreme Tail | Multi-month closure, military escalation, no meaningful alternative routing activated | $150 to $200/bbl | Low probability but materially non-zero consequence scenario |
The bear case requires a diplomatic breakthrough that shows no credible signs of materialising. The extreme tail remains a low-probability scenario but has graduated from theoretical stress test to legitimate institutional risk planning consideration. The base case and bull case are where probability mass is currently concentrated, with the dividing line between them resting almost entirely on whether Iranian loadings remain near zero for a sustained period of four to six weeks or longer. Indeed, an oil price rally of the magnitude implied by the bull case would represent one of the most significant supply-driven price events in more than a decade.
Cascading Consequences: Food, Metals, and European Energy
Food Security Under Compounding Pressure
The FAO global food price index reached 131.1 points in July 2026, its highest reading since January 2023, as Black Sea shipping disruptions and crop heat damage combined with elevated crude costs to push wheat prices 6% higher month-on-month. The mechanism connecting crude oil prices to food costs operates through multiple channels: fertiliser production costs (which are heavily energy-dependent), agricultural transportation costs, and food processing energy inputs. A sustained move above $100 in Brent would amplify each of these transmission channels simultaneously.
Aluminium as an Industrial Barometer
LME aluminium prices climbed for seven consecutive trading sessions to reach a seven-week high of $3,350 per tonne, driven by shrinking warehouse inventories and repeated supply disruptions affecting Middle Eastern production. Middle East aluminium smelting represents approximately 9% of global output, making regional energy disruptions a direct input into global metals pricing. Aluminium's sensitivity to energy costs, given that power accounts for roughly 40% of primary aluminium production costs, makes it a useful real-time proxy for the broader industrial consequences of sustained crude price elevation. Analysts at OilPrice.com warn that if supply disruptions persist beyond the near term, elevated crude prices could become structurally embedded rather than cyclical.
Europe's Compounding Infrastructure Stress
The River Rhine, one of Europe's most critical refined product distribution arteries, experienced a complete halt in barge traffic after water levels at the Kaub chokepoint fell to a record-low 17 centimetres, with projections suggesting levels could reach just 4 centimetres by mid-August. Separately, France's EDF was compelled to shut three nuclear reactors totalling 2.7 gigawatts of capacity at its Gravelines plant following a jellyfish swarm, compounding pre-existing heat-related output restrictions across the French nuclear fleet. These simultaneous infrastructure failures are tightening European energy balances at precisely the moment when global crude supply is most constrained.
Capital Reallocation: Where Upstream Investment Is Flowing
The strategic investment response to Hormuz-driven supply uncertainty is already visible in capital allocation decisions across the global energy sector. Several transactions and project approvals in recent weeks share a common characteristic: geographic diversification away from Hormuz-dependent supply chains.
-
Phillips 66, Kinder Morgan, and HF Sinclair have jointly approved the $5 billion Western Gateway pipeline system, a refined products conduit connecting St. Louis, Missouri to California markets, reflecting domestic infrastructure investment accelerating in response to import vulnerability.
-
BP has agreed to acquire a 70% interest in the Calypso deepwater project in Trinidad and Tobago from Woodside Energy, gaining full ownership of a 3.5 trillion cubic foot gas asset positioned entirely outside the Hormuz risk zone.
-
ENI has entered a strategic partnership with APA Corporation on Block 6 offshore Uruguay, funding the majority of exploration activity planned for 2027 as European majors diversify their upstream exposure geographically.
-
Maurel et Prom, majority-owned by Indonesia's Pertamina, has agreed to acquire Gran Tierra Energy's entire South American portfolio for $1.33 billion, with the primary assets located in Colombia and Ecuador.
The pattern across these commitments is unmistakable: capital is flowing toward assets with no Hormuz exposure. This structural shift in upstream investment strategy will take years to fully manifest in production volumes, but it signals a fundamental and potentially durable repricing of geopolitical risk premium in global energy markets.
Key Indicators to Monitor
For investors and market participants tracking whether Brent could hit $100 as the Hormuz crisis flares again, the following metrics provide the earliest available signal of directional change:
-
Weekly Hormuz vessel transit counts — the current baseline of six vessels on the most recent Monday provides the clearest real-time measure of physical disruption severity.
-
Iranian floating storage volumes — currently approximately 40 million barrels, double early July levels. Any acceleration suggests the loading freeze is deepening.
-
Shandong province independent refinery run rates and inventory levels — the primary leading indicator for Chinese crude purchasing activity and Iranian barrel demand.
-
OPEC spare capacity utilisation and quota compliance — determines how much production buffer actually exists versus what exists on paper.
-
FAO food price index monthly readings — tracks the second-order inflationary consequences of sustained crude price elevation.
-
LME aluminium prices — functions as a real-time proxy for Middle East industrial supply disruption and energy cost transmission into metals markets.
-
Iran-Oman diplomatic track activity — the last credible near-term de-escalation pathway. Any breakdown removes the primary bear-case mechanism.
Disclaimer: This article is intended for informational and educational purposes only. It does not constitute financial, investment, or trading advice. All price scenarios, projections, and analytical frameworks referenced involve significant uncertainty and should not be relied upon as forecasts or recommendations. Past price behaviour during prior crises does not guarantee similar outcomes in the current environment. Readers should conduct independent research and consult qualified financial advisers before making investment decisions.
Want to Stay Ahead of the Next Major Energy or Commodity Discovery?
While geopolitical shocks reshape global energy markets, Discovery Alert's proprietary Discovery IQ model scans ASX announcements in real time, instantly identifying significant mineral discoveries across more than 30 commodities and delivering actionable alerts before the broader market reacts — explore historic discovery returns on Discovery Alert's discoveries page to understand the scale of opportunity, and begin your 14-day free trial today to position yourself ahead of the next major market-moving event.