
June 11, 2026
The Hidden Architecture of an Oil Price Shock
Energy markets have a peculiar relationship with fear. Unlike equity markets, where panic selling can be partially absorbed by liquidity mechanisms and circuit breakers, crude oil operates within a physical supply chain that cannot be paused, rerouted, or digitally replaced. When a critical node in that chain comes under threat, the pricing response is not just financial speculation. It reflects the real-world impossibility of moving twenty million barrels of crude per day through an alternative corridor that does not yet exist at the required scale.
That physical reality sits at the core of why analysts at Oslo-based energy research firm Rystad Energy have assessed that oil may rise to $150 a barrel if US-Iran hostilities resume in a sustained and escalatory form. Furthermore, understanding how that number is reached, what stands in the way of it, and what it would mean for the global economy requires moving beyond headline figures and into the structural mechanics of the world's most consequential energy chokepoint.
When big ASX news breaks, our subscribers know first
Understanding the Gap Between Today's Prices and Extreme Upside
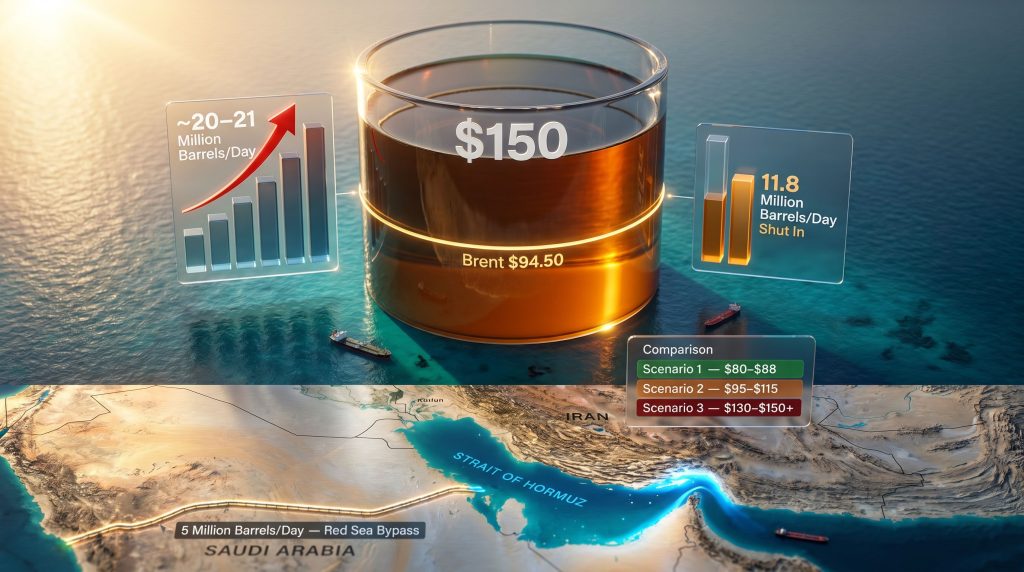
As of the latest available trading data, Brent and WTI futures have been oscillating near $93 to $94.50 per barrel, with an intraday spike toward the upper bound reflecting the initial market reaction to renewed US-Iran tension. WTI has tracked close by at approximately $93.64 per barrel. A move to $150 would represent a price increase of roughly 58% from current levels, which is not a marginal adjustment. It is a regime shift.
For that regime shift to occur, analysts broadly agree that several conditions would need to materialise simultaneously rather than sequentially:
- Physical disruption to Strait of Hormuz shipping that persists beyond 30 days
- Collapse of diplomatic back-channels with no credible re-engagement pathway
- Exhaustion of emergency supply buffers, including US Strategic Petroleum Reserve releases
- Demand resilience from major importing economies preventing natural demand destruction from absorbing the price shock
None of these conditions is individually sufficient. The $150 scenario is a convergence event, not a single-trigger outcome. This distinction matters enormously for how risk is priced in derivatives markets and how institutional energy desks model forward exposure.
How the Geopolitical Risk Premium Actually Functions
The Pricing Mechanics Traders Use
A geopolitical risk premium in crude oil is not a static add-on. It is a probabilistically weighted assessment of disruption severity multiplied by disruption duration. Traders and institutional desks update this calculation continuously based on observable signals: diplomatic statements, satellite imagery of vessel movement, military posture changes, and back-channel intelligence assessments.
The factors shaping these assessments are deeply intertwined with trade and geopolitics, which have consistently proven to be the most volatile inputs in any crude pricing model. The Brent price movement from approximately $93 to $94.50 and back again illustrates this dynamic precisely. The spike reflects an immediate repricing of disruption probability, whilst the retreat reflects market participants assigning meaningful weight to diplomatic containment.
The April Ceasefire and Why Its Fragility Was Always Predictable
The ceasefire reached in April 2026 was constructed without the verifiable enforcement mechanisms that characterise durable diplomatic agreements. There were no third-party monitoring frameworks, no staged confidence-building measures with defined consequences for breach, and no multilateral architecture binding both parties to compliance.
Rystad Energy's geopolitical analysis noted that the probability of a near-term diplomatic deal had narrowed significantly from an earlier assessment of approximately 40% to materially lower levels following the most recent escalation. According to CNBC's reporting on the Hormuz situation, this shift in probability distribution has direct consequences for how forward crude exposure is hedged and how refinery procurement teams plan feedstock purchasing.
The coming days are considered critical in determining whether diplomacy can regain momentum or whether the crisis enters a phase of prolonged escalation with no defined ceiling.
The Strait of Hormuz: One Waterway, Global Consequences
Why This Chokepoint Has No Equivalent
The Strait of Hormuz is approximately 33 kilometres wide at its narrowest navigable point, yet through it flows roughly 20 to 21 million barrels of crude oil per day, representing approximately one-fifth of all globally traded seaborne oil. No other chokepoint comes close to this combination of volume and irreplaceability.
| Metric | Data Point |
|---|---|
| Daily crude throughput | ~20-21 million barrels per day |
| Share of global seaborne oil trade | ~20-21% |
| Gulf production currently shut in (six producers) | Up to 11.8 million barrels per day |
| Saudi Yanbu bypass route capacity | ~5 million barrels per day |
| Yanbu coverage of Hormuz throughput | ~25% |
The figures above reveal the fundamental asymmetry at the heart of any Hormuz disruption scenario. Even if Saudi Arabia's East-West Pipeline and Yanbu Red Sea terminal operates at full capacity, it can reroute only approximately one-quarter of the crude that would be displaced by a Hormuz closure. The remaining three-quarters has no pre-existing bypass infrastructure capable of absorbing it.
Scenario Modelling: Partial vs Extended Disruption
Scenario A: Partial Disruption (30 to 60 days)
- War risk insurance premiums for tanker passage surge, pricing smaller operators out of Gulf routes
- Brent crude likely trades in the $110 to $130 per barrel range
- Coordinated SPR releases from the US and IEA member nations provide partial supply offset
- Inflation re-accelerates in Asia-Pacific, where energy import dependency is highest
Scenario B: Extended Closure (90+ days)
- Physical supply deficit exceeds the capacity of any single buffer mechanism to address
- Brent crude trajectory toward $150 per barrel becomes highly attainable, according to Rystad Energy's assessment
- Demand destruction begins emerging in price-sensitive emerging markets
- Refinery margins compress sharply as specific crude grades become unavailable or prohibitively expensive
One dimension of Scenario B that receives insufficient attention in mainstream analysis is the grade-specific problem. The Gulf region produces a disproportionate share of the world's medium-sour crude grades, which are the preferred feedstock for many complex refineries across Asia and Europe. These refineries cannot easily switch to light-sweet alternatives without significant processing adjustments, meaning the supply disruption creates quality mismatches as well as volume shortfalls.
Three Structural Buffers Between Current Prices and $150
What Is Actually Standing in the Way of Extreme Price Escalation
The path to $150 oil is not frictionless. Several mechanisms currently act as partial circuit breakers, each with meaningful capacity and meaningful limitations.
1. US Strategic Petroleum Reserve Releases
The United States has demonstrated both the willingness and institutional capacity to deploy SPR crude at record volumes. These releases have actively supported US crude export flows and provided a tangible supply buffer during periods of geopolitical stress.
The critical limitation is straightforward: the SPR is a finite stockpile. Repeated large-scale drawdowns not only deplete the reserve's immediate crisis-response capacity but also reduce the strategic credibility of future release announcements. Markets have learned to discount SPR release signals when the reserve is already drawn down, reducing their price-suppression effectiveness over time.
2. Reduced Chinese Crude Import Demand
China's appetite for crude imports has moderated in recent periods, reflecting a combination of domestic economic softness, elevated strategic inventory levels from prior aggressive purchasing cycles, and a measured shift in refinery utilisation rates. This structurally reduces the volume of crude that must transit Hormuz, providing a partial natural offset.
The risk embedded in this buffer, however, is its reversibility. Any Chinese economic stimulus programme or accelerated industrial recovery could rapidly increase import demand, removing a key cushion at precisely the moment geopolitical tension is creating supply constraints. The combination of demand recovery and supply disruption would be particularly destabilising.
3. Saudi Arabia's Yanbu Export Terminal
Approximately 5 million barrels per day of Saudi crude currently transits the East-West Pipeline overland to the Yanbu terminal on the Red Sea coast, entirely bypassing the Strait of Hormuz. This infrastructure represents the most tangible structural hedge against a full closure scenario.
Its limitation is scale. At 5 million bpd, Yanbu covers roughly 25% of Hormuz's daily throughput. Even if this route were expanded or operated above nameplate capacity in an emergency, the residual gap remains enormous. It is a meaningful partial solution, not a systemic substitute.
What $150 Oil Would Mean Across the Global Economy
The Cascade of Transmission Channels
A sustained oil price at $150 per barrel would not remain contained within energy markets. Its effects would transmit through multiple economic systems simultaneously, creating compounding pressures that central banks and fiscal authorities would struggle to address in isolation.
| Impact Channel | Expected Effect |
|---|---|
| Transport and Logistics | Freight costs surge, supply chain inflation re-accelerates |
| Consumer Fuel Prices | Petrol and diesel hit record highs across most OECD economies |
| Central Bank Policy | Renewed inflation complicates or reverses rate-cutting cycles |
| Emerging Market Currencies | Oil importers face currency depreciation and current account deterioration |
| Aviation and Shipping | Margin compression, potential capacity withdrawal |
| Agricultural Commodities | Fertiliser and transport costs drive food price inflation |
| Sovereign Debt Dynamics | Import-dependent economies face fiscal deterioration |
A sustained $150 oil price, superimposed on already-elevated global debt levels and fragile post-pandemic fiscal positions, carries genuine recessionary risk for energy-import-dependent economies across South and Southeast Asia.
The agricultural channel deserves particular emphasis. Natural gas prices, which largely determine ammonia and fertiliser production costs, typically track crude oil with a lag. A sustained crude price spike would filter through into global food prices within two to three crop cycles, adding a humanitarian dimension to the economic disruption.
The next major ASX story will hit our subscribers first
Historical Precedents: What Past Extremes Reveal
When Crude Has Approached or Exceeded the $150 Threshold
| Event | Year | Peak Brent Price | Primary Driver |
|---|---|---|---|
| Global commodity supercycle peak | 2008 | ~$147/barrel | Demand surge plus speculative positioning |
| Gulf War supply shock | 1990-91 | Physical supply disruption | |
| Russia-Ukraine conflict onset | 2022 | ~$130/barrel | Supply uncertainty plus sanctions risk |
| US-Iran escalation | 2026 | ~$94.50 intraday peak | Geopolitical risk premium |
The 2008 precedent carries an instructive lesson that is frequently misunderstood. The near-$147 peak in July 2008 was primarily a demand-driven event, powered by years of Chinese industrialisation, global economic expansion, and speculative positioning in commodity futures markets. It was not principally a supply shock. The subsequent collapse to below $40 by December 2008 occurred because the global financial crisis destroyed demand faster than any supply-side intervention could have achieved.
A geopolitically-driven supply disruption in 2026 would consequently follow an entirely different causal pathway. There would be less warning time, the demand side would remain relatively robust initially, and the price response would be more violent and less predictable. The 2022 Russia-Ukraine spike to approximately $130 offers a more structurally relevant comparison, though even that event did not involve a physical closure of a critical shipping lane. Analysts monitoring oil volatility trends have consistently highlighted this distinction as essential for accurate scenario planning.
Signals Markets Are Watching in Real Time
The Observable Indicators That Will Define the Next Price Move
Market participants navigating the current uncertainty are monitoring a relatively narrow set of high-signal indicators that will collectively determine whether crude oil moves toward de-escalation pricing or further into crisis territory:
- Diplomatic channel activity including any resumption of back-channel communication between Washington and Tehran, which would likely trigger an immediate risk premium unwind
- Tanker AIS tracking data providing real-time visibility into vessel movements through the Strait of Hormuz and any pattern changes suggesting operational disruption
- OPEC+ production signalling, where OPEC's market influence remains a pivotal variable, particularly whether Gulf producers indicate willingness to increase output to offset disruption risk
- SPR release announcements from the US government, which would signal official acknowledgement of supply stress beyond what is already priced in
- Cross-market correlation patterns where equity market declines coinciding with oil price spikes confirm genuine macro risk pricing rather than isolated commodity speculation
The Volatility Regime Has Structurally Shifted
Rystad Energy expects oil price volatility to remain structurally elevated until one of two conditions becomes clearly established. First, credible de-escalation evidence through verifiable diplomatic progress that meaningfully reduces the probability of sustained physical disruption. Second, containment confirmation demonstrating that the current escalation remains bounded and does not draw in additional regional actors.
Until either condition is met, crude oil markets will operate in a heightened volatility regime. The impact on oil markets from compounding geopolitical stressors means sharp intraday movements in both directions remain probable, and the risk of a sudden overnight repricing event driven by a single news catalyst is materially higher than in normal market conditions.
Strategic Scenario Framework for the Second Half of 2026
Three Pathways and Their Implications
Scenario 1: Diplomatic Re-engagement
Probability assessed as moderate. A ceasefire holds or is formally renegotiated with more durable architecture. Brent retreats toward the $80 to $88 range as the risk premium unwinds over four to six weeks. Volatility normalises. Energy importers exhale.
Scenario 2: Prolonged Standoff Without Physical Disruption
Hostilities continue at a rhetorical and posturing level without translating into interference with physical shipping flows. Brent trades in a $95 to $115 range with persistent volatility and elevated insurance premiums. Markets remain in a state of heightened sensitivity to any escalation signal.
Scenario 3: Full Escalation with Hormuz Disruption
Physical disruption to Strait of Hormuz shipping for 60 or more consecutive days. Analysts assessing whether oil could hit $150 a barrel broadly agree that in this scenario, Brent crude trajectory toward $130 to $150 per barrel becomes the base expectation rather than a tail risk. Global macro consequences including renewed inflation, central bank policy complications, and recessionary pressure in energy-import-dependent economies would materialise in sequence. Oil may rise to $150 a barrel if US-Iran hostilities resume at scale — and this scenario represents the clearest pathway to that outcome.
Disclaimer: This article contains forward-looking assessments, scenario projections, and analyst interpretations that involve inherent uncertainty. Oil price forecasts and geopolitical scenario analyses are not guarantees of future market outcomes. Readers should not interpret any content in this article as financial or investment advice. All price data referenced reflects conditions as reported at the time of the underlying source publication.
Want to Stay Ahead of the Commodity Shifts Driving Major ASX Discoveries?
When energy price shocks ripple through global markets, the knock-on effects for mining and exploration stocks can be swift and significant. Discovery Alert's proprietary Discovery IQ model delivers real-time alerts on significant ASX mineral discoveries across 30+ commodities, ensuring subscribers can act on actionable opportunities the moment they emerge — begin your 14-day free trial today, or explore historic discovery returns to understand the magnitude of what early positioning can deliver.