
June 5, 2026
When Diplomacy Collapses Overnight: Understanding the Mechanics of an Oil Price Shock
Energy markets are rarely moved by single events in isolation. What drives crude prices into sharp, destabilising swings is the collision of pre-existing structural tensions with sudden geopolitical ruptures. When those two forces intersect, the result is not just a price movement but a fundamental repricing of risk across the entire global energy system. The events of May 28, 2026, offer a textbook illustration of exactly this dynamic, and understanding them requires looking beneath the headline numbers to the deeper architecture of supply, geography, and conflict psychology that amplifies every shock.
When big ASX news breaks, our subscribers know first
The Architecture of a Price Reversal: From Diplomatic Hope to Military Reality
To understand why oil surges after Iran targets US airbase infrastructure became the defining market story of the day, it is essential to reconstruct what markets were pricing in just 24 hours earlier. During the previous trading session, both Brent and WTI crude benchmarks shed more than 5%, touching their lowest levels in a month. The driver was not supply data or demand forecasts but something rarer and more psychologically powerful: genuine optimism that a negotiated resolution between Washington and Tehran was within reach.
Markets had been circulating speculation that a deal could reopen the Strait of Hormuz to unrestricted commercial shipping, eliminating the geopolitical oil price drivers that had been embedded in crude prices for weeks. That optimism proved short-lived.
Iran's Revolutionary Guards announced on May 28 that they had struck a US airbase in direct retaliation for what they described as an early morning American military attack near Bandar Abbas airport. According to Reuters, US military forces had conducted new strikes targeting a site assessed as posing a threat to both American forces and commercial maritime traffic in the strait. The diplomatic window, which had seemed to be opening, slammed shut within hours.
How the Numbers Moved: A Breakdown of the Crude Price Surge
The market reaction was swift and broad-based, with all major crude benchmarks registering sharp intraday gains.
| Benchmark | Price Movement | Percentage Change | Price Level |
|---|---|---|---|
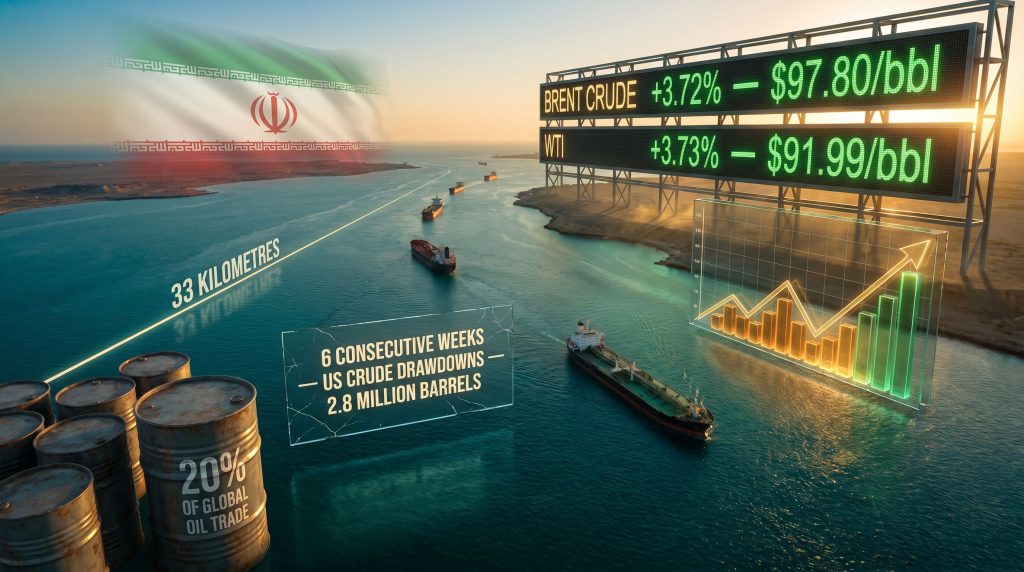
| Brent Crude (Spot) | +$3.51 | +3.72% | $97.80/barrel |
| Brent Crude (August Contract) | +$3.35 | +3.63% | $95.60/barrel |
| WTI Crude Futures | +$3.31 | +3.73% | $91.99/barrel |
The near-uniform percentage gains across both Brent and WTI are notable. When benchmarks move in lockstep at this magnitude, it signals that the market is reacting to a systemic risk event rather than a localised supply disruption. Traders were not adjusting regional arbitrage spreads; they were collectively repricing the probability of a broader supply crisis. Furthermore, tracking current crude oil prices across benchmarks reveals just how synchronised this response was.
An additional technical factor added complexity to the trading session: the July Brent contract was scheduled to expire on Friday, meaning traders were simultaneously managing position rollovers while absorbing breaking geopolitical news. Contract expiry periods are typically associated with elevated volatility, and this timing compounded the directional move.
The 24-hour price arc from this episode is remarkable by any historical standard. A market that fell more than 5% on peace hopes erased those losses entirely and added a further 3.7% gain on news of military escalation. The total swing between sessions exceeded 8-9 percentage points, underscoring how binary the market's risk calculus had become around this conflict.
The Strait of Hormuz: Why One Narrow Waterway Holds Global Energy Markets Hostage
No understanding of this event is complete without grasping the singular importance of the Strait of Hormuz to the global oil supply chain. This narrow maritime corridor, situated between the southern coast of Iran and the northern tip of Oman, is the most consequential energy chokepoint on the planet.
Key Physical and Statistical Facts
- The strait narrows to approximately 33 kilometres at its tightest navigable point
- Roughly 20% of the world's traded oil transits this corridor, making it irreplaceable in the current global energy architecture
- Major import-dependent economies including China, Japan, South Korea, and India rely disproportionately on Hormuz-routed crude
- There is no fully operational pipeline alternative capable of replacing Hormuz volumes at scale, though Saudi Arabia's East-West Pipeline offers partial relief for Saudi exports only
What makes Hormuz uniquely dangerous as a geopolitical flashpoint is its asymmetry. Iran does not need to physically close the strait to create a supply crisis. The mere credible threat of interference, whether through naval harassment, mine-laying, or missile strikes on tankers, is sufficient to trigger a dramatic increase in shipping insurance premiums, route diversions, and cargo delays. Each of these effects translates directly into tighter physical supply and higher prices at the consumer end. According to Forbes Middle East, this dynamic was central to the market's swift reaction on the day.
Historical Precedents for Hormuz-Driven Price Volatility
| Event | Approximate Oil Price Impact | Duration of Spike |
|---|---|---|
| 2019 Abqaiq-Khurais Attack (Saudi Arabia) | +~15% intraday | Partially reversed within weeks |
| 2020 US-Iran Tensions (post-Soleimani killing) | +4-5% short-term | Faded within days |
| 2022 Russia-Ukraine Invasion | Brent exceeded $130/barrel | Sustained for months |
| 2026 Iran-US Airbase Exchange | +3.72% (Brent) | Trajectory dependent on escalation |
The 2019 Abqaiq attack on Saudi Arabian oil infrastructure provides the closest structural parallel in terms of the shock mechanism, though the current episode involves active military exchange rather than a single strike on static infrastructure. The Russia-Ukraine comparison is instructive for a different reason: it demonstrates that when geopolitical disruptions are sustained rather than episodic, the price impact multiplies dramatically over time.
The Inventory Backdrop: Why a Tight Market Amplifies Every Shock
Geopolitical risk does not operate in a vacuum. Its impact on oil prices is directly modulated by the physical state of the market at the time of the shock. In May 2026, that state was already tight before the first missile was fired.
According to data from the American Petroleum Institute, US crude inventories fell by 2.8 million barrels in the most recent reporting week, marking the sixth consecutive week of drawdowns. This sustained decline in stockpiles is analytically significant for several reasons.
First, inventory drawdowns signal that consumption is consistently outpacing supply delivery, a condition that removes the natural buffer markets rely on to absorb unexpected disruptions. Second, six consecutive weeks of declines creates a directional momentum in market psychology, reinforcing bullish sentiment and making traders more sensitive to upside risk scenarios.
A further complicating factor emerged around data timing. The US Energy Information Administration's official weekly inventory report was released one day later than its standard schedule due to the Memorial Day public holiday on the preceding Monday. This delay created an information vacuum at precisely the wrong moment, forcing traders to act on API estimates, which carry less institutional weight than official EIA figures, during an acute period of geopolitical stress.
ANZ commodity strategist Daniel Hynes noted in a market brief issued on the day that oil supply remained constrained and that key structural issues between the parties involved had not been resolved. This framing positions the price surge not as a temporary anomaly but as a rational response to a market already operating with minimal slack.
Three Scenarios the Market Is Pricing In
Commodity analysts tracking this conflict have generally converged on three broad outcome pathways, each carrying distinct implications for crude pricing.
-
De-escalation and renewed diplomatic engagement: If back-channel communications between Washington and Tehran resume and produce credible progress toward a Hormuz agreement, the geopolitical risk premium embedded in current prices could unwind rapidly. In this scenario, Brent would likely retreat toward the low-to-mid $80s range as the market reprices for reduced supply disruption risk.
-
Sustained military exchange without strait closure: A protracted but contained conflict, involving continued strikes and counter-strikes without direct interference with commercial shipping lanes, would likely see Brent holding in a $90-$100 range. Uncertainty would keep a floor under prices while the absence of a physical supply disruption would cap the upside.
-
Partial or sustained Hormuz disruption: This is the tail-risk scenario that energy security planners consider most seriously. Any credible interference with tanker traffic through the strait could push Brent toward the $110-$120 range or higher, potentially triggering coordinated emergency reserve releases from member nations of the International Energy Agency.
Scenario three is often dismissed as too extreme to model for, but energy security analysts point out that even a two to three week partial closure of Hormuz would remove more daily oil volume from global markets than the entire 2022 Russian supply disruption peak.
The next major ASX story will hit our subscribers first
The Downstream Impact: Who Bears the Cost of a Hormuz Risk Premium
The consequences of sustained oil price elevation at these levels are not evenly distributed. Several categories of economic actors face disproportionate exposure.
Asian import-dependent economies are the most structurally vulnerable. China, Japan, South Korea, and India collectively import hundreds of millions of barrels annually through Hormuz, and unlike many Western nations, they have more limited domestic production capacity to buffer against price surges. For these economies, a sustained move above $100 per barrel translates directly into energy import bill increases, inflationary pressure, and potential currency strain.
Central banks in these regions face a particularly uncomfortable dynamic. Energy-driven inflation is supply-side in origin, meaning it cannot be addressed through demand suppression tools like interest rate increases without imposing additional economic costs. Policymakers would be forced to choose between tolerating inflation or tightening financial conditions in an already uncertain environment.
OPEC+ spare capacity is the wildcard in this scenario. Gulf producers, particularly Saudi Arabia, maintain varying levels of available output capacity that could theoretically offset Iranian supply disruptions. However, OPEC market influence and the willingness to rapidly increase production into an already volatile geopolitical situation involves complex political calculations that extend well beyond simple economics.
What to Watch: Real-Time Signals for Market Direction
For investors and market observers tracking how this situation develops, several indicators offer forward-looking insight into where oil prices are headed.
- Official EIA inventory data: The deviation between the delayed EIA report and the API estimate will provide a cleaner read on the physical supply balance heading into the crisis period
- Persian Gulf shipping insurance rates: War risk premiums on tanker insurance are one of the most sensitive real-time indicators of perceived threat levels in the strait, often moving faster than crude futures themselves
- Diplomatic back-channel signals: Any indication of resumed US-Iran communications, even informal ones, would likely trigger an immediate downward price reaction given the speed with which the previous diplomatic optimism moved markets
- OPEC+ emergency communications: Statements regarding spare capacity activation or production adjustments would signal whether Gulf producers are positioning to absorb a supply shock
- Iranian military posture: Satellite imagery and intelligence assessments of Iranian naval and missile positioning near the strait are being closely monitored by energy security analysts as leading indicators of escalation probability
The Structural Vulnerabilities This Episode Has Laid Bare
Beyond the immediate price movement, the events of May 28, 2026 have illuminated three deeper vulnerabilities in the global energy system that will outlast any single military exchange.
Chokepoint concentration risk remains unresolved after decades of recognition. The global oil trade still funnels an extraordinary share of its volume through a 33-kilometre passage that sits within missile range of a nation actively engaged in military conflict with the United States. No serious diversification of this risk has been achieved.
The diplomacy-disruption oscillation creates its own form of market instability. When peace prospects cause prices to fall sharply, and military action causes them to surge, the market effectively becomes a real-time referendum on negotiation credibility. Furthermore, this oil market disruption cycle demonstrates that false starts in diplomatic processes inflict real economic costs through the volatility they generate.
Supply buffer erosion at this stage in the cycle means that shocks hit a system with reduced absorptive capacity. Six consecutive weeks of US inventory drawdowns are not a coincidence but a reflection of demand running ahead of supply allocation, a condition that makes every instance where oil surges after Iran targets US airbase activity more impactful than it would be in a well-stocked market. Consequently, as Arab News has reported, the underlying fragility of global supply chains remains a persistent concern for energy analysts and policymakers alike.
Disclaimer: This article presents analysis of publicly reported market events and is intended for informational purposes only. It does not constitute financial advice. Oil price forecasts and scenario projections referenced herein are illustrative analytical frameworks and should not be relied upon as predictions of future market outcomes. Readers should conduct their own research before making any investment decisions.
Want To Stay Ahead Of The Next Major Resource Discovery Triggered By Shifting Energy Markets?
When geopolitical shocks reshape commodity markets overnight, identifying the right resource opportunities at the right moment becomes critical — Discovery Alert's proprietary Discovery IQ model instantly scans ASX announcements across more than 30 commodities, delivering real-time alerts on significant mineral discoveries so investors can act before the broader market catches on. Start your 14-day free trial at Discovery Alert and see how historic discoveries have generated substantial returns on the dedicated discoveries page.