June 4, 2026
The Hidden Architecture of an Oil Crisis Decades in the Making
Most commodity price cycles follow a predictable rhythm: disruption, spike, recovery, normalisation. Investors have been trained across decades of oil market history to treat price surges as temporary deviations from a mean. Buy the dip, wait for diplomacy, harvest the reversion. This framework has worked reliably enough that it now operates almost as a reflex in financial markets. The problem is that this mental model was built for a different world — one with adequate spare capacity, a functioning Middle Eastern supply corridor, and an upstream industry willing to reinvest its cash flows into future production. None of those conditions exist in 2026 in the same form they once did. The case for oil above $100 for years is not a fringe view. It is increasingly the base case for independent energy research, and understanding the oil price trends that led here is essential context.
When big ASX news breaks, our subscribers know first
A Decade of Capital Starvation in the Upstream Sector
To understand where oil prices are heading, it helps to begin not with the Strait of Hormuz, but roughly twelve years earlier. The U.S. shale revolution that gathered momentum through the early 2010s fundamentally rewired the incentive structure of the global oil industry. When U.S. production growth flooded markets and prices collapsed in 2014 and 2015, the upstream sector responded by slashing capital expenditure dramatically. What followed was not a temporary belt-tightening but a sustained multi-year retrenchment that permanently altered the industry's production trajectory.
How Capital Discipline Changed Everything
Outside of U.S. shale basins, virtually no major producing region has delivered meaningful production growth over the past decade. Furthermore, even within those shale basins, operators have increasingly prioritised capital returns to shareholders over volume growth — a strategic shift known as capital discipline that fundamentally changed the relationship between price incentives and supply response. The US shale slowdown has been a critical factor in eroding the market's ability to self-correct.
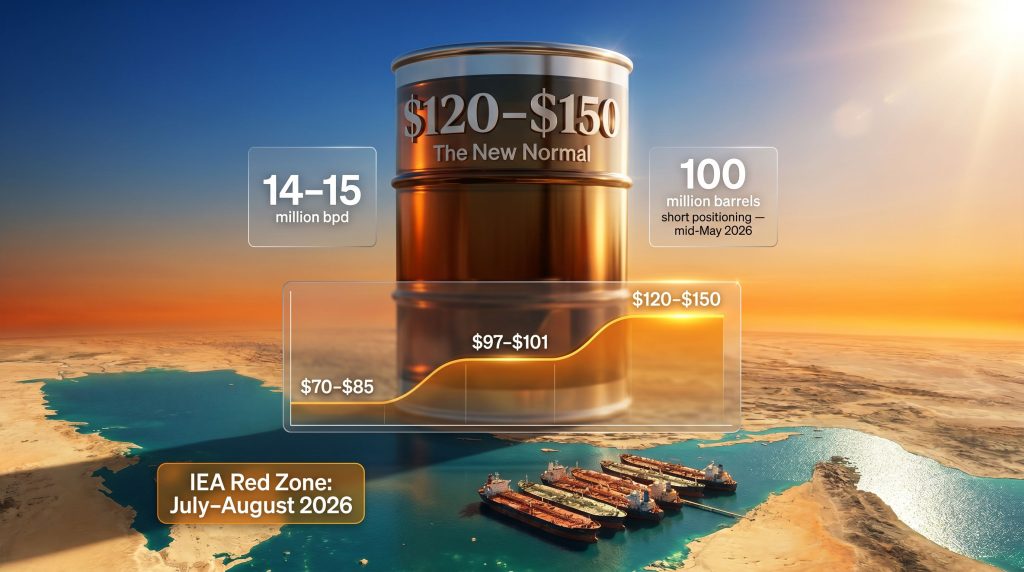
The cumulative effect of this underinvestment is critical to understanding the current environment. Global spare capacity has been eroded to historically thin levels, leaving the market with almost no buffer against unexpected supply disruptions. When the Strait of Hormuz closure removed approximately 14 to 15 million barrels per day from accessible global supply, the system had no meaningful shock absorber to deploy.
Natural resource analysts Leigh Goehring and Adam Rozencwajg articulated this structural reality in their Q1 2026 quarterly commentary, arguing that the upstream industry had entered a structurally tight phase following years of inadequate capital spending, arriving at precisely the moment the market was confronted with an acute physical bottleneck of historic proportions.
How This Crisis Compares to Every Previous Oil Disruption
Context matters enormously when assessing whether oil above $100 for years represents a realistic scenario or analytical overreach. A comparison with historical supply disruptions reveals just how unprecedented the current situation is.
| Crisis | Volume Disrupted (bpd) | Duration | Peak Price Impact |
|---|---|---|---|
| 1973 Arab Oil Embargo | ~4 to 5 million | ~6 months | ~300% price increase |
| 1990 Gulf War | ~4 to 5 million | Weeks to months | ~$40 spike |
| 2011 Libya Conflict | ~1.5 million | Months | Modest premium |
| 2022 Russia-Ukraine | ~2 to 3 million | Ongoing (partial) | Brief $100+ spike |
| 2026 Hormuz Closure | 14 to 15 million | 3+ months (ongoing) | Modest relative to scale |
The numbers present a striking anomaly. The current disruption is more than three times larger by volume than any previous oil crisis on record, yet Brent crude at its 2026 peak exceeded its 2008 high by only a marginal amount. This pricing disconnect is not a sign of market efficiency. It reflects a collective bet by financial market participants that diplomatic resolution is imminent — a bet that has been renewed continuously for over three months without materialising.
Goehring and Rozencwajg captured this mispricing with precision, noting that the market had encountered an energy dislocation larger than any previously recorded and had essentially treated it as a difficult but ultimately temporary inconvenience. As reported by The Guardian, Iran-related tensions drove oil above $100 a barrel for the first time since 2022 — yet financial markets continue to price in a swift resolution.
Why Financial Markets Are Pricing in a Resolution That Has Not Come
Understanding the gap between current prices and physical market reality requires examining market positioning data. According to energy analyst John Kemp, bearish short positions in Brent crude climbed from approximately 40 million barrels at the end of March 2026 to 100 million barrels by mid-May 2026, representing seven consecutive weeks of increasing short positioning. This is a market structure built on a single assumption: that the Hormuz disruption will end soon.
The risk embedded in this positioning is asymmetric and severe. If that diplomatic resolution fails to materialise, the unwind of 100 million barrels of short positions does not happen gradually. It happens rapidly and violently upward. The very optimism that has suppressed prices becomes the fuel for a price explosion.
The Information Lag Problem
There is also a fundamental information lag problem that most financial market participants systematically underestimate. Physical crude oil moves through the global supply chain over weeks and months. Inventory statistics, refinery run rates, and product availability data reflect conditions from four to eight weeks prior to publication.
This means that the full impact of a three-month, 14 to 15 million bpd supply disruption is only beginning to surface in observable market data. By the time the physical tightness becomes undeniable in the data, prices will already be moving.
The oil market's information architecture is built for normal conditions. In a crisis of this magnitude, the feedback loop between physical reality and financial pricing can take months to close, and when it does, it closes rapidly.
The IEA's "Red Zone" and the Summer 2026 Inventory Crisis
The International Energy Agency has issued unusually direct warnings about what lies ahead. IEA head Fatih Birol stated that global oil markets could enter a critical stress threshold by July or August 2026, describing the potential situation as a "red zone." The convergence of forces driving this warning includes:
- Rapidly depleting inventories with no Middle Eastern supply available to replace lost volumes.
- Peak summer travel demand arriving precisely as storage buffers approach minimum operational levels.
- No credible short-cycle supply response capable of bridging the volume gap within the relevant timeframe.
The IEA has confirmed that global oil stocks are being steadily eroded. The timing matters enormously. Refineries drawing down inventories ahead of peak demand season have some tolerance for tight supply conditions. Once those buffers approach minimum operational thresholds, refineries begin competing aggressively for available crude — a dynamic that transmits directly and rapidly into spot prices.
HSBC has flagged what it describes as a "super-squeeze" developing in oil markets, reflecting the simultaneous compression of physical supply availability, aggressive short positioning in financial markets, and seasonal demand acceleration. This combination rarely produces orderly price discovery. In addition, OPEC's market influence has been constrained by the very spare capacity limitations that underinvestment created.
The $120 to $150 Scenario: Base Case or Tail Risk?
Independent energy research has modelled what happens to Brent crude pricing if the Hormuz disruption extends beyond Q3 2026 and physical market participants begin pricing based on supply replacement cost rather than diplomatic optimism. The conclusion, articulated in research from Goehring and Rozencwajg, is that $120 to $150 per barrel becomes not a spike scenario but a multi-year equilibrium range. Analysts at OilPrice.com warn that oil could stay above $100 for years if structural supply deficits remain unaddressed.
Three distinct pathways exist for how this situation resolves:
Scenario 1: Extended Hormuz Disruption
- Strait of Hormuz remains closed or severely restricted through late 2026.
- Global inventories reach minimum operational thresholds by August 2026.
- Short positions unwind sharply as diplomatic optimism collapses.
- Brent reprices above $120; multi-year supply rebuilding timeline sustains elevated prices through 2028 to 2029.
Scenario 2: Diplomatic Resolution with Structural Overhang
- A U.S.-Iran deal reopens the Strait.
- Kuwait has already confirmed production recovery would require 10 to 12 weeks post-reopening.
- Iraq is targeting 770,000 bpd through the Ceyhan pipeline as an alternative route, representing only a fraction of pre-closure volumes.
- Prices moderate but the structural underinvestment problem persists; Brent stabilises in the $90 to $110 range rather than returning to pre-crisis levels.
Scenario 3: Re-Escalation
- Rystad Energy has modelled a scenario where renewed U.S.-Iran military escalation could drive oil to $180 per barrel by August 2026.
- At this price level, global recession risk becomes the dominant macroeconomic variable, creating its own demand destruction feedback.
Even in Scenario 2, the most optimistic resolution pathway, analysts broadly agree that the pre-2026 pricing regime of $70 to $85 Brent is unlikely to return within a three to five year horizon. The structural supply deficit simply does not reverse quickly. Furthermore, the trade war and oil prices dynamic adds another layer of complexity to any demand-side projections.
The next major ASX story will hit our subscribers first
Why Restarting 15 Million Barrels Per Day Is Not a Simple Switch
One of the least understood dimensions of the current crisis is the operational complexity involved in restarting suspended oil production at scale. Financial markets appear to price in a relatively immediate supply recovery following any diplomatic resolution. The physical reality is far more complicated.
Kuwait's explicit statement that output recovery would require 10 to 12 weeks after Hormuz reopens assumes no infrastructure damage requiring repair. Iraq's southern export infrastructure, which handles the majority of its roughly 3.3 million bpd production capacity, requires careful sequencing across wellheads, processing facilities, pipeline systems, and loading terminals. Saudi Arabia and the UAE face equivalent operational restart challenges across their combined production systems.
The cumulative effect: even a successful diplomatic outcome does not produce an immediate supply surge. Physical markets remain tight for months to years following any resolution. This is the mechanism through which oil above $100 for years becomes a structural reality rather than a crisis anomaly.
The Macroeconomic Transmission: From Crude Prices to Consumer Costs
The economic consequences of sustained elevated oil prices extend well beyond energy sector balance sheets. At $90 per barrel, India's inflation rate is estimated to increase by approximately 4.8% with measurable GDP growth drag. At $120 to $150 sustained pricing, the transmission effects across import-dependent economies would be substantially more severe.
Real-world evidence of this transmission is already accumulating. Pakistan's inflation has accelerated to 11.7% driven by oil and gas import shocks. India's oil demand growth forecast has been revised down to pandemic-era lows. South Korea has moved to lock in Canadian crude and LNG supplies through long-term agreements to reduce Middle Eastern supply dependence. Japan has committed $19.4 billion to emergency energy security measures.
The Central Bank Dilemma
The Kansas City Federal Reserve President has warned publicly that the current oil price shock may not prove to be transitory — a characterisation with significant implications for monetary policy. If central banks tighten in response to oil-driven inflation, the recessionary risk compounds. If they tolerate elevated inflation to protect growth, real purchasing power erodes across importing economies.
Goldman Sachs has acknowledged that demand destruction effects could partially offset supply shock risks, noting that higher prices suppress consumption in price-sensitive emerging markets. However, demand destruction is asymmetric. It cuts consumption in vulnerable economies like India, Pakistan, and Southeast Asia while leaving industrial and transportation demand in advanced economies relatively inelastic. More critically, demand destruction does nothing to rebuild the supply capacity deficit. Any subsequent demand recovery would encounter an even tighter supply environment.
Sector Impact at a Glance
| Sector | Near-Term Impact | Direction |
|---|---|---|
| Upstream oil producers | Elevated margins, capex recovery incentive | Positive |
| Oil refiners | Strong crack spreads; Goldman Sachs projects strong profits through 2026 | Positive (near-term) |
| Airlines and Transport | Fuel cost surge, margin compression | Negative |
| Petrochemicals | Input cost inflation, demand erosion | Negative |
| Renewable energy | Improved cost competitiveness, accelerated investment case | Positive |
| Emerging market consumers | Inflation, currency pressure, subsidy burden | Strongly Negative |
| LNG exporters | Demand surge as Asian buyers seek supply diversification | Mixed/Positive |
The Renewable Acceleration Paradox and Long-Term Capital Cycles
Sustained high oil prices historically produce a counterintuitive secondary effect: they accelerate renewable energy investment by improving the relative economics of solar, wind, and battery storage against fossil fuel alternatives. Japan's $19.4 billion energy commitment and South Korea's supply diversification strategy both reflect a dual-track response — securing fossil fuel supply in the near term while simultaneously accelerating the structural transition away from Middle Eastern crude dependence. The renewable energy transition is, consequently, being turbocharged by the very crisis that highlights fossil fuel vulnerability.
For upstream reinvestment, $100+ pricing creates the economic justification for large-scale greenfield development, but the capital cycle lag is severe. New supply from greenfield projects typically requires five to ten years from investment decision to first production. Near-term beneficiaries are existing high-margin producers with low breakeven costs, integrated majors with refining exposure, and LNG exporters serving Asian markets seeking to reduce their own Hormuz dependency.
Goldman Sachs has projected strong refining margins through at least 2026 amid ongoing fuel supply tightness. The structural case for oil above $100 for years ultimately rests on a simple arithmetic reality: the volume of supply that has been removed from the market cannot be replaced quickly, and the decade of underinvestment that preceded the crisis means the broader supply system has very little slack with which to absorb a shock of this magnitude.
Disclaimer: This article is for informational purposes only and does not constitute financial or investment advice. Oil price projections, scenario analyses, and macroeconomic forecasts referenced herein involve significant uncertainty and are not guarantees of future outcomes. Investors should conduct their own due diligence before making any investment decisions.
Want to Position Ahead of the Next Major Resource Discovery?
Discovery Alert's proprietary Discovery IQ model scans ASX announcements in real time, instantly identifying high-potential mineral discoveries across more than 30 commodities — turning complex data into actionable investment insights before the broader market catches on. Explore historic discoveries and the exceptional returns they generated, then begin your 14-day free trial to ensure you're positioned ahead of the next major find.