July 11, 2026
What Makes Oil Price Volatility a Systemic Economic Risk?
Energy price shocks have historically served as economic harbingers, yet the current landscape presents unprecedented complexity in transmission mechanisms and global interconnectedness. Understanding how oil turmoil threatens global economic stability requires examining both traditional pathways and modern amplification effects that transform regional disruptions into systemic crises.
The Multiplier Effect of Energy Price Shocks
Statistical analysis reveals that sustained oil price increases above $40 per barrel for more than one quarter produce measurable GDP contraction across developed economies. The International Energy Agency documents that for every $10 per barrel sustained increase, OECD GDP growth typically contracts by 0.2-0.3 percentage points in the following 6-12 months.
Historical precedent demonstrates the severity of these transmission mechanisms:
• 1973 Arab Oil Embargo: Crude prices surged from $3 to $12 per barrel, precipitating stagflation with inflation reaching 11-13% and GDP declining by 2-4% across OECD economies
• 1979 Iranian Revolution: Oil prices jumped from $13 to $39 per barrel, contributing to US inflation exceeding 13% and consecutive quarters of negative GDP growth
• 2008 Financial Crisis: Brent crude peaked at $147.50 per barrel, contributing to a 2.1% global GDP contraction in 2009
Modern transmission operates with heightened speed compared to historical crises due to global financial integration and real-time price discovery mechanisms. Physical supply disruptions now transmit directly to financial markets within hours rather than days, amplifying volatility propagation across interconnected systems.
The current crisis exemplifies this acceleration, with Brent crude reaching $116.50 per barrel in March 2026, representing a 45% increase within weeks. This magnitude aligns with thresholds for substantial economic disruption, particularly when considering our comprehensive oil price rally analysis that examines supply-constrained rather than demand-driven price movements.
Oil price shocks transmit through five primary channels: direct energy cost increases in transportation and production, cost-push inflation effects on core consumer price components, consumer discretionary spending contraction, business investment postponement due to uncertainty, and financial sector balance sheet effects when energy sector debt becomes stressed.
Central Bank Policy Dilemmas During Energy Crises
Central banks face unprecedented challenges when energy-driven inflation conflicts with growth preservation mandates. Unlike demand-driven inflation, supply-shock inflation limits traditional monetary policy effectiveness while creating impossible trade-offs between price stability and economic growth.
The Federal Reserve's balance sheet expansion during 2008 ($1.8 trillion in quantitative easing) contrasted sharply with constrained response options during 2022's supply-driven inflation, demonstrating how energy shocks fundamentally alter available policy tools.
Gasoline prices historically lag crude oil prices by 7-10 trading days, meaning immediate crude price spikes do not immediately constrain consumer spending. However, within 2-3 weeks, fuel price transmission to retail gasoline and diesel creates consumer demand destruction that central banks cannot easily offset through monetary accommodation.
Interest rate policy becomes particularly constrained when energy drives core inflation, as rate increases designed to combat inflation simultaneously exacerbate economic contraction from higher energy costs. Furthermore, this creates a stagflationary dynamic where traditional monetary policy tools become counterproductive.
When big ASX news breaks, our subscribers know first
How Do Geopolitical Oil Disruptions Cascade Through Global Markets?
Geopolitical disruptions in oil markets create cascading effects that extend far beyond energy sectors, propagating through currency markets, supply chains, and financial systems with increasing velocity and complexity.
Critical Chokepoint Analysis and Supply Chain Vulnerabilities
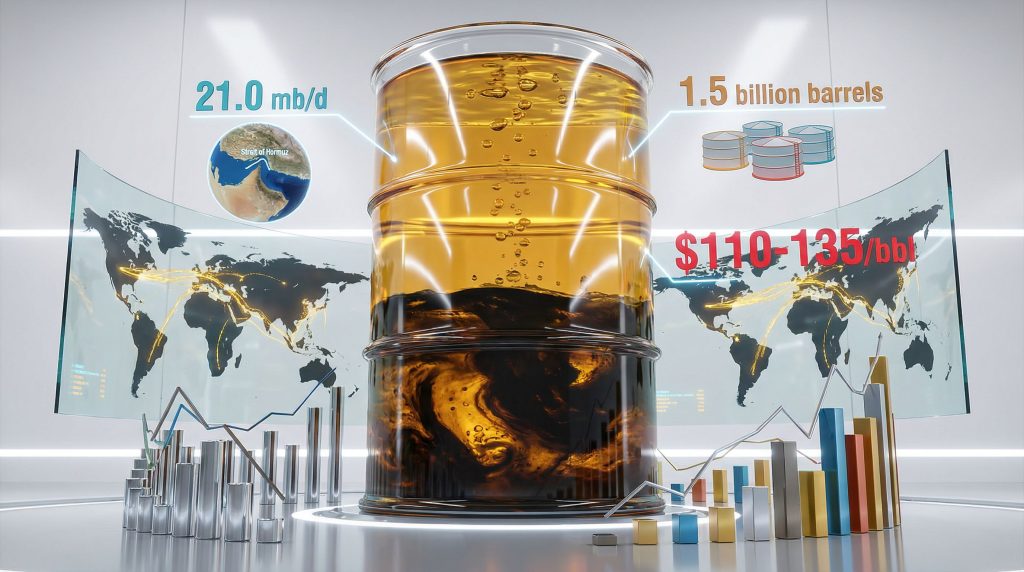
Global oil transit depends critically on several strategic chokepoints, creating single points of failure for substantial portions of world supply. The Strait of Hormuz represents the most critical vulnerability, with approximately 21% of global petroleum liquids (21.0 million barrels per day) transiting this narrow waterway annually.
Major Oil Transit Chokepoints and Daily Flow Volumes:
| Chokepoint | Daily Flow (mb/d) | Global Share | Alternative Routes |
|---|---|---|---|
| Strait of Hormuz | 21.0 | 21% | Limited pipeline capacity |
| Strait of Malacca | 16.0 | 16% | Longer Pacific routes |
| Suez Canal | 5.5 | 6% | Cape of Good Hope |
The Strait of Hormuz presents particularly acute vulnerability because pipeline alternatives accommodate only 3-5 million barrels per day of the 21 million barrel daily flow, leaving 16-18 million barrels with no economically viable alternative during closure scenarios.
Current market conditions demonstrate this vulnerability acutely. Recent disruptions have forced production shut-ins across multiple Middle Eastern producers, with Saudi Arabia joining Iran and Iraq in reducing output as storage capacity limitations compound physical supply constraints from drone strikes and regional conflicts.
Storage-capacity exhaustion creates a unique crisis dynamic where producers must shut in production not due to damaged infrastructure but because logistics systems cannot accommodate continued output. This represents a more complex transmission mechanism than traditional supply disruptions, combining both supply destruction and infrastructure constraints.
Alternative routing through the Cape of Good Hope adds approximately 5,600 nautical miles to voyage length from the Middle East to Europe, increasing transit time by 10-14 days and adding $200,000-$400,000 in additional fuel and operating costs per tanker transit. In addition, this cost differential explains limited alternative route utilization during normal market conditions and the severity of disruptions when primary routes become unavailable.
Financial Market Contagion Mechanisms
Modern financial markets price chokepoint risk within 5-10 minutes of disruption news, whereas physical supply disruptions require 2-4 weeks to manifest in delivered crude. This timing mismatch creates financial market volatility exceeding physical market fundamentals.
Currency markets show particular sensitivity to oil price shocks, with emerging market economies experiencing currency depreciation averaging 3-5% during $10 per barrel price increases. Recent data indicates Turkish lira, Indian rupee, and Brazilian real depreciation of 4-6% amid current price spikes, with accelerating capital outflows from bond markets.
Equity sector rotation patterns during energy crises demonstrate systematic risk transmission across industries. Transportation sector vulnerability varies significantly, with airlines operating at 30-40% fuel cost ratios compared to manufacturing averages of 5-8%, explaining differential sectoral impact during energy price shocks.
The November 2023-January 2024 Houthi Red Sea campaign provides recent precedent for financial contagion mechanisms. Shipping companies diverted approximately 40% of southbound container traffic and 30-35% of crude tanker traffic away from the Suez Canal, resulting in:
• Brent crude premium of $5-8 per barrel reflecting longer transit times and insurance costs
• Shipping rates for Very Large Crude Carriers increasing 120% from $40,000 to $88,000 per day
• Mediterranean refineries experiencing supply constraints with idle capacity increases of 15-20%
What Are the Macroeconomic Transmission Channels of Oil Price Shocks?
Oil price volatility propagates through interconnected economic channels that amplify initial disruptions into broader systemic instability, affecting inflation dynamics, trade balances, and consumer behavior patterns.
Inflation Dynamics and Consumer Spending Patterns
Energy price increases create immediate cost-push inflation through direct fuel costs and secondary effects through transportation and production expenses. The 2022 Russian oil embargo demonstrated this mechanism clearly, with Eurozone inflation accelerating from 2.4% in January to 10.6% by October 2022, with energy comprising 45% of this increase.
Consumer discretionary spending reallocation occurs systematically during energy price spikes as households redirect income toward essential fuel and heating costs. This creates deflationary pressure in non-energy sectors even as overall inflation rises, complicating monetary policy responses.
Transportation costs represent a critical transmission channel, with fuel expenses affecting food distribution, manufacturing logistics, and service delivery. Each $10 per barrel oil price increase typically translates to $0.25-0.30 per gallon gasoline price increases, directly impacting household budgets and spending patterns.
Trade Balance Disruptions and Current Account Pressures
Oil-importing nations experience immediate current account deterioration during price spikes, with effects varying based on import dependency and currency dynamics. The European Commission estimated that 2022 energy price shocks reduced Eurozone GDP growth by 0.8-1.2 percentage points across 2022-2023.
Petrodollar recycling patterns shift during sustained price increases, creating capital flow reversals that destabilise emerging market economies. Oil-exporting nations typically increase foreign asset purchases during price booms, while importing nations experience capital outflows and currency pressure.
Exchange rate adjustment mechanisms become critical during extended oil price volatility. Countries with flexible exchange rates experience automatic adjustment through currency depreciation, which partially offsets higher oil costs but creates imported inflation in other sectors.
However, understanding these complex oil price crash dynamics helps policymakers prepare for both boom and bust scenarios.
Economic Rule of Thumb: For every $10 increase in oil prices sustained over 12 months, global GDP growth typically contracts by 0.2-0.3 percentage points, with oil-importing economies experiencing disproportionate impacts.
How Do Strategic Petroleum Reserves Function as Economic Stabilizers?
Strategic petroleum reserves serve as critical economic shock absorbers, though their effectiveness depends on release timing, volume, and coordination among International Energy Agency member nations.
Global SPR Capacity and Release Mechanisms
IEA member countries maintain combined strategic reserves of approximately 1.5 billion barrels, representing roughly 90 days of import coverage for member nations. The recent G7 emergency meeting highlighted coordinated release protocols designed to stabilise markets during supply disruptions.
Recent strategic release effectiveness demonstrates both capabilities and limitations. The announcement of emergency barrel releases following the March 2026 price spike temporarily reduced Brent crude from $116.50 to $104.50 per barrel, illustrating immediate announcement effects on market psychology.
However, strategic releases provide temporary relief rather than fundamental supply replacement. The 2022 coordinated SPR releases totalled approximately 240 million barrels over six months, equivalent to roughly 1.3 million barrels per day of additional supply, insufficient to fully offset major production disruptions but effective in moderating price volatility.
Market Psychology and Price Discovery During Reserve Releases
Financial markets typically react more strongly to reserve release announcements than actual supply additions, reflecting the psychological component of oil price formation. Trader positioning and speculative premium adjustments often occur within hours of release announcements, preceding physical supply impacts by weeks.
Long-term reserve replenishment strategies create future market dynamics as governments eventually must replace released barrels. The US Strategic Petroleum Reserve has indicated plans to repurchase oil at prices below $70-75 per barrel, creating potential price support at those levels.
Current crisis dynamics present unique challenges for strategic reserve deployment. With Middle Eastern producers simultaneously shutting in production due to storage constraints rather than infrastructure damage, strategic releases may provide limited effectiveness without addressing underlying logistics bottlenecks.
What Economic Scenarios Emerge from Prolonged Oil Market Disruption?
Extended oil market disruptions create multiple potential economic pathways, ranging from manageable recession to severe stagflationary episodes reminiscent of 1970s energy crises.
Stagflation Risk Assessment in Advanced Economies
Current market analysis projects two primary scenarios based on conflict duration. Under a two-month disruption scenario, Brent prices would remain above $110 per barrel through April before stabilising near $70 by December, resulting in a 2026 average of approximately $87 per barrel.
A four-month disruption scenario projects oil prices peaking around $135 per barrel before declining toward $85 by year-end, averaging roughly $100 per barrel for 2026. This scenario triggers significant stagflation risks across developed economies.
Economic Impact Scenarios by Oil Price Levels:
| Brent Price Range | Global GDP Impact | Inflation Effect | Policy Response |
|---|---|---|---|
| $60-80/bbl | Baseline growth | Target inflation | Normal monetary policy |
| $80-110/bbl | -0.3% growth drag | +1.5% CPI | Hawkish central banks |
| $110-135/bbl | -0.8% growth drag | +3.0% CPI | Emergency coordination |
Central bank credibility faces severe testing during supply-shock inflation as traditional inflation targeting becomes incompatible with growth preservation. The 1970s stagflation parallel emerges when energy-driven inflation expectations become embedded in wage negotiations and price-setting behaviour.
Labor market dynamics during energy crises create wage-price spiral risks when workers demand compensation for higher living costs. Union negotiations scheduled throughout 2026 will test whether energy-driven inflation translates to broader wage pressures, particularly given the complex interplay with US economic challenges stemming from multiple policy pressures.
Emerging Market Vulnerability Matrix
Current account deficit countries face disproportionate vulnerability during sustained oil price elevation. Turkey, India, and South Africa represent highest-risk economies with substantial oil import dependencies and limited fiscal buffers.
Currency crisis probability models indicate that sustained oil prices above $110 per barrel create 60-70% probability of significant emerging market currency devaluation within six months. Capital flight accelerates as investors price in deteriorating terms of trade and current account sustainability.
Social stability implications emerge when governments face pressure to remove energy subsidies that become fiscally unsustainable at high oil prices. Historical precedent from 2008 and 2011 demonstrates how energy subsidy removal can trigger social unrest and political instability.
How Do Energy Transitions Affect Oil Market Stability?
The intersection of traditional oil market dynamics with accelerating energy transition creates new volatility patterns and demand destruction mechanisms that fundamentally alter crisis transmission pathways.
Renewable Energy Adoption and Demand Elasticity Changes
Electric vehicle penetration rates create increasing demand elasticity for petroleum products, particularly in transportation sectors. Current EV adoption of approximately 14% of new vehicle sales globally provides limited immediate demand destruction but accelerates during high-price episodes.
Grid storage capacity and renewable intermittency create complex substitution patterns between oil and alternative energy sources. During extended oil price spikes, industrial processes with flexible energy inputs shift toward electricity from renewable sources where grid capacity permits.
Industrial electrification timelines accelerate during sustained high oil prices as capital investment economics favour electric alternatives. Chemical and steel industries show particular sensitivity to oil price-driven electrification decisions with long-term demand implications.
Investment Cycle Disruptions in Traditional Energy Infrastructure
Capital allocation shifts from upstream oil exploration toward renewable projects during extended high-price periods, creating medium-term supply constraints as traditional investment cycles extend beyond typical 3-5 year project development timelines.
Refining capacity constraints emerge as defensive operational measures during current crisis conditions. Industry analysis indicates refineries curtailing throughput as defensive measures, shifting focus from profit margins to national energy security considerations.
Stranded asset risks in long-cycle oil projects increase during volatile price environments as uncertain demand trajectories complicate investment decision-making. For instance, deepwater and oil sands projects face particular challenges with break-even requirements above $60-70 per barrel.
The next major ASX story will hit our subscribers first
What Policy Tools Can Mitigate Oil-Driven Economic Instability?
Governments possess various fiscal and regulatory instruments to mitigate oil price shock transmission, though effectiveness depends on implementation timing and international coordination mechanisms.
Fiscal Policy Responses and Automatic Stabilizers
Energy subsidy mechanisms provide immediate consumer protection but create substantial fiscal pressures during sustained price increases. European energy subsidies during 2022 totalled approximately €280 billion, representing 2-3% of GDP across member nations.
Tax policy adjustments offer rapid response mechanisms through temporary fuel tax reductions or windfall profit taxes on energy companies. The UK's windfall tax on oil company profits generated approximately £5 billion in additional revenue during 2022-2023.
Infrastructure investment acceleration serves dual purposes of economic stimulus and long-term energy security enhancement. Strategic investment in pipeline capacity, storage facilities, and renewable energy infrastructure reduces future crisis vulnerability.
International Coordination Frameworks
G7 and G20 emergency response protocols demonstrated effectiveness during current crisis through coordinated strategic reserve releases and diplomatic engagement with oil-producing nations. However, coordination becomes more challenging during extended disruptions as national interests diverge.
Bilateral strategic partnerships and supply diversification agreements provide medium-term crisis mitigation. The recent 30-day US waiver allowing increased Russian oil flows through India demonstrates pragmatic policy adjustment under market stress.
Multilateral development bank financing for energy security projects accelerates during crisis periods as governments prioritise infrastructure investment for supply diversification and storage capacity enhancement. Consequently, understanding OPEC market influence becomes crucial for effective policy coordination.
How Should Investors Position for Oil Market Volatility?
Investment strategy during oil market turmoil requires balancing defensive positioning with opportunities created by sector rotation and currency dislocations.
Sectoral Allocation Strategies During Energy Crises
Defensive positioning in consumer staples and utilities provides portfolio protection during energy-driven economic slowdowns. Historical analysis shows utilities outperforming energy by 35-40% and consumer discretionary by 50-60% during sustained oil price elevation.
Currency hedging strategies become critical for international equity exposure as oil price shocks create systematic currency volatility. Emerging market currency exposure requires particular attention given 3-5% depreciation patterns during oil price increases.
Real asset allocation including energy infrastructure and commodities provides inflation protection during supply-driven price increases. Master Limited Partnerships and energy infrastructure investments historically outperform during sustained high oil price environments.
Tail Risk Management and Portfolio Resilience
Options strategies for energy price spike protection include oil price call options and energy sector equity puts to provide asymmetric protection during extreme price movements. Volatility typically increases 40-60% during geopolitical events affecting major chokepoints.
Geographic diversification across oil-exporting and importing economies helps balance portfolio exposure to oil price directionality. Canadian and Norwegian equity markets typically outperform during oil price increases while Asian markets underperform.
Alternative energy investment serves as long-term volatility hedge as renewable energy infrastructure provides price stability relative to fossil fuel alternatives during crisis periods. These dynamics become particularly relevant when examining oil movements in trade wars.
What Are the Long-Term Structural Implications for Global Energy Security?
Current crisis dynamics accelerate structural changes in global energy systems, creating lasting implications for economic stability and international trade patterns.
Supply Chain Regionalization and Energy Independence Strategies
Domestic energy production incentives gain political support during crisis periods as energy security considerations override cost efficiency calculations. The US shale sector provides potential supply response to high prices, though response timing requires 6-12 months for meaningful production increases.
Regional energy partnership development accelerates as nations seek supply diversification away from geopolitically vulnerable sources. European LNG infrastructure investment following 2022 Russian supply disruption exemplifies this structural shift toward supply source diversification.
Critical mineral supply chain diversification for renewable energy becomes strategically important as energy transition acceleration during oil crises requires secure access to battery materials and rare earth elements for alternative energy infrastructure.
Technology Innovation and Energy Resilience Building
Advanced energy storage deployment provides grid stability during transition periods as renewable energy capacity increases in response to sustained fossil fuel price elevation. Battery storage capacity installation accelerates during high oil price environments.
Hydrogen economy development gains momentum during extended oil price volatility as industrial applications seek energy input diversification. Steel and chemical industries show increasing interest in hydrogen substitution during sustained high hydrocarbon prices.
Carbon capture and utilisation technology investment increases during high oil price periods as enhanced oil recovery economics improve and carbon management becomes economically attractive for industrial applications.
The current crisis demonstrates how oil turmoil threatens global economic stability through multiple interconnected channels, requiring coordinated policy responses and strategic adaptation to emerging energy system realities. Investment strategies and policy frameworks must account for both immediate crisis management and long-term structural transformation in global energy markets.
Recent assessments from industry experts suggest that these oil turmoil dynamics will continue to shape global economic stability as markets navigate between short-term disruptions and long-term structural changes in the energy landscape.
This analysis contains forward-looking statements and market projections that involve substantial uncertainty. Oil market dynamics and geopolitical developments can change rapidly, affecting economic outcomes. Readers should consider this information alongside other sources and professional advice when making investment or policy decisions.
Looking to Capitalise on Energy Market Volatility?
Discovery Alert's proprietary Discovery IQ model delivers real-time alerts on significant ASX mineral discoveries, helping investors identify actionable opportunities in energy and commodities sectors before the broader market reacts. With oil turmoil creating substantial volatility across global markets, securing timely insights into emerging mineral discoveries becomes crucial for maintaining a competitive investment edge during uncertain times.