June 7, 2026
The Supply Shock That Refused to Follow the Script
History offers a consistent lesson when major oil transit chokepoints come under threat: prices spike violently, economies rattle, and policymakers scramble. The 1973 Arab oil embargo cut supply by roughly 7% and caused prices to quadruple. The Iranian Revolution of 1979 removed approximately 5.6 million barrels per day from global markets and triggered a second catastrophic price surge. Both events reshaped geopolitical relationships and monetary policy for years afterward.
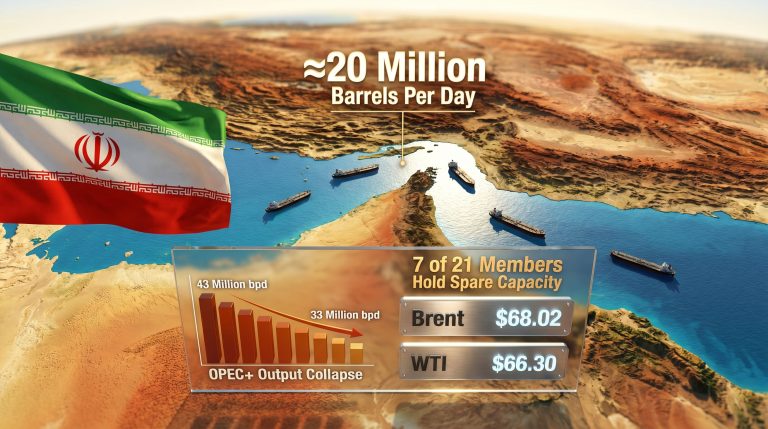
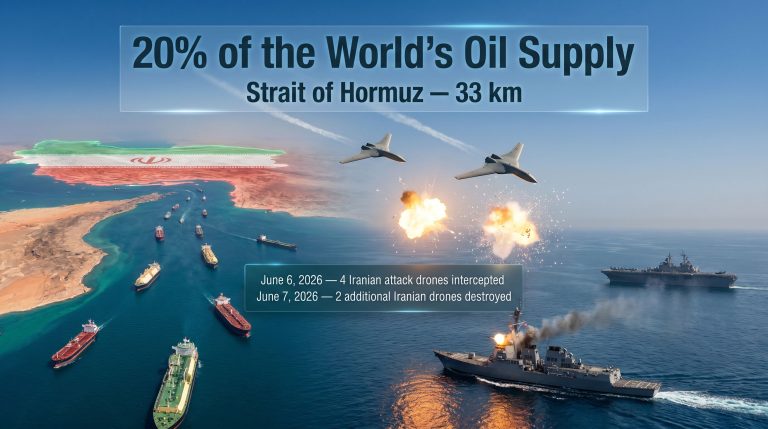
Against that historical backdrop, the effective blockade of the Strait of Hormuz in early 2026 should have been categorically worse. The strait carries roughly 20% of all globally traded oil, making it the single most consequential maritime chokepoint on earth. Pre-conflict modelling by analysts placed worst-case price scenarios between $150 and $300 per barrel. Some forecasts went higher.
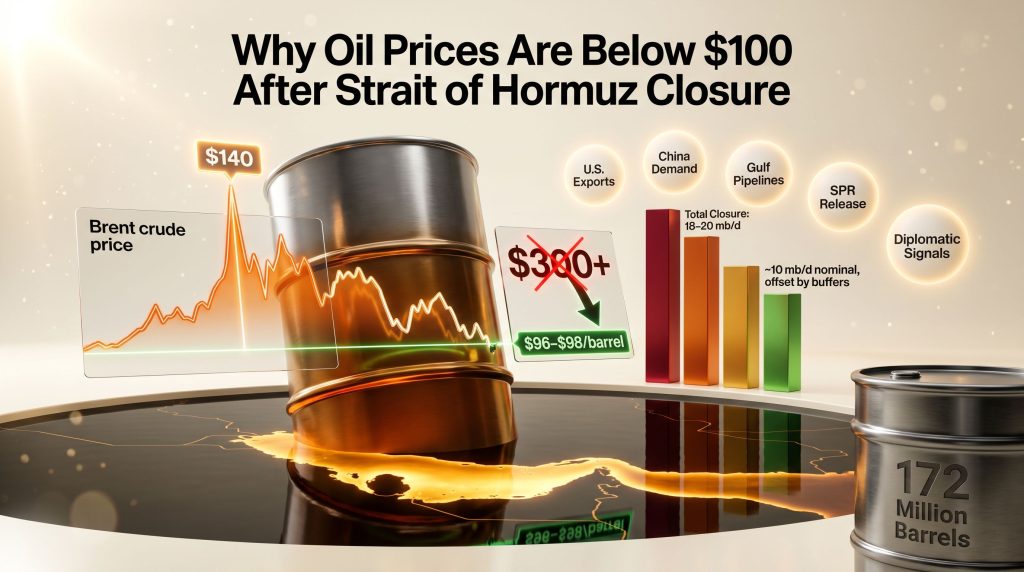
What actually happened defied nearly every one of those models. As of early June 2026, Dated Brent is trading near $96 to $98 per barrel, having peaked above $140 in the early conflict phase before retreating sharply. Understanding why oil prices are below $100 after the Strait of Hormuz closure requires dismantling the assumption that supply shocks operate through a single variable. In reality, five distinct structural forces have converged to absorb this disruption, each with its own ceiling, and each now approaching it.
Key analytical point: Oil futures markets price anticipated future supply, not just current physical shortages. When diplomatic resolution appears credible, even temporarily, geopolitical risk premiums compress rapidly regardless of whether the physical disruption remains active.
When big ASX news breaks, our subscribers know first
How Much Supply Was Actually Lost
Nominal Disruption Versus Net Impact
The nominal scale of the disruption is not in dispute. More than 10 million barrels per day of West Asian supply was effectively removed from normal transit routes after vessel crossings through the Strait of Hormuz collapsed from approximately 100 ships per day to just 2 to 3 per day in the immediate conflict phase.
However, the critical distinction in commodity market analysis is between gross supply loss and net effective loss after all offsetting factors are accounted for. The table below illustrates how different scenarios map onto price outcomes:
| Scenario | Estimated Daily Supply Loss | Observed/Projected Price Range |
|---|---|---|
| Total, permanent Hormuz closure | 18–20 mb/d | $150–$300+/barrel |
| Partial blockade with rerouting | 8–12 mb/d | $100–$150/barrel |
| Partial blockade + demand destruction + SPR release | 4–6 mb/d net | $80–$110/barrel |
| Current observed scenario (June 2026) | ~10 mb/d nominal, offset by buffers | ~$96–$100/barrel |
The current scenario sits in that third row. The nominal disruption is enormous, but the net effective supply loss has been compressed by a combination of demand-side withdrawal, emergency reserve deployment, alternative routing, and suppressed financial positioning. Furthermore, none of these offsets is permanent.
U.S. Central Command has cited a figure of nearly 1,000 commercial vessel crossings through the strait over the most recent two-month window, suggesting some partial, opaque resumption of flows. However, ongoing GPS jamming and automatic identification system disruptions have severely reduced commercial visibility on actual transit volumes, making independent verification difficult. Questions around oil trade and geopolitics have consequently become far more complex to assess.
According to Raymond James analyst Pavel Molchanov, a meaningful recovery in Hormuz transit would require a sustained weekly average of at least 20 ships per day, a threshold he described as unrealistic without a durable diplomatic settlement between the United States and Iran.
The Five Structural Buffers Keeping Oil Below $100
Buffer One: The American Shale Safety Valve
The structural transformation of the U.S. energy sector over the past decade has created a geopolitical flexibility that simply did not exist during previous supply shocks. American crude and fuel exports in May 2026 were more than 2 million barrels per day higher than the full-year 2025 average, representing an extraordinary swing in available global supply within a compressed timeframe.
The Trump administration also deployed the Strategic Petroleum Reserve at an aggressive pace, committing to release 172 million barrels as part of a coordinated advanced-economy response. At peak drawdown during one week last month, the SPR declined at a rate of 1.4 million barrels per day, a pace that surprised most market analysts. Notably, nearly half of all SPR barrels released have been directed to overseas destinations, primarily Europe, directly substituting for lost Persian Gulf flows.
Warning: US crude inventories have fallen to their lowest level in more than two decades. The critical storage hub at Cushing, Oklahoma, is approaching operational minimum thresholds, raising serious questions about how much longer the current export pace can be sustained.
Greg Sharenow, who helps oversee nearly $24 billion in assets as head of PIMCO's commodity portfolio investment team, has stated publicly that the U.S. is not capable of sustaining its current export volumes, and that inventories at Cushing are approaching operational lows. His assessment points to a finite ceiling on American supply dominance as a market stabiliser.
A lesser-known complicating factor is the competition between domestic refiners and exporters for the same barrels. U.S. refiners are running above-normal utilisation rates to meet peak summer fuel demand, which is bidding up domestic crude premiums and narrowing the arbitrage that makes American exports economically attractive in Asian markets. The US shale slowdown trends observed in 2025 have consequently limited the headroom available for further production increases.
One underreported element of the supply response has been a U.S.-facilitated waiver on certain sanctioned Russian crude flows, which has allowed Indian refiners to accelerate purchases. Russian crude flows to India averaged approximately 1.76 million barrels per day in May 2026, representing a 63% increase compared to February levels, providing an additional volume source that partially offsets Persian Gulf losses.
Buffer Two: China's Demand Withdrawal
No single factor has contributed more unexpectedly to price suppression than China's sharp reduction in crude purchasing activity. According to shipping analytics data from Vortexa, China slashed inbound oil shipments by approximately 40% in May 2026 relative to the prior year average, a contraction large enough to offset between one-fifth and one-third of the barrels lost to the Hormuz disruption.
Refinery throughput across China in May and June 2026 is estimated at approximately 13 million barrels per day, a monthly run rate last observed during the early pandemic months of 2020, according to estimates from Kpler and Energy Aspects. This compares to a 2025 full-year average throughput of 14.8 mb/d, representing a reduction of nearly 1.8 mb/d.
Warren Patterson, head of commodities strategy for ING Groep NV in Singapore, has noted that China's withdrawal from the crude market played a crucial role in rebalancing global supply, and that the scale of that withdrawal took most market participants by surprise.
Three structural drivers explain this demand contraction:
-
Strategic reserve saturation: China's national strategic petroleum stockpile expanded aggressively during prior years of discounted crude availability. That stockpile has now reached functional capacity, eliminating what had been a persistent source of incremental demand beyond consumption needs.
-
Industrial feedstock substitution: Chinese petrochemical producers are increasingly converting coal and other alternative raw materials into chemical feedstocks, reducing crude oil's role as the primary chemical input. This structural shift, largely underreported in Western financial media, represents a potentially permanent alteration in China's crude demand profile at the margins.
-
Electric vehicle penetration: Surging domestic EV adoption is materially reducing Chinese gasoline consumption. China's passenger vehicle market is now transitioning rapidly, and the cumulative displacement of liquid fuel demand is no longer a future projection but a present-tense reality.
Many commodity traders now identify China's eventual re-entry into the market at pre-conflict purchasing rates as the single most important trigger for a sustained breach of the $100 price ceiling.
Buffer Three: Alternative Persian Gulf Export Infrastructure
Persian Gulf producers had not merely theorised about Hormuz disruption scenarios. They had built physical infrastructure specifically designed for them. Saudi Arabia's East-West Pipeline activated quickly to route millions of barrels per day to Red Sea loading terminals, bypassing the strait entirely. The UAE's Fujairah pipeline provided a separate bypass corridor, enabling Abu Dhabi crude to reach export terminals outside the Persian Gulf.
These pre-built redundancy systems represent decades of strategic infrastructure investment that paid off precisely as designed. They do not represent unlimited capacity, however, and both pipelines are operating near their design maximums.
Buffer Four: Coordinated Strategic Reserve Releases
The International Energy Agency coordinated simultaneous strategic petroleum reserve releases across member states, representing the largest multilateral emergency drawdown in history. However, the sustainability of this response is increasingly questionable.
Sharenow's assessment frames the timeline starkly: the global system is tightening by 70 to 80 million barrels per week under current conditions. At that pace, the strategic reserve buffer that has absorbed the early months of this disruption will be functionally insufficient within a matter of months, leaving the market structurally exposed to any secondary shock without the usual cushion. Monitoring US crude inventories has therefore become a critical indicator of when this buffer will reach its limits.
Buffer Five: Suppressed Financial Positioning
A less visible but analytically important factor has been the systematic compression of financial risk-taking in oil futures markets. Open interest in Brent crude futures has fallen to its lowest level since August, driven by the combination of extreme price volatility and repeated diplomatic signals from the White House that a peace agreement with Iran is close.
Each time a credible peace signal emerges, bullish traders experience sharp losses on long positions, conditioning the market to avoid large directional bets. The result is a self-reinforcing dynamic where physical tightness cannot fully transmit into futures prices because the financial amplification mechanism has been effectively neutralised by political noise. As The Guardian reports, these diplomatic signals have repeatedly deflated risk premiums at critical junctures.
The Billion-Barrel Deficit That Won't Disappear Overnight
Tom Baker, head of Vitol Bahrain, a unit of the world's largest independent oil trader, articulated a critical long-term risk at a recent industry conference. His central point was that regardless of how quickly Hormuz flows resume, the cumulative supply deficit accumulated over months of disruption represents an enormous volume of oil that is simply absent from global inventory systems.
At a drawdown rate of 70 to 80 million barrels per week, the cumulative deficit since the conflict began represents a volume gap that cannot be instantly reversed even if full strait transit resumes tomorrow. Inventory rebuilding will take between 6 and 18 months at sustainable refill rates, leaving the market structurally vulnerable throughout the recovery period.
| Factor | Impact of Hormuz Reopening |
|---|---|
| Immediate price response | Sharp decline, likely $10–$20/barrel |
| Inventory rebuild timeline | 6–18 months to restore pre-conflict buffer levels |
| Structural demand recovery | Dependent on China's re-entry pace |
| SPR replenishment | Years, not months, at sustainable refill rates |
| Market vulnerability window | Elevated for 12–24 months post-reopening |
Why $100 Functions as Both a Price and a Political Threshold
The psychological significance of the $100 level extends well beyond technical chart analysis. For policymakers, a price below $100 communicates a manageable crisis. A sustained breach above $100, particularly toward the $120 to $140 range, would shift the public and political narrative toward economic emergency, increasing domestic pressure on the White House to accelerate diplomatic resolution regardless of strategic objectives.
This creates an unusual feedback loop in which the price of oil becomes both a market signal and a political instrument. Trump's repeated public assertions that a deal is imminent have consistently deflated the risk premium embedded in futures prices, a form of verbal intervention that carries its own finite credibility ceiling. In addition, the broader trade war oil markets dynamic has amplified uncertainty further, complicating the policy calculus for all parties involved.
Maria Angelicoussis, chief executive officer of the Angelicoussis Group, the largest Greek shipowner by number of vessels on the water, offered a measured perspective in rare public remarks: global commodity prices are elevated by 50 to 60%, Asian LNG prices by approximately 90%, yet the catastrophic price levels many industry participants expected have not materialised.
What Would Break the Current Equilibrium
The Three Triggers Most Likely to Shatter the Price Ceiling
The current sub-$100 equilibrium is not self-sustaining. Three catalysts, individually or in combination, could rapidly dismantle it:
-
China resumes full purchasing rates: A return to pre-conflict Chinese crude imports of 10-plus mb/d would absorb the demand-side buffer that has been offsetting Hormuz losses. This is the highest-probability trigger over a 3 to 6 month horizon.
-
U.S. export capacity exhaustion: If Cushing inventory levels reach operational minimums and domestic refinery competition intensifies, American export volumes will decline involuntarily, removing the world's primary swing supplier from the equation at the worst possible moment.
-
Diplomatic breakdown: The entire financial market dimension of price suppression rests on the credibility of imminent peace negotiations. A sustained deterioration in U.S.-Iran talks, or a clear signal that resolution is months rather than weeks away, would rapidly rebuild the risk premium that has been systematically deflated.
Near-Term Risk Matrix
| Risk Factor | Probability | Potential Price Impact |
|---|---|---|
| China resumes full crude purchasing | Medium-High | +$15–$25/barrel |
| U.S. SPR/export capacity exhausted | Medium | +$10–$20/barrel |
| Diplomatic breakdown | Medium | +$20–$40/barrel |
| Full Hormuz reopening via peace deal | Medium | -$15–$25/barrel |
| Simultaneous demand recovery + supply disruption | Low-Medium | +$50–$100/barrel |
Furthermore, Asian energy import pressures add another layer of complexity to these risk scenarios, particularly given how exposed regional economies remain to any sustained disruption in Persian Gulf supply chains. CNBC Africa has also noted how U.S.-Iran tensions continue to keep traders acutely focused on Hormuz risks, even as headline prices suggest relative calm.
The next major ASX story will hit our subscribers first
Frequently Asked Questions
Why didn't oil prices spike to $200 or $300 after Hormuz was blocked?
Five simultaneous offsets absorbed the majority of the physical supply loss: record U.S. crude and fuel exports, a sharp and unexpected contraction in Chinese demand, alternative Gulf pipeline routing, coordinated multilateral strategic reserve releases, and suppressed futures market positioning driven by diplomatic optimism. No single factor explains why oil prices are below $100 after the Strait of Hormuz closure. It is the convergence of all five operating simultaneously that has kept prices contained.
Is the current price stability sustainable?
No. Global inventories are declining at a record pace. U.S. export capacity is approaching operational limits. Strategic reserves are being depleted faster than they can be replenished. Most serious market analysts view the current stability as a temporary equilibrium dependent on continued diplomatic optimism and Chinese demand restraint, both of which are subject to rapid reversal.
What is the significance of the Cushing, Oklahoma storage hub?
Cushing is the designated delivery point for NYMEX West Texas Intermediate crude futures contracts, making it the most closely watched physical storage location in the global oil market. When Cushing inventory approaches operational minimums, it creates acute price distortions in the futures curve and signals that the physical supply system has very little remaining flexibility to absorb additional disruptions.
Why are futures traders not driving prices higher despite the physical shortage?
Repeated diplomatic signals of an imminent peace deal have created violent price drops each time bullish traders attempt to build large long positions. The combination of extreme volatility and unpredictable political jawboning has made it financially impractical to hold large directional bets in crude oil futures, reducing the financial amplification effect that would normally transmit physical scarcity into higher prices. Consequently, understanding why oil prices are below $100 after the Strait of Hormuz closure demands equal attention to financial market dynamics as it does to physical supply fundamentals.
This article contains forward-looking analysis, market projections, and scenario-based commentary. All figures cited reflect publicly reported data and analyst commentary available as of early June 2026. This content does not constitute financial advice. Commodity markets are subject to rapid change, and actual outcomes may differ materially from any scenarios described.
Want To Stay Ahead of the Next Major Commodity Market Shift?
Discovery Alert's proprietary Discovery IQ model delivers real-time alerts on significant ASX mineral discoveries, transforming complex market data into actionable investment insights — explore historic discoveries and their returns to understand the opportunities that await, and begin your 14-day free trial at Discovery Alert to position yourself ahead of the market.