
August 22, 2026
When Diplomacy Competes With Gunfire: How Oil Markets Navigate Active Conflict
Energy markets have always been efficient processors of uncertainty, but the conditions that defined crude oil trading on July 21, 2026 pushed that efficiency to its conceptual limits. Here was a market simultaneously absorbing active military strikes, retaliatory operations, a naval blockade threat targeting one of the world's largest oil exporters, and a credible ceasefire proposal, all within the same 24-hour window. The result was not a price spike, nor a collapse, but a measured softening that reveals far more about modern energy market architecture than any single-direction move could.
Understanding why oil prices dip as mediation efforts offset US-Iran strikes requires moving beyond headline-level conflict reporting and into the mechanics of how futures markets assign probability weights to competing geopolitical scenarios in real time. For broader context, the crude oil market overview for 2025 provides a useful baseline against which these extraordinary 2026 conditions can be measured.
When big ASX news breaks, our subscribers know first
The Dual-Force Architecture Behind July 21's Price Movement
Crude oil pricing in conflict environments operates through a structure that traders informally call the risk premium layer. This premium sits above the baseline price justified by supply-demand fundamentals and represents the market's collective estimate of the probability that physical supply will be disrupted. When that probability rises, the premium expands. When credible signals of de-escalation emerge, it contracts, regardless of whether actual military activity has ceased.
On July 21, four distinct pressure systems were operating simultaneously:
- Active US strikes on Iranian cities, alongside retaliatory operations by Iran's Revolutionary Guards targeting US military assets across the broader region
- US Central Command's announcement of a fresh round of strikes later in the same trading period
- Yemen's Houthi movement declaring a naval blockade against Saudi Arabia, introducing a second major supply disruption threat
- Tehran's confirmation that it had received a mediator-proposed 10-day ceasefire, designed to preserve the interim diplomatic framework signed on June 17
The fact that downward pressure from the ceasefire proposal was sufficient to offset upward pressure from continued military action reflects a core principle of conflict-era energy pricing: markets do not price what is happening, they price what they expect to happen next.
Benchmark Numbers and What They Actually Communicate
The price movements recorded on July 21 were modest in isolation but meaningful in context. According to reporting from US News, the session illustrated precisely how competing geopolitical forces can suppress dramatic price swings even during active conflict.
| Benchmark | Price (July 21, 2026) | Daily Change | Context |
|---|---|---|---|
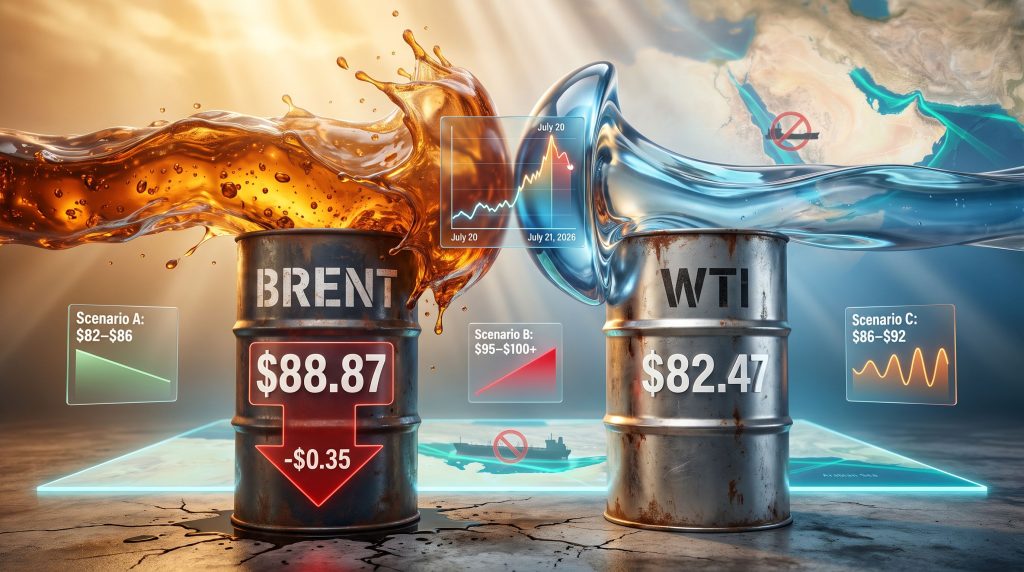
| Brent Crude Futures | $88.87 per barrel | -$0.35 (-0.4%) | Retreating from multi-week highs |
| WTI (September Delivery) | $82.47 per barrel | Broadly flat | Holding fundamental support levels |
Both contracts had reached their highest levels in over a month during the previous session, meaning July 21's softening represented a partial unwind of the risk premium spike, not a trend reversal. The $6.40 spread between Brent and WTI is analytically significant here. Brent, as the globally traded seaborne benchmark, carries a structurally higher sensitivity to Persian Gulf and Red Sea supply disruption. Its larger premium reflects the market's recognition that any physical disruption to Middle Eastern export routes would affect seaborne cargoes, which Brent prices, before it would affect landlocked US production benchmarks.
WTI's relative steadiness on the same day signalled that domestic US supply fundamentals remained broadly intact. A preliminary Reuters poll conducted on July 21 indicated that US crude stockpiles were expected to have declined over the prior week, alongside gasoline inventories, while distillate stocks were projected to have risen. Falling crude and gasoline inventories suggest robust domestic consumption, providing a structural price floor beneath WTI regardless of geopolitical developments abroad.
The Conflict Timeline: Why February 28 Matters as a Starting Point
Proper contextualisation of July 21 requires tracing the full arc of the conflict and its diplomatic counterthread. Furthermore, understanding the trade war impact on oil markets from the prior year helps illuminate how layered geopolitical pressures compound over time.
- February 28, 2026 marked the formal outbreak of the US-Israeli military campaign against Iran, triggering the year's first major oil risk-premium repricing
- June 17, 2026 saw the signing of an interim diplomatic agreement, establishing the first formal ceasefire framework and creating a structural foundation for longer-term negotiations
- Mid-July 2026 brought a renewed cycle of US strikes against Iranian territory alongside Iranian Revolutionary Guard counter-operations against US assets across the region
- July 20, 2026 saw both Brent and WTI reach their highest levels in more than a month, representing peak risk-premium pricing for the current conflict phase
- July 21, 2026 brought simultaneous confirmation of fresh US strikes and Tehran's receipt of a 10-day ceasefire proposal, producing the counterintuitive price softening that defines the current analytical moment
This sequence illustrates what experienced energy traders recognise as a recurring conflict-market pattern: price peaks cluster around maximum uncertainty, while any confirmed diplomatic engagement introduces enough resolution probability to suppress further upside, even when active hostilities continue in parallel.
The Houthi Naval Blockade Threat: An Underpriced Tail Risk
Among the risk factors active on July 21, the Houthi declaration of a potential naval blockade against Saudi Arabia may represent the most consequential and least adequately priced threat in the current environment.
Previous Houthi maritime operations, while disruptive to global shipping through Red Sea commercial interdiction, targeted the broader trade corridor rather than specifically Saudi oil export infrastructure. A declared naval blockade of Saudi Arabia introduces a qualitatively different risk profile for several reasons:
- Saudi Arabia operates production capacity exceeding 12 million barrels per day, making it one of the world's two or three largest crude producers
- Saudi export terminals and tanker routes through the Arabian Sea represent a critical artery for Asian energy importers, particularly India, China, Japan, and South Korea
- A naval interdiction of Saudi export routes would create a supply disruption of a magnitude fundamentally different from anything that previous Houthi operations threatened
- The threat operates as a second, independent risk vector, compounding rather than simply extending the supply disruption risk already present from the US-Iran direct exchange
Tim Waterer, chief market analyst at KCM Trade, characterised this threat as particularly significant precisely because it raises the prospect of disruption to another major exporting nation, extending the conflict's potential impact on global supply chains well beyond Iranian production alone.
Comparing Active Risk Vectors on July 21
| Risk Vector | Primary Market Impact | Current Pricing Status |
|---|---|---|
| US-Iran Military Exchange | Iranian export disruption, Strait of Hormuz risk | Partially priced into recent premium |
| Houthi Naval Blockade (Saudi Arabia) | Saudi export route disruption, Asian supply risk | Largely an unpriced tail risk |
| 10-Day Ceasefire Proposal | Risk-premium compression | Actively compressing near-term upside |
Market Psychology Under Simultaneous Conflict and Diplomacy
The behaviour of crude oil markets on July 21 maps closely onto a four-phase psychological model that energy market analysts use to understand how conflict risk premiums evolve over time. In addition, the oil price movements observed during the 2025 trade war period offer a useful comparative framework for understanding how markets cycle through these phases.
- Phase 1 (Conflict outbreak): Immediate risk premium expansion as supply disruption probability rises sharply and traders position defensively
- Phase 2 (Sustained conflict): Partial premium normalisation as markets recalibrate to a new geopolitical baseline and supply disruption fears stabilise
- Phase 3 (Diplomatic signal): Further premium compression as any credible de-escalation pathway emerges, even without confirmed outcomes
- Phase 4 (Binary resolution): Sharp directional move depending on whether ceasefire or escalation materialises
July 21 represents a textbook Phase 3 dynamic. Tony Sycamore, market analyst at IG, observed that while crude had already moved substantially higher and retained the potential for further gains, the overnight emergence of de-escalation dialogue was functioning as a ceiling on near-term price upside, with the concrete outcome of any diplomatic discussion remaining entirely uncertain at that stage.
Markets on July 21 were not pricing peace. They were pricing the possibility of peace, which is a meaningfully different and considerably more fragile signal.
This distinction matters for positioning. A market pricing confirmed de-escalation would sell off sharply and broadly. A market merely pricing the possibility of de-escalation remains highly reactive to any development that shifts that probability in either direction, making it exceptionally volatile even when headline price movements appear contained.
The next major ASX story will hit our subscribers first
The Strait of Hormuz: The Geographic Chokepoint That Underpins All Risk Calculations
Any analysis of oil prices dipping as mediation efforts offset US-Iran strikes must acknowledge the geographic reality that gives this conflict its outsize market significance. The Strait of Hormuz, the narrow waterway between Iran and the Arabian Peninsula through which approximately 20% of global oil supply transits, represents the single most consequential geographic chokepoint in the global energy system.
Iran's geographic position gives it a structural capability to threaten Hormuz transit, which is why even moderate Iranian military activity generates risk premiums that would be disproportionate if the same conflict were occurring in a landlocked region. The combination of Hormuz risk, Iranian export disruption, and now the Houthi naval blockade threat against Saudi Arabia creates a situation where three separate supply disruption scenarios are simultaneously active, each capable of independently moving oil prices by several dollars per barrel.
That prices softened despite this backdrop is a testament to the weight that a credible diplomatic signal carries in conflict-era energy markets. Consequently, OPEC's influence on oil markets remains an equally important structural force shaping how far either directional move can ultimately travel.
Three Scenarios That Will Define Crude Oil Prices Over the Next 30 Days
Scenario A: Ceasefire Holds and Interim Framework Advances
If Tehran accepts the 10-day ceasefire and the June 17 interim deal survives, markets would likely price a meaningful risk-premium reduction. Brent crude could retreat toward the $82 to $84 range as supply disruption probability diminishes. However, tight US inventories and OPEC+ supply discipline would provide a structural floor, limiting downside.
Scenario B: Diplomatic Collapse and Renewed Escalation
Should the ceasefire proposal fail and military exchanges intensify, particularly if Houthi naval operations against Saudi Arabia become active, the risk premium would expand sharply. Brent crude would likely retest and potentially exceed the $95 per barrel threshold, with WTI tracking toward $88 to $90.
Scenario C: Prolonged Stalemate with Periodic Diplomatic Signals
The most probable near-term outcome involves sustained military activity punctuated by recurring diplomatic overtures without decisive resolution in either direction. In this environment, Brent crude is likely to trade within an $86 to $92 range, with volatility spikes tied to specific military events or negotiation announcements.
| Scenario | Brent Range (30-Day) | Relative Probability | Key Trigger |
|---|---|---|---|
| A: Ceasefire Advances | $82 to $86 | Moderate | Confirmed 10-day pause and deal preservation |
| B: Escalation Intensifies | $95 to $100+ | Lower but rising | Houthi naval action or Hormuz interdiction |
| C: Prolonged Stalemate | $86 to $92 | Highest | No breakthrough, no catastrophic escalation |
What US Inventory Data Reveals Beneath the Geopolitical Noise
A dimension of the July 21 price environment that receives insufficient analytical attention is the role of US supply-demand fundamentals as an independent price determinant operating beneath the geopolitical risk layer. This geopolitical oil price analysis from 2025 demonstrates how consistently inventory data can cut through geopolitical noise to anchor longer-term price direction.
The preliminary Reuters poll released that Monday indicated three distinct inventory signals:
- US crude oil stockpiles were expected to have declined over the prior week, indicating that production or import volumes were not keeping pace with refinery demand
- Gasoline inventories were also projected lower, consistent with robust summer driving season consumption
- Distillate stocks were anticipated to have risen, suggesting some moderation in industrial and commercial fuel demand
The combination of declining crude and gasoline inventories creates what traders call a fundamental bid, a price support level that exists independent of geopolitical risk pricing. Even in a scenario where diplomatic progress substantially compresses the Middle Eastern risk premium, this fundamental bid would likely prevent a sharp price collapse, establishing a natural floor beneath WTI and, by extension, Brent.
This dynamic is particularly relevant for Asian energy importers, who face a double exposure: both the geopolitical supply risk premium and the underlying tight fundamentals driving structural price support.
Strategic Implications for Energy Market Participants
Traders and fund managers operating in this environment face a market that rewards scenario-based positioning over directional conviction. Binary outcome risk, where ceasefire or escalation produces sharply divergent price paths, creates conditions where volatility instruments and options strategies may offer better risk-adjusted returns than outright long or short futures positions.
Energy-importing nations, particularly across Asia where crude import dependency is structurally high, face meaningful budget and energy security risks if the escalation scenario materialises. Forward contract hedging and strategic petroleum reserve utilisation planning become increasingly prudent tools as Scenario B probability edges upward.
Policy analysts and energy security researchers should note that the current conflict configuration represents a qualitatively novel risk profile. The simultaneous activation of Persian Gulf military risk, Strait of Hormuz interdiction threat, and Arabian Sea naval blockade risk creates a multi-theatre supply disruption scenario. Existing energy security frameworks, largely designed around single-theatre conflicts, may not adequately model this complexity. For a real-time read on how these forces are being priced, Brent crude futures tracking remains an essential tool for market participants.
Furthermore, analysis from Global Banking and Finance confirms that Asian equity markets, often sensitive to regional energy cost pressures, rose in response to the same mediation signals that took oil lower on July 21, illustrating how diplomatic signals ripple across multiple asset classes simultaneously.
The July 21 episode confirms that in modern conflict-era energy markets, diplomatic signals and military actions carry approximately equal and opposite market weight, at least in the short term. The currency of de-escalation has never been more valuable, or more fragile.
Disclaimer: This article is intended for informational and analytical purposes only and does not constitute financial or investment advice. Crude oil price forecasts and scenario projections involve inherent uncertainty. Readers should conduct independent research and consult qualified financial advisers before making any investment decisions. All price figures and event timelines referenced are sourced from publicly available reporting as of July 21, 2026.
Want to Stay Ahead of Significant Mineral Discoveries on the ASX?
While geopolitical forces shape commodity markets globally, Discovery Alert's proprietary Discovery IQ model cuts through the complexity by delivering real-time alerts on significant ASX mineral discoveries — explore the historic returns major discoveries have generated and begin your 14-day free trial today to position yourself ahead of the broader market.