June 17, 2026
Commodity Markets and the Psychology of Risk Repricing
Every major commodity market carries within its price structure two distinct components: the fundamental value derived from supply and demand mechanics, and a risk premium layered on top to compensate for uncertainty. When that uncertainty collapses suddenly, the repricing can be swift, disorderly, and sometimes disconnected from physical reality. That tension sits at the heart of understanding why oil prices fall after the US-Iran peace deal and Strait of Hormuz reopening became the defining market story of June 2026.
The crude oil market's reaction on June 15, 2026, was not simply about pipeline flows resuming or tankers changing course. It was about the unwinding of a deeply embedded geopolitical risk premium that had been accumulating for over three months, since the Strait of Hormuz, one of the most strategically critical waterways on the planet, was effectively shut to commercial energy traffic.
When big ASX news breaks, our subscribers know first
The Strait of Hormuz: Why This 33-Kilometre Passage Controls Global Energy
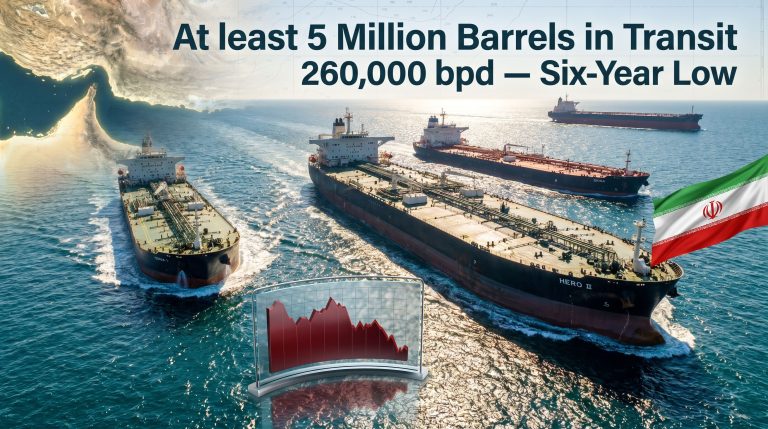
To appreciate the scale of the disruption, it helps to understand precisely what the Strait of Hormuz represents in the architecture of global energy supply. At its narrowest point, this waterway between Iran and Oman stretches just 33 kilometres across, yet it serves as the transit corridor for approximately one-fifth of the world's oil and liquefied natural gas (LNG) supply.
Furthermore, the closure of the Strait for more than three months meant that global LNG supply chains were severely disrupted across multiple regions. Specifically, the following consequences unfolded:
- Millions of barrels of crude oil and gas were effectively removed from global supply chains daily
- Middle Eastern producers including Saudi Arabia, Iraq, Kuwait, and the UAE faced severe export constraints
- LNG flows to energy-dependent economies across Asia and Europe were drastically curtailed
- By June 15, only one LNG tanker had passed through the Strait following the initial peace agreement, as commercial shipping operators remained cautious about re-entry
The chokepoint nature of the Strait is not a modern vulnerability. It has been central to energy security calculations since the 1970s. What made the 2026 closure exceptional was its duration: previous Hormuz disruption events have typically lasted days or weeks, not months. The extended closure fundamentally restructured global energy pricing, creating a sustained risk premium baked into every barrel of Brent crude traded internationally.
How the US-Iran Peace Agreement Was Structured
The initial agreement announced in June 2026 was described as a memorandum of understanding, with a formal signing ceremony scheduled in Switzerland. Pakistan served as a diplomatic mediator throughout the negotiation process, a detail that reflects the increasingly multipolar nature of conflict resolution in the modern era.
Key structural elements of the arrangement included:
- Iran's commitments targeted a Strait of Hormuz reopening within 30 days of the formal signing
- A 60-day ceasefire framework was established to allow negotiation of a more comprehensive and permanent agreement
- The US announced that its naval blockade of Iranian ports would be lifted as part of the arrangement
- The E4 nations (the United Kingdom, France, Germany, and Italy) indicated their readiness to lift sanctions on Iran, conditional on verifiable steps regarding its nuclear program
The involvement of the E4 nations introduces a significant additional dimension. European sanctions relief is contingent on nuclear compliance measures, meaning the full economic normalisation of Iran's energy sector is tied not only to ceasefire durability but also to the pace of nuclear negotiations within that 60-day window.
The memorandum of understanding establishes a pathway rather than an immediate resolution. The 30-day reopening timeline and 60-day negotiating window create overlapping deadlines that markets will monitor with intense scrutiny.
The Price Collapse in Numbers: What Markets Priced In on June 15
The immediate market response on June 15, 2026, was unambiguous. Both major crude benchmarks recorded their sharpest single-day declines in months. According to reporting from the Wall Street Journal, the scale of the move surprised even seasoned commodities traders.
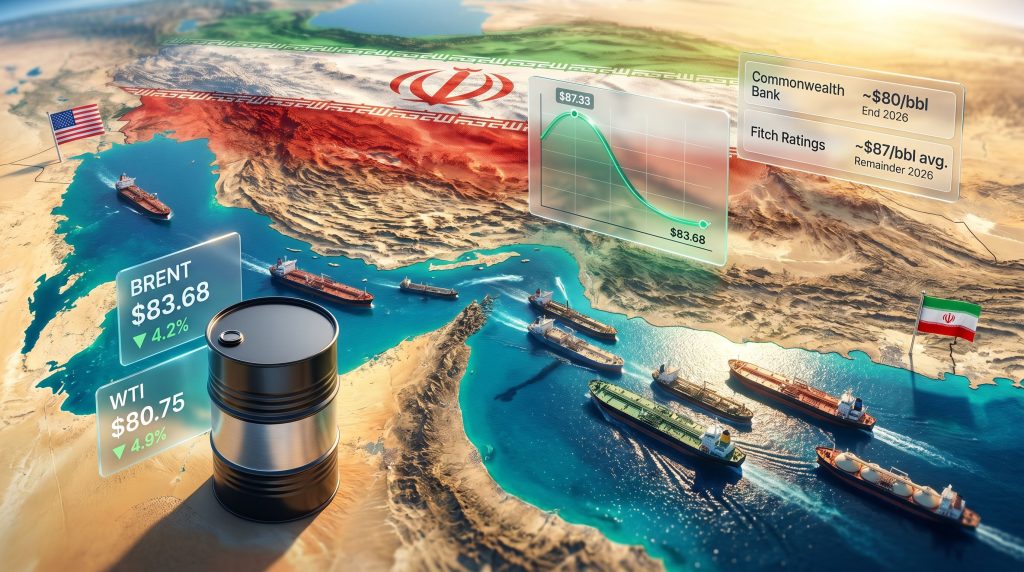
| Benchmark | Pre-Deal Price (Approx.) | Post-Deal Price | Change ($) | Change (%) | 3-Month Low Since |
|---|---|---|---|---|---|
| Brent Crude | ~$87.33 | $83.68 | -$3.65 | -4.2% | March 10, 2026 |
| WTI (US Crude) | ~$84.88 | $80.75 | -$4.13 | -4.9% | March 10, 2026 |
Critically, both contracts had already dropped more than 3% on the Friday prior to the official announcement, suggesting that market participants had begun pricing in a diplomatic resolution before it was formally confirmed. This front-running behaviour is consistent with how commodity markets typically respond to geopolitical developments, where information asymmetry and political signals often precede public announcements.
Tim Waterer, chief market analyst at KCM Trade, noted that the geopolitical risk premium embedded in crude pricing was being unwound aggressively by traders who were pricing in the prospect of restored oil flows (Arab News, June 15, 2026). Consequently, the crude oil price trends that had defined the prior quarter were sharply reversed within hours.
Why the Market May Be Running Ahead of Physical Reality
Financial markets price expectations, not present conditions. That distinction matters enormously in the current situation, because the diplomatic agreement and the physical normalisation of oil supply are operating on entirely different timelines.
Several practical obstacles stand between the peace deal and restored supply:
- Naval mine clearance: The Strait is reported to require 30 to 45 days of mine clearance operations before commercial shipping can safely resume at scale
- Tanker operator hesitancy: Even after formal clearance, commercial shipping companies are likely to remain cautious, as reflected by only a single LNG vessel having passed through the Strait as of June 15
- Infrastructure damage: Physical damage to oil production and export infrastructure across the Middle East cannot be reversed quickly. Wellheads, pipeline systems, and terminal facilities that sustained damage during the conflict will require assessment and repair before production ramp-up is possible
- Backlog normalisation: Three months of suppressed exports creates a logistical sequencing challenge as producers attempt to restore market share simultaneously
Priyanka Sachdeva, senior market analyst at Phillip Nova, emphasised that while hostilities may have ceased, the cumulative damage to physical oil infrastructure and the economic burden carried by oil-importing nations over the preceding months cannot simply be erased by a diplomatic signature (Arab News, June 15, 2026).
The 60-70% Threshold: A Little-Known Market Reset Mechanism
One of the more technically precise insights to emerge from analyst commentary concerns the specific supply recovery level needed to shift market dynamics. Vivek Dhar, commodities strategist at Commonwealth Bank of Australia, identified that oil flows through the Strait of Hormuz need only recover to 60 to 70 percent of pre-war levels to return global oil markets to the oversupply conditions that characterised the period before the conflict (Arab News, June 15, 2026).
This threshold is significant for several reasons. It means:
- Full physical recovery is not required to fundamentally change the supply-demand balance
- Even a partial and gradual reopening could be sufficient to push Brent toward the $80/bbl target that Commonwealth Bank has projected for end of 2026
- The bar for market normalisation is lower than many commentators assume, which partly explains the scale of the immediate price response
In addition, the market volatility reset dynamics observed across broader financial markets throughout this period reflect similar threshold-driven repricing behaviour, where sentiment can shift dramatically on partial rather than complete resolution.
The next major ASX story will hit our subscribers first
Institutional Price Forecasts: Where Analysts See Brent Heading
| Institution | Forecast | Timeframe | Key Assumption |
|---|---|---|---|
| Commonwealth Bank of Australia | ~$80/bbl (Brent) | End of 2026 | Hormuz flows reach 60-70% of pre-war levels |
| Fitch Ratings | ~$87/bbl average | Remainder of 2026 | Surplus returns by September 2026 |
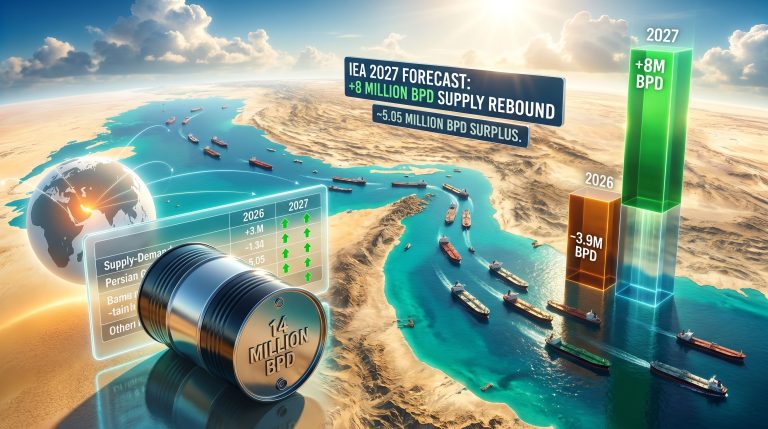
Fitch Ratings has projected that global oil markets will return to a surplus condition by September 2026, which would represent a complete reversal of the supply scarcity dynamics that drove prices higher during the conflict period. The divergence between the two institutional forecasts reflects genuine uncertainty about the pace of supply restoration rather than any fundamental disagreement about direction.
Investors should note that these forecasts represent conditional projections based on assumptions that may not materialise. Actual price outcomes will depend heavily on compliance with the agreement, the pace of mine clearance, and the behaviour of tanker operators.
Why Retail Gasoline Prices Remain Stubbornly High
Despite the sharp decline in crude futures, US retail gasoline prices remained at approximately $4.07 per gallon on June 15, still 36% above February 2026 levels. This disconnect between the crude market and consumer prices reflects well-established structural lags in petroleum product pricing.
The transmission mechanism from crude price declines to pump prices involves several sequential steps:
- Crude futures decline in financial markets
- Physical crude purchase prices adjust for refiners (typically with a 1 to 2 week lag)
- Refinery processing and product output adjusts
- Wholesale gasoline prices shift
- Retail station pricing responds (final lag of 2 to 4 weeks from the initial crude move)
Additionally, three months of elevated energy costs have created pricing inertia across distribution chains. Inventory purchased at higher prices must be worked through before lower-cost crude translates into meaningfully lower pump prices.
Scenario Modelling: Three Possible Paths for Oil Markets in H2 2026
Scenario A: Smooth Normalisation (Base Case)
The Strait reopens within the agreed 30-day window. Flows recover to approximately 65% of pre-war levels by August. Brent settles in the $78 to $83/bbl range by Q4 2026, consistent with a return to pre-war oversupply conditions by September.
Scenario B: Delayed Normalisation (Moderate Disruption)
Mine clearance and infrastructure repair extends beyond 45 days. Tanker operators remain cautious, and flows reach only 40 to 50% of pre-war levels by August. Brent stabilises in the $84 to $89/bbl range through Q3 2026. US retail gasoline remains above $3.80 per gallon through the summer driving season.
Scenario C: Agreement Breakdown (Tail Risk)
The ceasefire collapses during the 60-day negotiating window. The Strait remains effectively closed or partially restricted. Brent re-prices toward $92 to $97/bbl, and global recession risk re-emerges as energy import costs surge for oil-dependent economies across Asia and Europe.
Key Risk Factors That Could Reshape the Outlook
| Risk Factor | Probability | Market Impact if Triggered | Timeline |
|---|---|---|---|
| Agreement implementation failure | Medium | Brent rebounds sharply above $90 | 30-60 days |
| Slower-than-expected supply restoration | High | Prices stabilise above $85 | 30-90 days |
| Tanker re-entry delays | High | LNG and crude premiums persist | 2-6 weeks |
| Nuclear compliance dispute | Medium | Sanctions reimposed, supply shock | 60-90 days |
| Regional political escalation | Low-Medium | Geopolitical premium re-priced | Variable |
It is worth noting that Israeli far-right political factions have already publicly opposed the US-Iran arrangement, creating a potential source of regional pressure that could complicate implementation. The geopolitical trade tensions surrounding this agreement are, however, consistent with broader patterns that have defined global energy markets in recent years. The linkage between sanctions relief and nuclear compliance also means the E4 nations' participation introduces a second set of verification requirements that run parallel to the ceasefire timeline.
Broader Market Implications Beyond Crude Oil
The energy price decline had immediate positive spillover effects across global equity markets on June 15. Sectors carrying the heaviest exposure to elevated energy input costs, including commercial aviation, ocean freight, industrial manufacturing, and petrochemical production, responded positively to the prospect of normalising fuel costs.
However, energy sector equity investors face a more complex calculation. Lower oil prices benefit consumers and energy-intensive industries but compress margins for oil producers and service companies. The oil trade and geopolitics dimension of this situation means the speed and shape of the supply recovery will be the critical variable determining whether energy equities reprice further downward or stabilise as production volumes compensate for lower per-barrel realisations.
Frequently Asked Questions
Why did oil prices fall after the US-Iran peace deal?
The deal signalled the potential end of a three-month disruption to Hormuz oil flows. Traders rapidly unwound the geopolitical risk premium embedded in crude prices, driving Brent down 4.2% and WTI down 4.9% on June 15. Oil prices plunging on the back of the deal were reported widely across energy media as one of the most significant single-day moves of the year.
How long will it take for the Strait of Hormuz to fully reopen?
The agreement targets reopening within 30 days under Iranian arrangements, but mine clearance operations and tanker operator caution mean physical normalisation could extend 30 to 45 days beyond that.
What percentage of global oil supply passes through the Strait of Hormuz?
Approximately one-fifth of the world's combined oil and LNG supply transits through the Strait under normal conditions.
Will petrol and gas prices fall at the pump immediately?
No. Retail fuel prices typically lag crude market moves by two to four weeks due to refinery, wholesale, and distribution chain delays. US retail gasoline remained at $4.07 per gallon on June 15 despite the crude price decline.
What happens to oil markets if the US-Iran deal collapses?
Analysts estimate Brent could re-price to $92 to $97 per barrel in a breakdown scenario, reversing the June 15 decline and potentially triggering further economic strain for oil-importing nations.
What is the current Brent crude price forecast for end of 2026?
Commonwealth Bank of Australia targets approximately $80 per barrel, while Fitch Ratings projects an average of around $87 per barrel for the remainder of 2026, contingent on supply normalisation materialising broadly as expected.
Disclaimer: This article contains forward-looking statements, analyst forecasts, and scenario projections that are inherently uncertain. Nothing in this analysis constitutes financial or investment advice. Commodity prices are subject to significant volatility, and actual outcomes may differ materially from any projections referenced. Readers should conduct their own research and consult qualified financial advisors before making investment decisions.
Want to Stay Ahead of the Next Major Commodity Market Shift?
Discovery Alert's proprietary Discovery IQ model delivers real-time alerts on significant ASX mineral discoveries, transforming complex market data into actionable investment insights for both short-term traders and long-term investors — explore historic examples of major discovery returns to understand the scale of opportunity, and begin your 14-day free trial at Discovery Alert to position yourself ahead of the market.