June 19, 2026
The Futures Market Already Moved On. The Tankers Have Not.
There is a peculiarity embedded in how global oil markets process geopolitical shock that most casual observers miss entirely. Physical supply disruptions and price direction are not the same thing, and they frequently move in opposite directions at precisely the moments when intuition suggests they should align. The phenomenon of oil prices falling despite trapped tankers in Hormuz is not a market malfunction. It is a demonstration of how futures pricing mechanisms actually work, and understanding that distinction matters enormously for anyone trying to read crude benchmarks during periods of geopolitical turbulence.
Oil futures markets are expectation-pricing engines. They do not track barrels in real time. They price the probabilistic distribution of future supply scenarios, weighted by whatever diplomatic, military, or economic signals traders are processing at any given moment. When a ceasefire agreement is signed, traders do not wait for the first tanker to clear the strait before adjusting positions. They begin unwinding the risk premium the moment credible resolution signals emerge, regardless of whether a single additional barrel has physically moved.
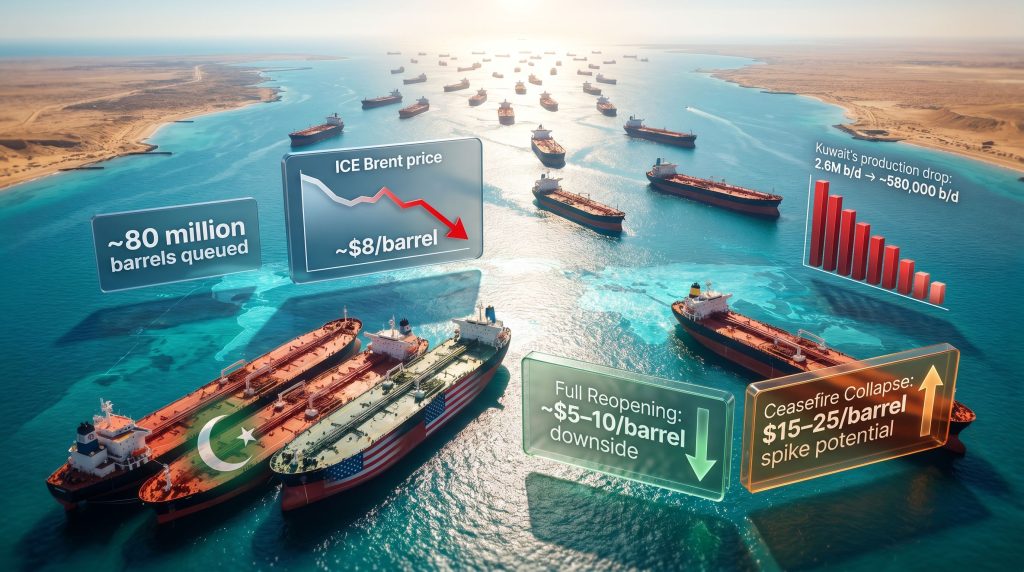
This is the core dynamic that explains why ICE Brent fell approximately $8 per barrel on a week-on-week basis following the U.S.-Iran ceasefire agreement, even as an estimated 80 million barrels of crude remained queued and unable to transit the Strait of Hormuz. Furthermore, the interplay between trade and geopolitics continues to define how quickly these pricing corrections occur.
When big ASX news breaks, our subscribers know first
Understanding the Geopolitical Risk Premium and Why It Collapses So Fast
Every barrel of crude traded during a period of supply-route uncertainty carries an embedded premium above its fundamental value. This is the geopolitical risk premium, and it functions as a real-time pricing mechanism for conflict probability. During peak disruption scenarios involving Hormuz, this premium can range from $5 to over $20 per barrel, depending on the perceived duration and severity of the closure.
The mechanism works asymmetrically. Risk premiums accumulate gradually as tensions escalate, but they can collapse within hours once a credible diplomatic signal reaches the market. A signed memorandum of understanding, even one covering a finite 60-day evacuation window, is sufficient to trigger rapid premium unwinding. Traders are not waiting for certainty. They are pricing probability-weighted outcomes, and a ceasefire shifts those probabilities decisively toward normalization.
This creates the counterintuitive scenario that defines the current market: prices fall while tankers remain anchored, because the market has already moved to price the world as it expects it to be in 30 to 60 days, not the world as it is today. Consequently, the broader oil market impact of these diplomatic developments is felt almost instantly across futures exchanges.
Key mechanism: The geopolitical risk premium is asymmetric by design. It builds slowly during escalation and collapses rapidly on diplomatic signals, generating sharp downward price moves even when physical conditions remain constrained.
The Scale of the Hormuz Disruption: What the Data Actually Shows
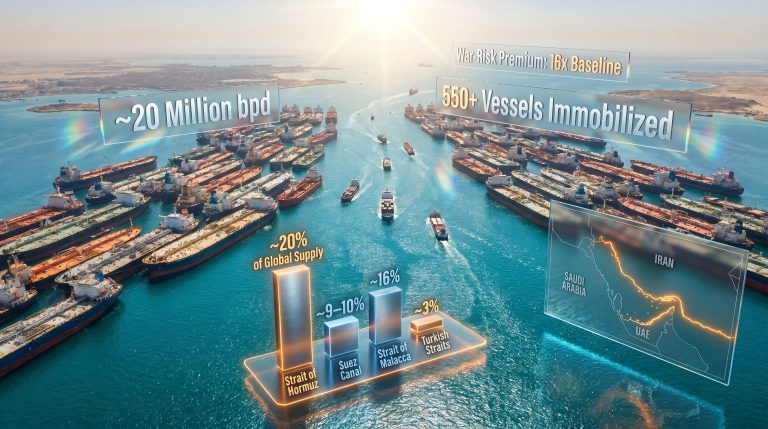
The Strait of Hormuz is not simply important to global oil markets. It is the single most critical chokepoint in the entire global energy supply chain. Under normal operating conditions, approximately 20 to 21% of all globally traded oil transits the strait daily, connecting Persian Gulf producers including Saudi Arabia, Iraq, Kuwait, the UAE, and Iran to export markets across Asia, Europe, and beyond. For a detailed breakdown of the strait's strategic role, eight charts from CSIS illustrate just how central this waterway is to global energy security.
The disruption that began in early 2026 produced measurable and severe consequences across every major producer in the region.
| Metric | Data Point |
|---|---|
| Crude queued for exit | ~80 million barrels |
| Kuwait production at trough | ~580,000 b/d (down from 2.6 million b/d) |
| Iraq Basra output recovery | ~900,000 b/d rising to ~1.5 million b/d |
| Ceasefire evacuation window | 60 days |
| Iranian tankers resuming transit | 3 vessels (~5 million barrels aggregate) |
| ICE Brent weekly price decline post-ceasefire | ~$8/barrel |
| Pakistan peak coal generation (May 2026) | 4.28 GW (all-time high) |
| U.S. crude inventory drawdown (9 weeks) | ~52 million barrels |
The regional impacts were not uniform. Kuwait experienced one of the most severe production collapses of any Gulf producer, falling from 2.6 million b/d to approximately 580,000 b/d at the trough before lifting force majeure measures on all upstream operations. Iraq's southern fields, which represent the country's primary export corridor, dropped sharply before Basra Oil Corp. began ramping output back toward 1.5 million b/d.
Iran's crude exports were effectively halted by a U.S. naval blockade for approximately two months before three tankers carrying a combined 5 million barrels transited the Gulf of Oman to mark the first resumption of flows.
Beyond crude, Qatar's LNG export capacity was severely disrupted, triggering cascading energy shortages across import-dependent nations. Pakistan, unable to receive its usual LNG deliveries from Qatar during peak summer heat of 45 to 50 degrees Celsius, pivoted to coal generation at a record pace, with average coal power output reaching 4.28 GW in May alone.
Five Reasons Prices Fell Despite the Backlog
The decline in crude benchmarks amid a physically unresolved supply disruption is not arbitrary. Five distinct mechanisms drove prices lower in parallel.
1. The ceasefire signal destroyed the risk premium
The moment the U.S.-Iran ceasefire MoU was signed, traders began pricing the anticipated normalisation of Hormuz transit rather than the current physical blockage. The 60-day evacuation window provided a credible resolution timeline, and markets moved immediately to discount that outcome.
2. Strategic petroleum reserve activity cushioned supply gaps
Nations including Germany began evaluating extensions to oil reserve relief programmes throughout the disruption. Strategic reserve drawdowns reduce the urgency of physical supply replacement, dampening upward price pressure even when inventories are tightening.
3. Full closure was never achieved
Some tanker movements continued throughout the disruption under varying conditions. Markets interpreted partial flow continuity as evidence the disruption was less severe than a total blockade, reducing the probability weighting on worst-case supply scenarios.
4. Inventory drawdowns were absorbed without crisis
U.S. crude inventories declined by approximately 52 million barrels over nine weeks, a substantial figure. However, this drawdown did not push inventory levels to critically low thresholds that would force panic buying or trigger a supply emergency response.
5. Forward supply expectations overwhelmed current scarcity
The IEA projected a significant oil surplus forming by 2027 as Middle East supply returns to market. OPEC demand forecasts for 2026 projected demand growth of 8 million b/d between now and 2030, with peak consumption of approximately 124 million b/d by 2050. These forward-looking frameworks framed the current disruption as temporary, anchoring bearish price expectations beyond the immediate crisis.
The Sovereignty Ambiguity That Markets May Be Underpricing
Here is where the narrative becomes more nuanced than the price action suggests. Tehran's announcement that vessels crossing the Strait of Hormuz still require permission from the Persian Gulf Strait Authority introduces a structural ambiguity into what markets are treating as a clean reopening story.
This is not a minor administrative footnote. If Iran enforces active transit permission requirements, it retains a powerful lever over global oil flows even within the ceasefire framework. This could evolve over time into a tolling mechanism, a selective denial capability, or a negotiating chip if the 60-day window lapses without a longer-term agreement.
Analyst consideration: Markets are currently pricing the most optimistic reopening scenario. The critical question is not whether Hormuz reopens, but on whose terms and at what pace. Iran's transit authority assertion represents a residual risk premium that the current price action has not fully incorporated.
Scenario Modelling: Three Pathways for Hormuz Traffic
| Scenario | Assessment | Price Implication |
|---|---|---|
| Full Reopening within 60 days, all backlogged tankers transit unconditionally | Moderate probability | Bearish: $5-10/barrel downside as 80M+ barrels flood market |
| Partial Reopening with Iran enforcing selective permission requirements | Moderate-High probability | Neutral to mildly bullish: residual risk premium sustained |
| Ceasefire Collapse driven by Israel-Lebanon escalation or Iranian reassertion | Lower but non-trivial | Sharply bullish: $15-25/barrel spike potential |
Goldman Sachs has flagged that Hormuz traffic may never fully recover to pre-disruption levels even in a full reopening scenario. The reasons are structural rather than diplomatic.
Structural Rerouting: The Changes That Will Outlast the Crisis
One of the most underappreciated dimensions of the Hormuz disruption is the degree to which it has accelerated permanent structural changes in Gulf oil trade flows. In addition, these shifts are redefining how nations approach long-term energy security planning.
Iraq's Syria corridor represents the clearest example. Baghdad is targeting 50,000 b/d of crude exports through Syrian territory from July onward, building on fuel oil and naphtha diversions already underway. Crucially, Iraqi officials have indicated they intend to develop this corridor regardless of whether the U.S.-Iran ceasefire holds. This is a strategic hedge, not a temporary workaround.
India's import recalibration is equally significant. Despite Hormuz reopening, India has signalled it is not rushing back to Middle Eastern crude, reflecting a deliberate diversification of import sourcing that may persist structurally. India received its first post-deal LNG cargo through Hormuz, but the broader crude trade relationship is being reassessed at a supply chain architecture level.
Saudi Aramco's storage expansion strategy points in the same direction. Aramco is actively seeking to develop additional international crude storage capacity following the conflict, with existing tank farm operations in South Korea, Japan, and Egypt under evaluation for expansion. This positions the world's largest oil producer to manage price volatility and supply reliability independently of Hormuz transit conditions.
War-risk insurance costs are adding a persistent financial friction to the reopening. Insurers rolled out a $400 million war-risk facility for Hormuz shipping during the disruption. Even after a ceasefire, elevated insurance premiums increase the cost of Hormuz transit and create a financial incentive to use alternative routes wherever viable.
The next major ASX story will hit our subscribers first
Secondary Energy Markets: The Ripple Effects Beyond Crude
The disruption's impact extended well beyond crude oil benchmarks, reshaping energy markets across multiple sectors and geographies.
| Market | Disruption Impact | Response |
|---|---|---|
| Pakistan energy grid | Qatar LNG disrupted; coal generation hit record 4.28 GW in May | Pivoted to coal imports |
| India LNG | First post-deal cargo received through Hormuz post-ceasefire | Cautious re-engagement with Middle Eastern supply |
| European energy markets | ECB noted Iran peace deal alone insufficient to erase energy price shock | Germany evaluating extended reserve relief |
| China coal | 150+ Shanxi mines shut; coking coal imports set to rise | Import diversification toward Canada and Australia |
| Russia oil exports | Reached 6 million b/d in May; U.S. sanctions waiver allowed to expire June 17 | Increased pressure as Iranian supply returns |
The high fuel prices generated during the disruption also accelerated demand-side structural shifts that will outlast the crisis itself. EV adoption in Europe accelerated meaningfully as retail fuel prices surged. China's gasoline car market contracted sharply. These are not cyclical responses. They are structural inflection points driven by price signals, and they will affect long-term oil demand trajectories in ways that OPEC's market influence may not fully capture in current projections.
Equinor's strategic pivot is instructive here. Rather than doubling down on energy transition commitments during a period of elevated fossil fuel prices, the Norwegian state energy company moved decisively in the opposite direction, allocating 90% of capital expenditure to oil and gas, up from a 50% target just one year prior. This signals that at least some major producers believe elevated oil demand will persist long enough to justify major upstream capital allocation.
The Inventory Signal That Complicates the Bearish Case
There is a contrarian reading of the current market that deserves serious attention, particularly for investors and analysts focused on physical supply fundamentals rather than futures pricing dynamics.
U.S. crude inventories fell by approximately 52 million barrels over nine weeks during the disruption period. This is a substantial drawdown by any historical standard, and it suggests underlying demand remained robust throughout the crisis. If the Hormuz reopening proceeds more slowly than markets currently anticipate, or if Iran's transit authority assertion translates into active enforcement, this inventory deficit could reassert meaningful upward price pressure.
The ECB has explicitly warned that an Iran peace deal alone will not erase Europe's energy price shock, underscoring that the secondary price effects of the disruption are not simply reversible upon diplomatic resolution. TotalEnergies has flagged that a key Saudi refinery will not fully recover until 2027, adding a downstream supply constraint that crude price benchmarks alone do not capture.
Ukraine's ongoing drone strikes on Russian refinery infrastructure, including a recent attack on a 240,000 b/d Moscow facility, introduce additional supply-side uncertainty that the market is absorbing without fully pricing into forward curves. Furthermore, the geopolitical supply risks associated with these compounding pressures remain a key variable for traders watching forward curves.
Contrarian indicator: While crude benchmarks have declined sharply post-ceasefire, the 52-million-barrel U.S. inventory drawdown over nine weeks suggests physical market tightness remains real. If the reopening disappoints, this underlying deficit could reassert itself quickly.
What This Tells Us About How Oil Markets Actually Work
The Hormuz paradox — oil prices falling despite trapped tankers in Hormuz — is ultimately a masterclass in the distinction between physical markets and financial markets, and the complex relationship between them. However, as Al Jazeera's market coverage illustrates, even well-signalled diplomatic developments can fail to move markets when traders have already priced in the outcome.
Several analytical conclusions emerge from this episode:
- Expectation pricing dominates physical reality in near-term crude benchmarks. The most important variable is not current supply but the market's probabilistic assessment of future supply trajectory.
- Risk premiums are structurally asymmetric. They accumulate during escalation and collapse rapidly on diplomatic signals, creating sharp downward moves that can appear disconnected from physical conditions.
- Structural rerouting decisions have lasting consequences. Iraq's Syria corridor, India's import diversification, and elevated war-risk insurance costs will reshape Gulf oil trade flows for years beyond the immediate crisis window.
- Inventory data is a lagging but powerful contrarian signal. A 52-million-barrel drawdown in nine weeks represents genuine physical tightness that the futures market may be underweighting.
- The reopening narrative is not binary. Iran's transit authority assertion means there is a spectrum of reopening outcomes between full normalisation and renewed closure, and the current price action is pricing only the most optimistic point on that spectrum.
This article is for informational and educational purposes only and does not constitute financial, investment, or trading advice. Forecasts, scenario projections, and price estimates discussed herein involve significant uncertainty and should not be relied upon as the basis for investment decisions. Readers should consult qualified financial advisors before making any investment decisions. For real-time crude benchmarks and ongoing coverage of Hormuz developments, visit OilPrice.com, which provides live price data and expert energy market analysis.
Want to Stay Ahead of the Next Major Resource Discovery Triggered by Energy Market Shifts?
Discovery Alert's proprietary Discovery IQ model instantly identifies significant ASX mineral discoveries — including those in energy commodities — delivering real-time alerts that translate complex market data into actionable opportunities, much like the structural shifts reshaping global oil trade flows explored above. Explore historic discoveries and their exceptional returns, then begin your 14-day free trial to position yourself ahead of the broader market.