July 10, 2026
The Geometry of Vulnerability: How a 33-Kilometre Chokepoint Holds the World to Ransom
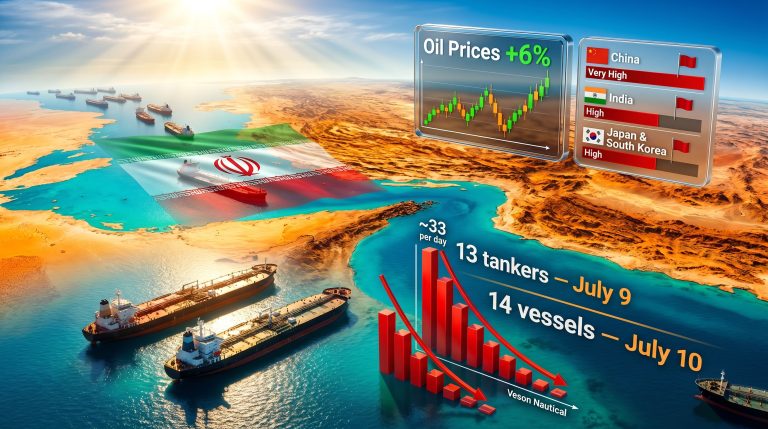
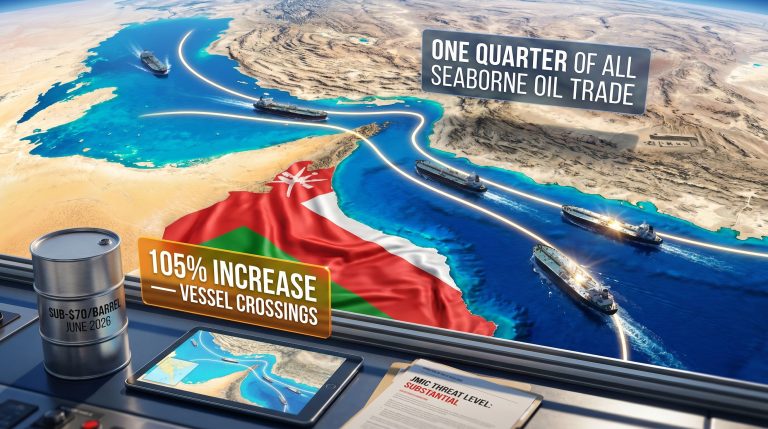
Every few years, global energy markets are reminded of a fundamental structural truth: the modern oil supply chain was never designed for resilience. It was designed for efficiency. And efficiency, by its nature, concentrates risk. Nowhere is that concentration more dangerous than at the Strait of Hormuz, a narrow corridor between Oman and Iran where roughly one-fifth of all globally traded oil passes through waters barely 33 kilometres wide at their narrowest navigable point. Oil prices rally on renewed Hormuz supply risks whenever this corridor faces disruption, and the consequences ripple immediately across global markets.
When that corridor faces disruption — whether through military escalation, threatened vessel attacks, or the revocation of diplomatic agreements — oil markets do not wait for confirmation. They price the risk immediately, aggressively, and sometimes in excess of what the underlying fundamentals justify. That is precisely what happened during the week ending July 10, 2026, when oil prices staged one of their sharpest weekly recoveries in months, driven almost entirely by renewed fears over Hormuz supply security.
When big ASX news breaks, our subscribers know first
The Strait of Hormuz: Anatomy of an Irreplaceable Chokepoint
What Makes Hormuz Structurally Irreplaceable
The Strait of Hormuz sits between the Persian Gulf and the Gulf of Oman, forming the only sea passage out of the Persian Gulf for crude oil exports from Saudi Arabia, Iraq, Iran, Kuwait, the UAE, Qatar, and Bahrain. Unlike most maritime chokepoints, Hormuz has no realistic peer in terms of volume concentration. Understanding OPEC's global oil influence helps explain why any disruption at this point carries such outsized consequences for the entire energy complex.
The navigable shipping lanes within the strait are surprisingly thin. Tankers operate within two-mile-wide inbound and outbound lanes, separated by a two-mile buffer zone. A single disabled supertanker, a naval confrontation, or even a credible threat of mine deployment is enough to trigger a cascade of rerouting decisions across global shipping networks.
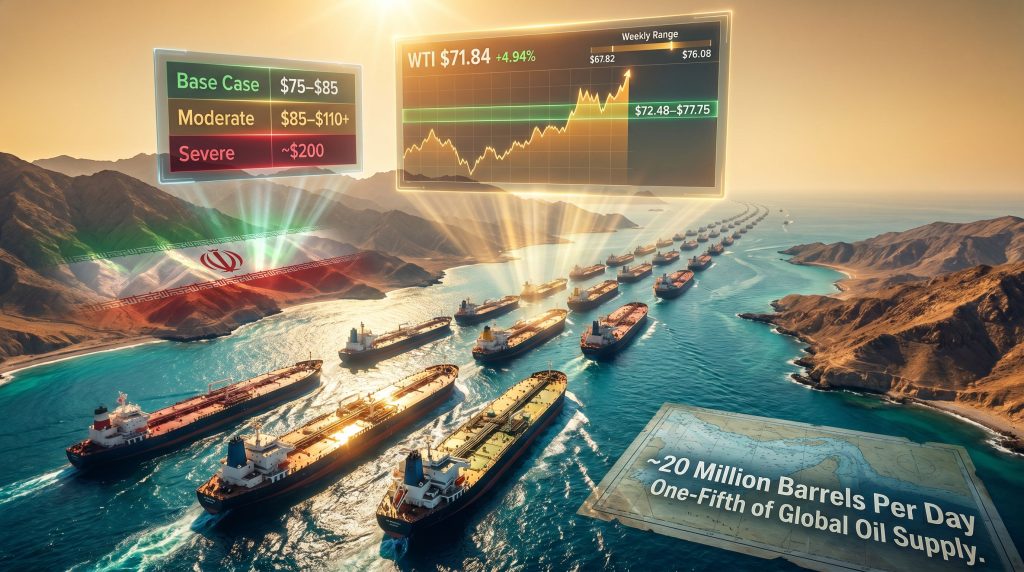
Key Fact: Approximately 20 million barrels of crude oil transit the Strait of Hormuz every single day, representing roughly one-fifth of all globally traded oil supply. Even a partial disruption to this corridor sends immediate shockwaves through energy markets worldwide.
How Much Oil Actually Flows Through Hormuz
To understand why traders react so violently to Hormuz disruption threats, consider the volume context:
- 20 million barrels per day of crude and condensate transit the strait under normal conditions
- Gulf exporters collectively account for more than 11 million barrels per day of crude that would be curtailed in a severe disruption scenario
- The strait also handles a significant portion of the global LNG supply outlook, particularly from Qatar, which is one of the world's largest LNG producers
- By comparison, the Suez Canal handles approximately 5.5 million barrels per day, less than a third of Hormuz volumes
These figures explain why even a rhetorical threat from Tehran generates an immediate market response. The mathematics of scarcity are simply too stark to ignore.
Alternative Routes and Their Limitations
Saudi Arabia is advancing plans for a major Red Sea pipeline expansion designed to route Gulf crude westward without passing through Hormuz. The existing East-West Pipeline, which runs from the Eastern Province to Yanbu on the Red Sea coast, has a capacity of approximately 5 million barrels per day, well short of full Hormuz replacement capacity.
Additional bypass options are similarly constrained:
- The Abu Dhabi Crude Oil Pipeline can move up to 1.5 million barrels per day to Fujairah on the Gulf of Oman, bypassing the strait entirely
- Iraq's Ceyhan pipeline through Turkey provides another partial outlet, though its capacity and reliability are limited
- Overland routing through the wider region remains commercially and logistically impractical at scale
The structural conclusion is clear: no combination of existing bypass infrastructure can replace Hormuz volumes in the short or medium term. This asymmetry between risk exposure and mitigation capacity is the foundation of every Hormuz-driven price spike in modern energy market history.
What Is Driving the Current Oil Price Rally
The Geopolitical Catalyst: U.S.-Iran Tensions and Sanctions Escalation
The week's price action was catalysed by a sharp deterioration in U.S.-Iran relations, compounded by the revocation of Iranian oil sanctions waivers that had previously allowed certain buyers to continue purchasing Iranian crude. When Washington tightened its sanctions posture, approximately 63 million barrels of crude were reportedly left stranded at sea, creating an immediate and visible supply disruption signal for the market.
Furthermore, reports of fresh US strikes against Iran in the region, combined with tanker U-turns and LNG carrier rerouting, converted an abstract geopolitical risk into a concrete operational disruption. The market responded accordingly.
The Weekly Price Data in Context
| Price Benchmark | Recent Level | Weekly Change | Key Driver |
|---|---|---|---|
| WTI Crude (August Contract) | ~$71.84 | +$3.38 (+4.94%) | Hormuz supply risk premium |
| Brent Crude | Above $77 | Elevated | Geopolitical escalation |
| WTI Weekly Low | $67.82 | Pre-escalation baseline | Baseline before tensions intensified |
| WTI Weekly High | $76.08 | Peak risk pricing | Peak risk-premium pricing |
Why OPEC+ Production Increases Failed to Calm the Market
The week began with bearish pressure after OPEC+ confirmed another increase in August production targets, continuing the group's broader strategy of returning previously withheld barrels to the market. Under normal conditions, this supply addition would weigh on prices.
Instead, the market demonstrated a well-established but often underappreciated behavioural pattern: traders consistently prioritise the immediacy of supply threats over the longer-term promise of supply additions. OPEC+ output increases are scheduled, telegraphed, and gradual. A tanker attack or a strait closure is immediate and binary. The psychological asymmetry between these two types of market information is not irrational; it reflects genuine uncertainty about whether planned production will ever reach its intended destination.
How Oil Markets Price Geopolitical Risk
Understanding the Risk Premium Mechanism
A geopolitical risk premium is not a formally calculated number. It is the difference between where the market believes prices should be based on supply-demand fundamentals and where prices actually trade given the prevailing level of perceived risk. When Hormuz tensions escalate, this premium can add anywhere from $5 to $20 per barrel to benchmark crude prices, depending on the severity of the perceived threat.
The premium is volatile by nature. It inflates rapidly on escalation news and deflates equally quickly when diplomatic progress is reported. Consequently, this creates significant trading opportunities for sophisticated participants and substantial risks for those caught on the wrong side of rapid sentiment shifts. The crude oil volatility trends observed throughout 2025 provide important context for understanding how quickly these risk premiums can move.
The Asymmetry of Threats Versus Supply Additions
One of the lesser-appreciated dynamics in oil markets is the mathematical asymmetry between downside supply shocks and upside supply additions. A disruption to 20 million barrels per day of transit cannot be offset by any single country's incremental production increase. However, a resolution of tensions can remove the entire risk premium within days.
This asymmetry means that markets tend to overprice disruption risk on the upside and underprice resolution speed on the downside, creating a structural tendency toward volatility clustering around geopolitical events.
Analyst Insight: Goldman Sachs projects a base-case Brent price range of $75 to $85 over the near term, with the outcome hinging heavily on whether diplomatic negotiations continue to progress or collapse entirely.
Realistic Price Scenarios If Hormuz Disruptions Escalate
Scenario Analysis: From Normalisation to Worst Case
| Scenario | Assumed Condition | Estimated Brent Price Range |
|---|---|---|
| Base Case | Flows normalise by late July | $75 to $85 |
| Moderate Disruption | Partial transit restrictions persist | $85 to $110+ |
| Severe / Worst Case | Strait largely closed through end of 2026 | Approaching $200 |
The worst-case scenario warrants particular attention. A sustained closure of the Strait of Hormuz through the end of 2026 would curtail more than 11 million barrels per day of Gulf crude exports, representing one of the most severe supply shocks in modern energy history. Analysts estimate this scenario could push crude prices toward $200 per barrel, a level last approached briefly during the post-invasion supply panic of 2022.
Why a Fragile Truce Is Not a Stable Supply Environment
A critical distinction that markets sometimes fail to maintain is the difference between a ceasefire and a resolution. Hormuz tensions do not resolve cleanly. Diplomatic agreements in the region have historically been fragile, reversible, and subject to rapid deterioration. Traders who price out the risk premium too quickly following a ceasefire announcement frequently find themselves exposed when hostilities resume.
This is why experienced energy traders treat Hormuz risk as a binary option with an uncertain expiry date rather than a linear de-escalation path.
U.S. Crude Inventories and Domestic Production: A Partial Buffer
The Contradictory Inventory Report
The weekly U.S. government inventory report delivered a split signal. Crude stockpiles increased unexpectedly, reflecting robust domestic production and import levels that exceeded exports. Under normal conditions, this would be unambiguously bearish for prices.
However, inventories of gasoline and distillate fuels declined, signalling that refinery throughput remained strong and that summer driving season demand was absorbing refined product supply at a healthy pace. The market chose to focus on the product draws rather than the crude build, a decision that reflects the underlying bullish bias created by geopolitical risk premiums.
U.S. Production as a Structural Counterweight
American crude output has expanded substantially over the past decade, and the United States now exports significant volumes of crude oil to global markets. This export capacity serves as a partial buffer against Middle East supply shocks, providing importing nations with an alternative source of supply that bypasses Hormuz entirely.
However, the US shale drilling slowdown has introduced its own constraints. Breakeven economics, drilling cycle times, and pipeline infrastructure limitations mean that American supply cannot be ramped up instantaneously in response to a geopolitical event. The buffer is real but incomplete.
The next major ASX story will hit our subscribers first
Technical Picture: What the Charts Say About WTI's Next Move
The 52-Week Moving Average as the Critical Threshold
Long-term technical analysis of the August WTI futures contract centres on one pivotal level: the 52-week moving average at $68.62. This indicator represents the market's long-run directional bias. Sustained price action above this level keeps open the possibility of a meaningful counter-trend rally. A failure to hold it, by contrast, puts the December 2025 bottom at $55.40 back on the radar as the next significant support target.
During the week ending July 10, the market tested the 52-week moving average before a short-covering rally drove prices to $76.08, a move of more than $8 from the weekly low. This type of move is characteristic of a short-covering rally designed to flush out the weakest short positions rather than signal a genuine trend reversal.
The Pivot at $71.56 and What It Means
The short-term directional bias for the week ending July 17 will be determined by how the market responds to the pivot level at $71.56.
Bullish scenario: A sustained move above $71.56 signals continued buyer participation, opening a path toward:
- Initial resistance zone: $72.48 to $77.75
- Extended rally target: $83.57 to $87.47 if the upper resistance is broken with conviction
Bearish scenario: A sustained move below $71.56 indicates that the short-covering rally has exhausted itself and the broader downtrend is ready to resume:
- First support test: 52-week MA at $68.62
- Swing low retest: $67.04
- Breakdown acceleration trigger: Any sustained close below $67.04
Technical Context: The WTI market tested its 52-week moving average at $68.62 before a short-covering rally drove prices to $76.08, a move of more than $8 from the weekly low. The pullback from this high represents the defining price action for the week ahead.
How Global Energy Markets Are Responding Beyond Crude Oil
LNG Tanker Traffic, Refining Margins, and Infrastructure Bets
The disruption to Hormuz transit extended well beyond crude oil. LNG tankers operating in the region faced the same threat environment, with multiple carriers reported making U-turns or seeking alternative routing. For Qatar, the world's largest LNG exporter, any prolonged Hormuz disruption represents an existential commercial threat.
Refining margins hit record highs during the period as tightening crude supply chains squeezed capacity and elevated input costs were passed through to refined product prices. This created a paradox where refiners benefited from elevated margins even as their input costs rose, provided they had secured feedstock at pre-disruption prices.
ADNOC's decision to order $900 million in new LNG carriers signals that at least one major Gulf producer is making long-duration infrastructure bets premised on continued demand for seaborne LNG transport, even in an elevated risk environment. Separately, ADNOC signed a 15-year LNG supply deal with Japan's Inpex, reflecting the appetite for long-term supply security among Asian importers.
India, facing its own energy security calculus, expanded its strategic oil reserves through a new ONGC storage plan while simultaneously exploring whether a U.S. sanctions waiver extension could allow it to return to purchasing Iranian crude at discounted prices. Germany, meanwhile, announced plans for a $1.7 billion strategic natural gas reserve, reflecting European recognition that energy supply security now requires active financial commitment rather than passive market reliance. In addition, the oil market trade war impact continues to add a further layer of complexity to already strained supply dynamics.
Shell signalled a significant oil and gas trading windfall for Q2 2026, a reminder that volatility is not universally destructive. For well-positioned trading operations with diverse physical and derivative exposure, Hormuz-driven price swings generate substantial profit opportunities.
Broader Macro and Economic Implications
IMF Downgrades and the Demand Destruction Feedback Loop
The IMF downgraded its global economic growth forecast to 3% amid the escalating Iran-related conflict, reflecting concern that sustained oil price elevation would dampen industrial activity, consumer spending, and trade flows across importing economies. This is the demand destruction feedback loop: supply shocks push prices higher, which slows economic activity, which ultimately reduces oil demand, which eventually moderates prices.
The Federal Reserve's posture adds another layer of complexity. The Fed has signalled that it expects oil prices to cool despite the conflict, implying that monetary policy will not respond to energy-driven inflation as aggressively as it might to demand-driven price increases. This creates a ceiling on how far crude prices can rally before macroeconomic headwinds begin to outweigh supply-side tailwinds.
Currency dynamics compound this picture. A stronger U.S. dollar, which often accompanies risk-off sentiment triggered by geopolitical events, makes dollar-denominated crude more expensive for non-U.S. buyers, creating additional demand compression that caps price upside. The IEA's assessment that the oil market is likely to remain in deficit throughout this period further supports the case for sustained price elevation.
How Traders and Companies Are Positioning Around Hormuz Risk
From Hedging Windfalls to Strategic Reserve Buildouts
The current environment has created sharply divergent outcomes across different categories of market participant:
- Major trading houses such as Shell are reporting Q2 trading windfalls as volatility creates arbitrage opportunities across physical and paper markets
- Airlines with sophisticated hedging programmes have transformed the fuel price surge into significant financial gains, with one UK carrier reporting a £388 million hedging windfall that translates to approximately $500 million in protective value
- National oil companies including ADNOC are using the period to lock in long-term supply agreements and expand fleet infrastructure
- Governments in Europe and Asia are accelerating strategic reserve buildouts, treating the current disruption as confirmation that passive energy security strategies are insufficient
The Strait of Malacca is also attracting attention as observers note the risk of copycat disruption strategies emerging at other maritime chokepoints, a concern that adds a systemic dimension to what might otherwise appear to be a regionally contained event.
Frequently Asked Questions: Oil Prices and the Strait of Hormuz
What would happen to oil prices if the Strait of Hormuz were fully closed?
In a scenario where the strait remains largely inaccessible through the end of 2026, analysts estimate that crude prices could approach $200 per barrel, reflecting the curtailment of more than 11 million barrels per day of Gulf crude exports. This represents one of the most severe supply shock scenarios in modern energy market history.
Why did oil prices rise despite OPEC+ increasing production?
Oil markets responded more forcefully to the immediate threat of Hormuz disruption than to OPEC+'s planned output increases. Traders treated the production additions as a gradual, longer-term development, while geopolitical escalation represented a real-time threat to barrels already in transit.
What is the current WTI crude oil price range?
During the week ending July 10, August WTI futures traded in a range of $67.82 to $76.08, settling near $71.84, representing a gain of approximately 4.94% on the week.
What is Goldman Sachs forecasting for Brent crude?
Goldman Sachs projects a base-case Brent price range of $75 to $85 over the near term, contingent on diplomatic negotiations continuing and tanker flows normalising by late July.
How much oil transits the Strait of Hormuz daily?
Approximately 20 million barrels per day, representing roughly one-fifth of global seaborne oil supply, passes through the strait, making it the single most consequential maritime chokepoint in the global energy system.
What alternative routes exist if Hormuz is disrupted?
Saudi Arabia is advancing a major Red Sea pipeline expansion to bypass Hormuz, whilst the Abu Dhabi Crude Oil Pipeline and Iraq's Ceyhan route offer partial relief. However, no combination of existing bypass infrastructure has the capacity to replace Hormuz transit volumes in the near term.
Key Takeaways: What the Hormuz-Driven Rally Reveals About Energy Market Vulnerability
The oil prices rally on renewed Hormuz supply risks during the week of July 10, 2026 carries several structural lessons that extend well beyond the immediate price move:
-
Geopolitical risk consistently outranks supply data in terms of near-term market impact. Traders will price existential supply threats before they incorporate incremental production increases.
-
The 52-week moving average at $68.62 remains the critical long-term technical threshold for WTI. How the market behaves around this level in the coming weeks will determine whether the current move is a genuine trend shift or an exhausted short-covering rally.
-
Strategic reserve buildouts by India, Germany, and others signal that institutional actors are treating Hormuz vulnerability as a structural rather than cyclical risk requiring long-term capital allocation.
-
Volatility is not symmetric in its effects. Whilst importing economies and consumers face cost pressures, trading houses, hedged airlines, and well-positioned energy companies are extracting significant value from the same disruption environment.
-
The global economy's sensitivity to oil price shocks remains high, as evidenced by the IMF's growth downgrade to 3%, reinforcing that crude price rallies driven by supply fear carry their own self-limiting mechanism through demand destruction.
The fundamental outlook heading into the week of July 17 remains cautiously bullish, provided that geopolitical risks persist around the strait. If tensions begin to ease and diplomatic channels reopen, the risk premium currently embedded in crude prices could deflate rapidly, exposing the market to the full weight of OPEC+ production increases and robust U.S. output that it has so far chosen to ignore. Oil prices rally on renewed Hormuz supply risks with remarkable speed, but they can deflate just as quickly when the threat environment shifts.
This article is provided for informational and educational purposes only and does not constitute financial or investment advice. Oil price forecasts, scenario analyses, and technical projections involve significant uncertainty and should not be relied upon as the sole basis for investment decisions. Past price performance is not indicative of future results.
Want to Stay Ahead of the Next Major Commodity Discovery Before the Market Moves?
While geopolitical shocks like Hormuz supply disruptions dominate energy headlines, significant mineral discoveries on the ASX can deliver equally transformative returns — and timing is everything. Discovery Alert's proprietary Discovery IQ model instantly notifies subscribers of high-potential ASX mineral discoveries across 30+ commodities, turning complex data into clear, actionable opportunities the moment they are announced. Explore historic discovery returns on Discovery Alert's dedicated discoveries page and begin your 14-day free trial today to ensure you are positioned ahead of the broader market.