
July 22, 2026
The Hidden Architecture of Energy Vulnerability: How One Waterway Holds the World Hostage
Long before headlines announce oil prices jump on US-Iran tensions, the structural fragility that makes such price swings possible already exists, quietly embedded in the physical geography of global energy infrastructure. The Strait of Hormuz is not simply a geopolitical flashpoint. It is the gravitational centre of a supply chain architecture that has never been adequately redesigned despite decades of warning.
Understanding why crude markets respond so violently to events in this 33-kilometre-wide passage requires stepping back from the daily noise of price tickers and examining something more fundamental: how the global oil system was built, and why it remains critically exposed to a single point of failure.
When big ASX news breaks, our subscribers know first
The Strait of Hormuz: Why Geography Determines Global Energy Security
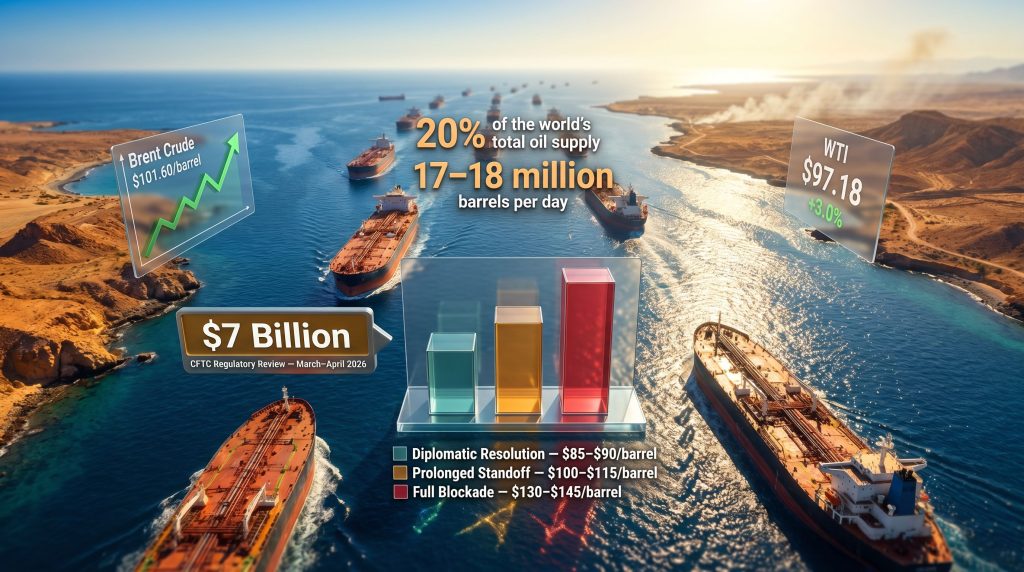
The numbers defining the Strait of Hormuz's importance are staggering in their concentration. Approximately 20% of the world's total oil supply transits this single maritime corridor every day, with estimates placing daily throughput at roughly 17 to 18 million barrels under normal operating conditions. No other chokepoint in global energy infrastructure comes close to this level of supply concentration.
The nations most exposed to a Hormuz disruption are those with the least ability to quickly pivot to alternative supply sources. Japan imports the vast majority of its crude oil requirements through the passage. South Korea's industrial economy depends on it. India, one of the world's fastest-growing energy consumers, sources a substantial portion of its crude from the Gulf region. Large parts of Western Europe, still reconfiguring supply chains following the Russian energy shock of 2022, also rely on Hormuz-dependent crude flows.
What makes the chokepoint so uniquely dangerous is the absence of any credible short-term alternative. Unlike pipeline disruptions, where rerouting is theoretically possible at scale, a Hormuz closure faces a hard physical constraint: no combination of alternative maritime routes, existing pipeline infrastructure, or overland transport logistics can move 17 to 18 million barrels per day around the bottleneck within any commercially or strategically meaningful timeframe.
Understanding the broader crude oil market dynamics helps contextualise why this chokepoint carries such extraordinary pricing power across global benchmarks.
The International Energy Agency estimates that member nations collectively hold strategic petroleum reserves designed to cover approximately 90 days of net import disruption. In a prolonged Hormuz crisis, that buffer does not represent safety. It represents a countdown.
The geopolitical risk premium that energy traders attach to Hormuz threats operates on a fundamentally different logic than supply disruptions caused by production outages or demand shocks. When a refinery goes offline, markets price an actual supply reduction. When Hormuz is threatened, markets price a probability distribution — a weighted assessment of possible futures, not a confirmed event. This distinction explains why oil prices jump on US-Iran tensions even when tankers are still moving normally through the passage.
Escalation in Real Time: How the May 2026 Crisis Unfolded
The price action seen across crude markets in the first week of May 2026 can only be understood within the context of a longer conflict trajectory. The current crisis did not begin on May 7. Its roots extend to February 28, 2026, when US and Israeli forces conducted joint strikes on Iranian targets, triggering Iran's decision to tighten restrictions on Strait of Hormuz transit as a retaliatory mechanism.
The sequence of events through early May demonstrates the extreme market sensitivity now embedded in every diplomatic or military signal from the region:
| Date | Development | Market Response |
|---|---|---|
| Late April 2026 | US-Iran diplomatic contacts generate optimism about a potential arrangement | Brent crude falls sharply; global equities advance |
| Early May 2026 | Supply anxiety intensifies as talks stall | Brent crude peaks above $115/barrel |
| Wednesday, early May | Markets price diplomatic breakthrough; expectations of Hormuz reopening | Brent drops 7.8% to $101.27; prices briefly fall below $97 |
| May 7, 2026 | US military conducts retaliatory strikes on Iranian-linked targets following attacks on American forces | Ceasefire narrative collapses; risk premium re-enters market |
| May 8, 2026 | Iran accuses Washington of ceasefire violations; claims strikes hit two vessels near Hormuz and civilian areas | WTI surges to $96.66 to $97.18/barrel (+1.95% to +3.0%); Brent climbs to $101.60 (+1.52%) |
Source: Economic Times Energy World, May 8, 2026
The rapid reversal from near-$97 to above-$101 for Brent within a single trading session illustrates a market characteristic that distinguishes geopolitical oil shocks from all other price-moving events: the floor can disappear instantly. Diplomatic progress, when it lacks verifiable enforcement mechanisms, creates a fragile optimism that skilled traders increasingly treat as a short-selling opportunity rather than a structural re-rating.
The US administration's public warning that military action could escalate to a significantly higher level of intensity if Iran rejected proposed terms removed what traders describe as a conflict ceiling. When both the floor (diplomatic resolution) and ceiling (limited military exchange) are simultaneously removed from a conflict scenario, options pricing for crude reflects the full spectrum of outcomes rather than a central probability. Furthermore, oil price volatility of this magnitude has broader implications for energy-importing economies already managing fragile fiscal positions.
Current Price Benchmarks: What the Numbers Are Actually Signalling
As of 7:05 AM IST on May 8, 2026, according to Reuters reporting on US-Iran hostilities, the two primary crude benchmarks were positioned as follows:
| Benchmark | Price | Session Change | Key Significance |
|---|---|---|---|
| West Texas Intermediate (WTI) | $96.66 to $97.18/barrel | +1.95% to +3.0% intraday | US domestic benchmark; reflects North American supply conditions |
| Brent Crude | $101.60/barrel | +1.52% | Global benchmark; most directly exposed to Middle Eastern supply risk |
Source: Economic Times Energy World, May 8, 2026
The Brent-WTI spread of approximately $4.94 to $5 at these levels is itself informative. During geopolitically calm periods, the spread typically reflects logistics and quality differentials. When the spread widens during Middle Eastern tensions, it specifically captures the risk premium that global markets are attaching to Hormuz-linked supply risk that domestic US production does not face. A widening spread is therefore not just a price signal; it is a geographic risk signal.
The $100/barrel threshold for Brent carries significance beyond its technical function as a round-number resistance level. Historically, sustained Brent pricing above $100 correlates with accelerating consumer price inflation across import-dependent economies, increased policy pressure on central banks already managing post-pandemic interest rate trajectories, and measurable compression in airline, shipping, and manufacturing sector margins. European and Asian central banks, still navigating the aftermath of the post-2020 inflation cycle, face renewed complexity when crude benchmarks sustain above this level.
Economic Transmission: How $100+ Oil Reaches Consumers
The pathway from crude price to household inflation is not instantaneous, but it is consistent. Understanding the transmission mechanism helps investors and consumers anticipate where pressure will materialise first.
Primary transmission channels include:
- Fuel costs at the pump typically adjust within one to three weeks of sustained crude price movements, directly visible to consumers
- Aviation fuel (jet kerosene) prices track Brent closely, with airlines passing costs through via fuel surcharges within weeks
- Freight and logistics costs rise as road haulage and shipping diesel costs increase, flowing through to retail goods pricing within four to eight weeks
- Petrochemical feedstocks including plastics, synthetic fertilisers, and industrial solvents become more expensive, adding inflationary pressure to manufacturing supply chains
- Energy import bills for oil-importing nations widen current account deficits and create currency depreciation pressure, adding a second-order inflationary effect
Regional vulnerability to sustained $100+ Brent varies significantly:
| Region | Vulnerability Level | Primary Risk Factor |
|---|---|---|
| South and Southeast Asia | High | Heavy dependence on Middle Eastern crude imports |
| Europe | High | Constrained alternative supply options following Russian energy reconfiguration |
| United States | Moderate | Domestic shale production provides a partial supply buffer |
| Gulf Cooperation Council | Low to Neutral | Net exporters; elevated prices improve export revenues |
Strategic petroleum reserves held by IEA member nations provide approximately 90 days of cushion against import disruption. However, the US Strategic Petroleum Reserve has been drawn down materially through coordinated releases during the 2022 Russia-Ukraine supply shock, meaning the available buffer heading into the current crisis is lower relative to historical baselines. A repeat of the 2022 coordinated release strategy remains a policy option but would operate from a reduced starting position.
The $7 Billion Trading Controversy: A Market Integrity Warning
Layered beneath the geopolitical price drivers is a separate and deeply concerning pattern of market activity. According to reporting by Reuters, financial positions valued at up to $7 billion were established across multiple exchanges, energy derivatives, and fuel product markets during March and April 2026, in the period immediately preceding major US policy announcements relating to Iran.
This figure reportedly exceeds a previously disclosed threshold of $2.6 billion in flagged activity, representing a substantial scaling up of the pattern under scrutiny.
The US Commodity Futures Trading Commission (CFTC) is understood to be reviewing the trading patterns, though no formal public investigation has been confirmed by the regulator as of the time of this article's publication. The critical concern from a market integrity standpoint is the timing alignment: positions were established before policy announcements that subsequently drove price movements consistent with those positions.
Three distinct implications flow from this controversy:
-
If confirmed as coordinated pre-announcement positioning, it would represent one of the largest alleged commodity market manipulation events in recent memory, raising structural questions about the integrity of energy derivatives markets
-
It introduces questions about the security of sensitive foreign policy deliberations and whether market-sensitive information is adequately protected during the decision-making process
-
For institutional and retail energy market participants, it underscores the importance of distinguishing between price movements driven by fundamental supply-demand factors and those potentially driven by non-fundamental, information-asymmetry-based positioning
This controversy adds a market integrity risk premium on top of the existing geopolitical supply risk premium — a combination that creates unusual uncertainty for traders attempting to model price discovery. In addition, the broader commodity market volatility triggered by these events is already reverberating across asset classes well beyond crude oil.
The next major ASX story will hit our subscribers first
Geopolitical Oil Shocks: What History Actually Teaches Us
Three historical precedents bracket the range of possible outcomes for the current crisis, from contained and quickly reversed to economically catastrophic.
The 2019 Strait of Hormuz Tanker Attacks demonstrated that direct Iranian actions against shipping trigger an immediate but often short-lived market response. Brent crude rose approximately 4 to 5% following the attacks, but prices normalised relatively quickly as naval escort deployments contained further escalation. Resolution came through security measures rather than diplomatic breakthrough, meaning the underlying tension remained unresolved.
The January 2020 Soleimani Strike represents perhaps the most instructive precedent for the current environment. An immediate 4% oil price spike followed the event, but markets normalised within approximately 72 hours as Iran's retaliatory response remained below the threshold of direct military confrontation. The episode demonstrated that swift and calibrated de-escalation is the most effective circuit-breaker for geopolitical oil premiums. Conversely, it demonstrated that absent de-escalation, premiums can sustain indefinitely.
The 1979 to 1980 Iranian Revolution and Hostage Crisis remains the tail-risk scenario that energy security analysts return to when assessing worst-case outcomes. Oil prices more than doubled over an 18-month period, triggering a global recession and permanently reshaping Western energy policy toward diversification. This event did not involve a formal Hormuz blockade, but the supply shock from Iranian production collapse was sufficient to demonstrate the macroeconomic fragility embedded in concentrated energy dependencies.
Scenario analysis for the current crisis:
| Scenario | Assessment | Brent Crude Outlook |
|---|---|---|
| Diplomatic resolution within 30 days | Moderate probability | Return toward $85 to $90/barrel |
| Prolonged standoff with partial Hormuz restrictions | Elevated probability given current trajectory | Sustained $100 to $115/barrel range |
| Full Hormuz blockade | Low probability but structurally non-negligible | $130 to $145/barrel or higher |
Investor Framework: Separating Risk Premiums from Structural Price Drivers
A critical analytical distinction that separates sophisticated energy market participants from reactive investors is the ability to differentiate between two fundamentally different types of price elevation operating simultaneously in crude markets right now.
Geopolitical risk premiums are the component of current prices driven by the probability of Hormuz disruption rather than actual supply reduction. Crude is, as of May 8, 2026, still moving through the Strait. The current price spike is not reflecting a physical supply deficit; it is reflecting a probability-weighted fear of one. This portion of the price premium is inherently volatile and can collapse rapidly in response to credible de-escalation signals, as the mid-week 7.8% Brent decline demonstrated.
Structural supply factors are a separate and longer-duration concern. Years of underinvestment in upstream oil production capacity, combined with constrained OPEC+ spare capacity, mean that even a complete geopolitical resolution would not necessarily return Brent to $70-range pricing. This underlying tightness provides a floor beneath which prices are unlikely to fall regardless of diplomatic outcomes. Furthermore, OPEC's market influence over spare capacity decisions will be a defining variable in how quickly any post-conflict price normalisation can occur.
Key indicators investors and market participants should monitor:
-
Strait of Hormuz tanker transit data: Any confirmed reduction in vessel traffic is the most direct available signal of actual supply disruption rather than feared disruption
-
CFTC Commitments of Traders reports: Net long positioning in crude futures by managed money (hedge funds) reflects institutional conviction on continued price elevation
-
Gulf state intermediary signals: Qatar and Oman have historically served as back-channel intermediaries in US-Iran tensions; communications from these capitals often precede formal de-escalation announcements by days
-
IEA emergency reserve coordination announcements: A coordinated strategic reserve release would signal that consuming nation governments assess the disruption as severe enough to warrant collective intervention
-
Brent-WTI spread trajectory: Sustained spread widening indicates global risk premium is expanding rather than contracting
Frequently Asked Questions: Oil Prices and US-Iran Tensions
Why Do Oil Prices Jump on US-Iran Tensions Specifically?
Iran's geographic position at the northern shore of the Strait of Hormuz gives it a unique and credible ability to threaten the passage of approximately 20% of global oil supply. Unlike most geopolitical actors whose conflicts carry indirect energy market implications, Iran can directly interdict the world's most critical energy shipping lane. Energy markets price the probability of this occurring the moment credible escalation signals emerge, producing immediate price movements even without confirmed physical supply disruption.
How High Could Crude Prices Go in a Worst-Case Hormuz Closure?
Analyst scenario modelling places worst-case Brent crude pricing at $130 to $145/barrel in the event of a sustained Hormuz blockade. However, a full blockade remains a low-probability outcome given the severity of economic consequences for Iran itself, the military deterrence capacity of the US naval presence in the region, and the diplomatic pressure that would be applied by all major oil-importing nations simultaneously.
What Is the CFTC Examining in Relation to Energy Markets?
The US Commodity Futures Trading Commission is reportedly reviewing a pattern of large derivative positions, valued at up to $7 billion according to Reuters reporting, that were established across energy markets during March and April 2026 ahead of major US policy announcements regarding Iran. The concern relates to the timing alignment between position establishment and subsequent policy-driven price movements. The CFTC has not publicly confirmed any formal investigation as of publication.
How Long Do Geopolitical Oil Price Premiums Typically Last?
Historical precedent suggests that geopolitical premiums are among the most short-lived of all oil price drivers, provided de-escalation occurs. The 2020 Soleimani strike premium normalised within 72 hours. The 2019 tanker attack premium faded within weeks. Conversely, when escalation continues and no de-escalation mechanism emerges, premiums can sustain and compound. The current crisis is tracking closer to the sustained-tension scenario than the swift-resolution scenario as of early May 2026.
What This Crisis Reveals About the Deeper Architecture of Energy Risk
The speed and magnitude with which oil prices jump on US-Iran tensions in May 2026 is not simply a reflection of current events. It is a diagnostic reading of a structural vulnerability that decades of energy diversification policy have failed to meaningfully reduce.
Despite sustained investment in renewable energy, the development of unconventional oil resources in North America, and repeated policy commitments to energy security diversification, the global economy in 2026 remains as exposed to a Hormuz disruption scenario as it was during the Carter administration. The chokepoint concentration problem has not been solved. It has simply been periodically forgotten during periods of Middle Eastern stability. Consequently, the geopolitical trade tensions reshaping supply chains across multiple sectors are now intersecting with energy vulnerability in ways that compound systemic risk.
The simultaneous emergence of a $7 billion suspicious trading controversy adds a dimension that extends beyond geopolitics into questions about the integrity of the price discovery mechanism itself. Energy markets function efficiently only when participants are operating on the same informational footing. Evidence of large-scale pre-announcement positioning undermines that assumption and raises the cost of participation for all market actors who lack access to the same information.
For investors navigating this environment, the most durable framework recognises that crude oil pricing in 2026 is being simultaneously shaped by three distinct forces: a geopolitical risk premium that can evaporate overnight, a structural supply tightness that cannot be resolved through diplomacy, and a market integrity question that adds noise to every technical signal. As the BBC has reported on the broader regional conflict, understanding which force is driving price on any given day is the analytical challenge that separates informed positioning from reactive trading.
This article reflects market conditions and publicly available information as of May 8, 2026. Oil price movements, geopolitical developments, and regulatory investigations referenced herein are subject to rapid change. Nothing in this article constitutes financial advice. Readers should conduct independent research and consult qualified advisors before making investment decisions. Forward-looking scenario projections reflect analytical modelling and carry inherent uncertainty.
Want to Identify the Next Major ASX Mineral Discovery Before the Market Does?
While geopolitical forces drive crude oil volatility, Discovery Alert's proprietary Discovery IQ model scans ASX announcements in real time, delivering instant alerts on significant mineral discoveries across 30+ commodities — explore historic discovery returns on Discovery Alert's dedicated discoveries page and begin your 14-day free trial to gain an immediate market edge.