
June 17, 2026
The Geopolitics of Chokepoints: How One Strait Controls Global Oil Pricing
Few mechanisms in global commodity markets operate with the speed and severity of a maritime chokepoint closure. When physical geography intersects with geopolitical conflict, the result is not a gradual repricing of risk but an immediate, often violent repricing event that cascades across energy benchmarks, sovereign fiscal frameworks, and consumer economies simultaneously. The Strait of Hormuz is the single most powerful example of this dynamic in the modern energy system, and the sequence of events that unfolded from late February 2026 onward has provided one of the most instructive case studies in energy market structure that analysts have seen in years.
Understanding why oil prices plunge after a US-Iran agreement requires understanding not just the diplomatic mechanics, but the deeper architecture of how geopolitical risk gets embedded into commodity pricing — and what happens when that risk begins to dissolve. Furthermore, geopolitical oil price trends consistently demonstrate that diplomatic breakthroughs can trigger some of the most dramatic single-session moves in energy markets.
When big ASX news breaks, our subscribers know first
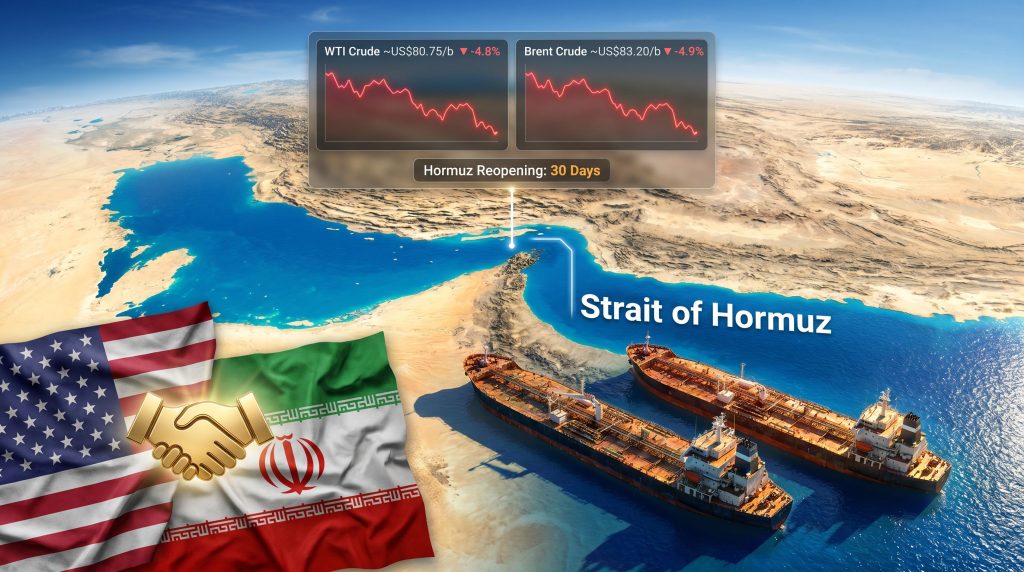
WTI and Brent Crude: Measuring the Scale of the Collapse
The numbers from Monday's session were stark. West Texas Intermediate crude fell approximately 4.8% to close near US$80.75 per barrel, while Brent crude dropped roughly 4.9% to approximately US$83.20 per barrel. Both benchmarks settled at their lowest closing levels since the opening days of March, just after hostilities began.
The broader energy complex moved in lockstep. Tracking WTI and Brent futures across these sessions reveals just how broadly the risk premium deflated:
- Heating oil, used as a proxy for jet fuel demand, declined 3%
- Wholesale gasoline futures dropped 4%
- Natural gas futures fell 3%, reflecting a broad repricing of energy risk rather than crude-specific dynamics
Critically, Monday's decline did not occur in isolation. Crude benchmarks had already shed more than 6% during the preceding week as diplomatic signals strengthened, meaning the cumulative two-week drawdown exceeded 10% of market value.
| Benchmark | Approx. Closing Price | Single-Session Decline | Notable Context |
|---|---|---|---|
| WTI Crude | ~US$80.75/b | -4.8% | Lowest close since early March |
| Brent Crude | ~US$83.20/b | -4.9% | Lowest close since early March |
| Heating Oil | — | -3.0% | Jet fuel demand proxy |
| Wholesale Gasoline | — | -4.0% | Refined product repricing |
| Natural Gas Futures | — | -3.0% | Broad energy complex selloff |
Despite the sharp decline, context matters enormously here. WTI at US$80.75 per barrel still sits more than 20% above pre-conflict levels, and both benchmarks remain more than 40% higher than where they opened at the start of the year. The oil prices plunge after US-Iran agreement is dramatic, but it represents a partial unwinding of a far larger risk-premium buildup.
The April 8 ceasefire announcement provides the closest historical parallel. That announcement sent Brent as low as US$91.72 per barrel and WTI to US$91.11 per barrel in intraday trading, with both benchmarks finishing the session down more than 13%. That ceasefire had been preceded by WTI climbing above US$115 per barrel, its highest closing level since June 2022, as diplomatic deadlines approached.
The Strait of Hormuz: Understanding Why This Waterway Controls Crude Benchmarks
The Strait of Hormuz is a narrow passage connecting the Persian Gulf to the Gulf of Oman, separating Iran from the Arabian Peninsula at its narrowest point of roughly 33 kilometres. Approximately 20% of the world's seaborne oil trade transits this corridor, including the majority of crude exports from Saudi Arabia, the United Arab Emirates, Kuwait, Iraq, and Iran itself.
What makes Hormuz particularly powerful as a market lever is its lack of viable alternatives. While bypass pipelines exist, including the Petroline (East-West Pipeline) across Saudi Arabia, their combined capacity falls well short of what passes through the strait on any given day. A sustained closure does not merely inconvenience global logistics; it structurally removes supply from international markets regardless of what producing nations nominally pump.
When the United States enforced a naval blockade of Iranian port traffic beginning in late February 2026, the effective constraint was not limited to Iranian exports. The uncertainty premium alone — the probability-weighted risk that the strait's physical accessibility could deteriorate further — was sufficient to embed a significant risk premium across all crude benchmarks. This is also reflected in the broader geopolitical risk landscape that has shaped commodity markets throughout 2025 and into 2026.
A useful way to think about Hormuz is as a physical option embedded in global oil pricing. When the option to close it is "in the money" due to active conflict, the market pays a premium. When that option moves "out of the money" through diplomatic resolution, the premium collapses rapidly, often faster than the underlying supply situation normalises.
Key Terms of the US-Iran Agreement and What They Mean for Markets
According to the draft memorandum circulated ahead of formal signing, the agreement's terms rest on several sequenced commitments:
- The Strait of Hormuz is to be reopened within 30 days of the agreement taking effect
- The US naval blockade of Iranian port traffic is to be lifted simultaneously
- Iran's nuclear enrichment programme is to be dismantled
- Enriched uranium stockpiles are to be removed from Iranian territory
- Sanctions relief and the unfreezing of certain Iranian funds to follow as conditions are verified
- War reconstruction provisions to be included in the final framework
- Formal signing is scheduled to take place in Switzerland
The sequenced and conditional nature of these terms carries direct market implications. Supply restoration is not instantaneous even if the agreement holds. The 30-day Hormuz reopening timeline creates a lag between diplomatic announcement and physical normalisation of tanker flows, which is why markets priced in the anticipated outcome rapidly but did not fully collapse to pre-conflict price levels in a single session.
President Trump confirmed the agreement through Truth Social on Sunday evening, bypassing conventional diplomatic communication channels. The informal delivery mechanism contributed to initial uncertainty about the deal's durability. Trump simultaneously disputed an Iranian state media version of the agreement text, accusing Iranian officials of releasing an altered account to manage domestic political expectations, and separately condemned an alleged Iranian drone attack on an Indian vessel as unacceptable — signalling that operational-level hostilities had not ceased cleanly alongside the diplomatic announcement.
Why This Pattern Keeps Repeating: The Escalation-De-Escalation Cycle
Veteran energy traders will recognise the structural pattern that the US-Iran conflict has produced since late February. It is not unique to this conflict; it has appeared in varying forms across Middle Eastern geopolitical crises for decades.
The cycle follows a recognisable sequence:
- Escalation phase — Military action or blockade tightening drives crude benchmarks sharply higher as supply risk enters market calculations
- De-escalation signal — A ceasefire announcement or diplomatic breakthrough triggers a rapid selloff as the risk premium deflates
- Resumption — Conflict resumes, erasing the de-escalation price gains
- Re-escalation spike — Prices surge again as supply risk re-enters the market
- Partial retracement — Each re-escalation peak is slightly lower than the previous one, reflecting partial exhaustion of the risk premium as investors apply a durability discount
This exact cycle played out following the April 8 ceasefire. Strikes resumed in late May and again in early June, each resumption triggering renewed price spikes followed by partial retracements. Monday's announcement is the latest iteration, and the critical analytical question is whether the June agreement represents a structurally different diplomatic outcome or another turn of the same wheel.
Factors That Could Undermine the Agreement's Durability
- Verification complexity — Dismantling Iran's nuclear programme is a multi-year technical and logistical process; disputes over compliance timelines could stall implementation well before supply normalisation occurs
- Domestic political pressures in Tehran — Iranian officials have already attempted to reframe agreement terms for domestic audiences, indicating internal political resistance that could complicate ratification and implementation
- Ongoing maritime incidents — The alleged drone attack on an Indian vessel occurred after the deal announcement, demonstrating that operational-level hostilities do not automatically cease when diplomatic frameworks are announced
- OPEC+ supply compounding — If the agreement holds, OPEC's market influence and pre-positioned quota increases that were neutralised by the Hormuz closure will begin entering global markets, amplifying the downward price dynamic
Mexico's Fiscal Exposure: A Two-Channel Problem
The oil prices plunge after US-Iran agreement creates a genuinely complex fiscal situation for Mexico — one that operates through two opposing channels simultaneously and cannot be evaluated by looking at either channel in isolation.
Channel One: PEMEX Export Revenue Under Pressure
PEMEX, Mexico's state oil company, recorded average export volumes of 418,200 barrels per day in April 2026. This figure represents approximately 20% below the Secretaría de Hacienda y Crédito Público (SHCP) annual budgetary target, meaning the revenue calculation starts from an already-constrained volume baseline.
The SHCP's Pre-Criterios 2027 document had revised Mexico's 2026 oil price assumption upward to US$77.3 per barrel in direct response to conflict-driven price inflation. Monday's WTI close of approximately US$80.75 per barrel remains marginally above this planning assumption, but the buffer is narrowing. A continued decline toward pre-conflict levels in the US$60s would create a structural revenue shortfall that the budget framework had not modelled.
The volume deficit compounds the price risk. Falling per-barrel revenue applied to an already-below-target export volume produces a non-linear fiscal impact that is larger than either variable would suggest individually.
Channel Two: IEPS Subsidy Relief
The IEPS (Impuesto Especial sobre Producción y Servicios) functions as Mexico's fuel price stabilisation buffer. When international crude prices rise above domestic pricing targets, the mechanism absorbs the gap, effectively subsidising domestic fuel consumption at government expense.
During the conflict-driven price spike, this mechanism had been costing approximately MX$2.5 billion per week. A sustained decline in international oil prices toward US$70 per barrel or below would meaningfully reduce this weekly burden, freeing fiscal resources that had been consumed by the subsidy.
| Fiscal Channel | Rising Price Impact | Falling Price Impact |
|---|---|---|
| PEMEX Export Revenue | Positive: higher per-barrel income | Negative: lower per-barrel income |
| IEPS Subsidy Cost | Negative: wider gap, higher weekly cost | Positive: narrower gap, lower weekly cost |
| Budget Assumption (US$77.3/b) | Comfortable buffer above assumption | Risk of shortfall toward US$60s |
| PEMEX Volume Gap | 20% below target regardless of price | Compounds revenue loss at lower prices |
The fiscal paradox Mexico faces is genuine: falling oil prices simultaneously reduce PEMEX's per-barrel export earnings and reduce the government's weekly subsidy expenditure. The net fiscal impact is not determinable from price direction alone; it depends on the depth and duration of the decline, and on whether export volumes recover as supply chains normalise.
The next major ASX story will hit our subscribers first
OPEC+ and the Supply Compounding Dynamic
Throughout the conflict period, Rystad Energy assessed that OPEC+'s consecutive output quota increases were having limited real market impact while the Strait of Hormuz remained closed. Physical supply from Gulf producers could not reach global markets through the primary export corridor regardless of nominal production levels, meaning the alliance's fourth consecutive quota increase in early June entered markets that were structurally insulated from it.
With Hormuz reopening now scheduled within 30 days under the agreement, that supply overhang begins to matter. Two distinct supply streams will re-enter global markets simultaneously if implementation proceeds:
- Iranian crude, previously blockaded, returns to export availability
- OPEC+ quota increases, previously neutralised by the Hormuz closure, begin flowing through the strait into international markets
Combined with inventory rebuild dynamics as global stockpiles replenish from conflict-period drawdowns, this creates a compounding downward pressure on crude prices that extends well beyond the initial diplomatic announcement effect. In addition, the interplay between oil prices and trade conflict adds a further layer of complexity to where benchmarks ultimately settle.
Where Could Prices Settle? Scenario Framework
| Scenario | Core Assumption | Potential WTI Range (60-90 Days) |
|---|---|---|
| Full Implementation | Hormuz reopens on schedule, nuclear terms hold | US$65-72/b |
| Partial Implementation | Hormuz reopens, nuclear compliance disputed | US$72-80/b with elevated uncertainty |
| Agreement Collapses | Strikes resume within 30 days (April pattern repeats) | Rebound toward US$95-105/b |
| Extended Stalemate | Partial reopening, ongoing compliance disputes | US$78-85/b with high volatility |
Note: These scenarios represent analytical frameworks based on available information and historical conflict patterns. They are not investment recommendations. Commodity price forecasting involves significant uncertainty and actual outcomes may differ materially from any modelled scenario.
Broader Market Implications Beyond Crude Oil
The oil prices plunge after US-Iran agreement did not remain contained within energy markets. The announcement triggered a synchronized repricing across multiple asset classes that reflects the outsized role energy cost inflation had been playing in the broader macroeconomic environment.
Equity markets across Asia and the United States surged as the perceived risk of sustained energy-driven inflation receded. Federal Reserve policy expectations shifted marginally, as analysts noted that lower energy prices reduce headline inflationary pressure, potentially altering the trajectory of interest rate decisions. Marine insurance premiums and tanker rate volatility declined as reopening expectations reduced perceived operational risk in Gulf shipping lanes.
The refined products complex moved in parallel with crude:
- Heating oil fell 3%, reducing cost pressures for aviation and heating fuel consumers
- Wholesale gasoline dropped 4%, with downstream implications for transport costs and consumer price indices
- Natural gas futures declined 3%, reflecting the broad-based nature of the energy risk repricing rather than any supply-specific natural gas development
A durable resolution of the US-Iran conflict would represent one of the most significant single-event reductions in global energy risk premium in recent years. The downstream effects — from airline operating costs and shipping rates to petrochemical feedstock pricing and agricultural input costs — would ripple across virtually every sector of the global economy in ways that a simple crude price chart does not capture.
Frequently Asked Questions
Why did oil prices plunge after the US-Iran agreement was announced?
The agreement commits to reopening the Strait of Hormuz within 30 days and lifting the US naval blockade on Iranian port traffic. Markets immediately priced in the anticipated return of supply that had been disrupted since late February, producing single-session declines of approximately 4.8% for WTI and 4.9% for Brent crude.
Is the oil price drop likely to be permanent?
Historical precedent from this same conflict suggests significant caution is warranted. The April 8 ceasefire produced a comparable price collapse before strikes resumed in late May and June. The June agreement's durability depends on successful implementation of complex and sequenced conditions, including nuclear dismantlement and verified sanctions compliance.
What is Mexico's oil price assumption for budget planning?
The SHCP's Pre-Criterios 2027 revised Mexico's 2026 oil price assumption upward to US$77.3 per barrel in response to the conflict. Monday's WTI close remains above this threshold, but further declines toward the US$60s would create fiscal pressure.
How does lower oil prices affect PEMEX's export revenue specifically?
PEMEX export volumes were already running approximately 20% below annual targets at an average of 418,200 barrels per day in April 2026. Falling per-barrel prices applied to an already-constrained volume base creates a compounded revenue shortfall that is larger than either variable would imply independently.
What role does OPEC+ play in post-agreement price dynamics?
OPEC+ had executed four consecutive quota increases leading into June, but Rystad Energy had assessed these increases as having limited real market impact while Hormuz remained closed. With reopening expected within 30 days, previously neutralised supply will begin flowing into global markets, potentially amplifying downward price pressure beyond the diplomatic announcement effect alone.
What is the IEPS fuel subsidy and how does it interact with oil prices?
The IEPS is Mexico's fuel price stabilisation mechanism that absorbs the gap between international crude prices and domestic pump prices. During the conflict-driven price spike, this cost approximately MX$2.5 billion per week. Falling international prices reduce this burden, providing partial fiscal relief that partially offsets the revenue loss from lower PEMEX export earnings.
Want To Know Which ASX Mineral Discoveries Could Deliver the Next Major Return?
While geopolitical events like the US-Iran agreement reshape global energy markets in real time, Discovery Alert's proprietary Discovery IQ model cuts through the complexity of ASX announcements across 30+ commodities to deliver instant, actionable alerts on significant mineral discoveries — explore historic discovery returns to see what's possible, and begin your 14-day free trial today to position yourself ahead of the broader market.