July 29, 2026
Three Forces Colliding: How Inventory Data, OPEC+ Strategy, and Geopolitical Risk Drove Oil Prices Rebound on Tightening US Crude Supplies
When commodity markets move by more than two dollars per barrel in a single session, the explanation is rarely simple. Price swings of that magnitude typically reflect the convergence of multiple independent forces arriving at the same moment, compressing what might otherwise be weeks of gradual repricing into hours of violent repositioning. Understanding why oil prices rebound on tightening US crude supplies requires looking well beyond the headline number and examining the structural mechanics beneath it.
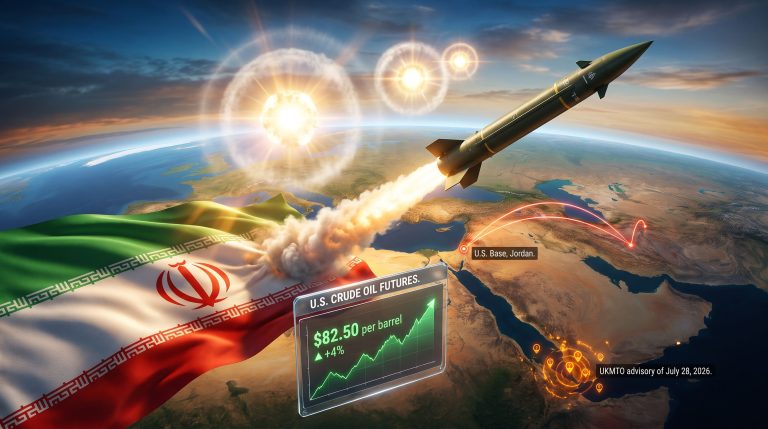
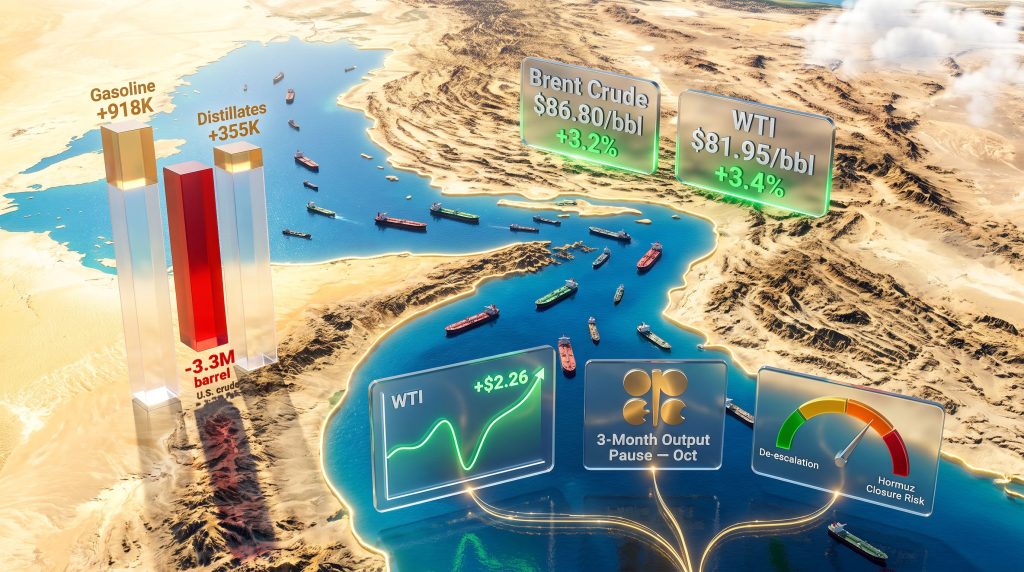
On July 29, 2026, global crude benchmarks surged sharply in early trade, with Brent futures climbing $2.71, or 3.2%, to $86.80 per barrel, while WTI crude added $2.26, or 3.4%, to reach $81.95 per barrel. The session followed a 5% collapse the prior day, itself triggered by diplomatic signals around the U.S.-Iran conflict. What unfolded across those two sessions illustrates, with unusual clarity, the layered architecture of modern oil price formation. For additional context, current crude oil prices provide a useful baseline for understanding how these movements compare historically.
When big ASX news breaks, our subscribers know first
What Is Driving the Oil Price Rebound? Understanding the Supply-Side Mechanics
The Inventory Signal: Why a 3.3 Million Barrel Draw Matters More Than It Sounds
Weekly crude inventory figures released by the American Petroleum Institute serve as one of the most closely watched leading indicators in global energy markets. These preliminary estimates, published each Tuesday evening, capture changes in U.S. crude stockpiles at a granular level that allows traders to infer whether domestic supply is tightening or accumulating ahead of the official Energy Information Administration data release the following Wednesday.
For the week ended July 24, 2026, API data indicated that U.S. crude inventories fell by approximately 3.3 million barrels. That figure substantially exceeded consensus analyst expectations, which had projected a modest draw of around 1 to 1.5 million barrels based on seasonal refinery run rates and import flow patterns.
"A crude inventory draw of 3 million barrels or more in a single week is typically interpreted by energy traders as a signal that domestic demand is absorbing supply faster than it is being replenished, a condition that structurally supports higher spot prices."
The asymmetric price reaction to inventory draws of this scale is not accidental. It reflects the way physical crude markets operate on relatively tight marginal balances. A 3.3 million barrel draw in a single week, against a total U.S. commercial crude inventory base of roughly 420 to 440 million barrels in normal conditions, represents a meaningful percentage shift that supply-side traders cannot ignore.
Critically, because the U.S. is the world's largest crude producer and one of its largest consumers, its inventory movements function as a bellwether for global supply-demand balance in a way that no other country's data can replicate. Furthermore, crude oil price trends over recent years demonstrate just how sensitive markets remain to these weekly signals.
It is also worth noting the structural distinction between API and EIA data. The API releases its figures based on member company self-reporting, making it a useful but preliminary signal. The EIA's official count, compiled through a broader government survey methodology, sometimes diverges meaningfully from the API estimate. Markets typically price in the API data the evening of release, then recalibrate when EIA confirms or contradicts those numbers the following morning. This two-stage reaction pattern can amplify intraday price moves when both datasets align directionally.
Gasoline and Distillate Inventories: A Mixed Signal Beneath the Headline
While the crude draw generated the headline-grabbing momentum, the broader inventory picture for the same week was more nuanced. Gasoline stocks rose by 918,000 barrels, while distillate inventories added 355,000 barrels compared with the prior week.
| Product | Inventory Change (Week Ended July 24, 2026) | Market Implication |
|---|---|---|
| U.S. Crude Oil | -3.3 million barrels | Tightening supply signal, bullish for WTI |
| Gasoline | +918,000 barrels | Demand softness or elevated refinery output |
| Distillates | +355,000 barrels | Modest build, neutral-to-slightly bearish |
These diverging movements across the petroleum complex tell a more complicated story than the crude headline alone. A gasoline build alongside a crude draw typically suggests that refineries were running at elevated utilisation rates, converting crude into finished products faster than end-user demand could absorb those outputs. This phenomenon is often captured through the concept of crack spreads, which measure the margin refineries earn by processing crude into gasoline and distillates.
When crack spreads compress due to product inventory builds, refinery incentives to run at high utilisation weaken over subsequent weeks. This feedback loop matters for crude demand projections: if refinery throughput slows in response to product inventory accumulation, the pace of future crude draws could moderate, consequently tempering some of the bullish inventory narrative.
How Do Geopolitical Shocks Translate Into Oil Price Volatility?
The Strait of Hormuz as a Global Oil Chokepoint: Economic Anatomy of a Disruption
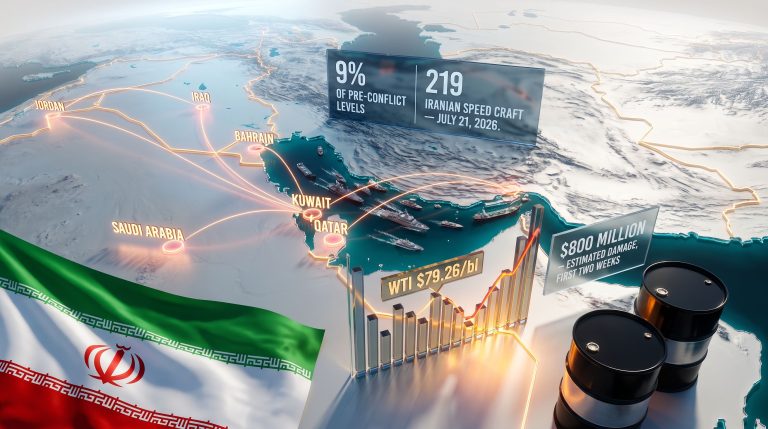
Few geographic features carry more economic consequence per square kilometre than the Strait of Hormuz. This narrow waterway, at its most constrained point spanning roughly 21 nautical miles, serves as the primary maritime exit route for crude exports from Saudi Arabia, Iraq, Kuwait, the UAE, and Iran. Approximately 20% of globally traded oil passes through this corridor, according to U.S. Energy Information Administration estimates, making it the single most critical chokepoint in the world energy system.
The U.S.-Israeli conflict with Iran, which resulted in the effective closure of Hormuz transit flows, represents a supply disruption scenario that energy market scenario planners have long modelled but rarely seen materialise at this scale. Even a partial or threatened closure introduces what traders call a geopolitical risk premium into Brent pricing.
Because Brent crude is the international benchmark and is priced against seaborne Atlantic Basin and Middle Eastern supplies, it is inherently more exposed to Hormuz disruptions than WTI, which reflects landlocked U.S. domestic production less directly tied to Gulf shipping lanes.
Historical precedents for Hormuz closure threats, including the 2019 tanker incident period and the 2012 sanctions escalation against Iran, produced temporary but significant Brent premiums in the range of $5 to $15 per barrel depending on perceived closure probability. The current conflict context appears to be sustaining a more persistent risk premium given the active nature of hostilities rather than the threatened escalations of prior episodes.
Why Oil Prices Fell 5% Before Rebounding: The Ceasefire-Volatility Cycle
The session immediately preceding the rebound saw Brent and WTI both plunge approximately 5% to two-week lows. That move was driven by signals that a pause in U.S. bombing operations had introduced diplomatic oxygen into the U.S.-Iran standoff. U.S. President Donald Trump called off a two-week bombing campaign over the preceding weekend and subsequently indicated that productive conversations with Iranian counterparts were underway, though he simultaneously warned of resumed military action if negotiations failed.
Iran's public response contradicted this framing, with Iranian officials denying that any meaningful resumption of negotiations was occurring. This created what traders describe as a contradictory signal environment, where both escalatory and de-escalatory narratives existed simultaneously, making probability-weighted pricing exceptionally difficult.
"In geopolitically driven commodity markets, the spread between confirmed facts and diplomatic signals can be worth several dollars per barrel. Traders price probability, not certainty, meaning a credible signal of potential peace can move markets as powerfully as a verified escalation."
This whipsaw pattern — a 5% loss followed by a 3%+ recovery within 24 hours — is characteristic of markets attempting to price a binary conflict outcome before the outcome is known. The asymmetry of information between governments and market participants creates persistent opportunities for sharp reversals as new signals arrive. Reuters reporting from the session captures these dynamics in detail.
Oman's Hormuz Proposal: What a Voluntary Fee Structure Would Mean for Oil Markets
A particularly noteworthy development involved Oman presenting Iran with a framework for managing Strait of Hormuz transit through a voluntary fee collection mechanism. The proposal, reportedly backed by Gulf state governments, is framed as a potential basis for ending trade disruption through the strait without requiring a full resolution of the broader U.S.-Iran conflict.
The concept of a managed-access framework for a critical maritime chokepoint is historically unusual. While toll-based access to canals such as the Suez and Panama is well established, the Strait of Hormuz is technically international waters, making any fee collection regime legally and diplomatically complex. The practical implication for oil markets would depend entirely on implementation: if such a framework restored meaningful crude flow through the strait, it would likely compress the geopolitical risk premium embedded in Brent pricing, potentially removing several dollars per barrel from current levels.
What Role Is OPEC+ Playing in the Current Price Recovery?
OPEC+ Output Strategy: Why a Three-Month Pause on Production Increases Changes the Supply Calculus
Compounding the inventory and geopolitical signals, reports indicated that OPEC+ was likely to halt scheduled oil output increases for three months starting in October 2026. This pause would come after the group completes the planned return of barrels that had been withheld under previous voluntary cut agreements. The OPEC influence on oil pricing has consistently demonstrated that even signalled policy shifts can move markets significantly ahead of formal announcements.
The mechanics of this decision matter for understanding its market impact. OPEC+ has been gradually unwinding voluntary production cuts that were implemented during periods of demand weakness. Each incremental return of withheld barrels adds supply to a market that is simultaneously grappling with conflict-related disruptions. A three-month pause on further increases effectively removes one source of bearish supply pressure during a period when physical markets are already tightening.
| Driver Type | Current Example | Price Impact | Duration |
|---|---|---|---|
| Inventory Draw | -3.3M barrel U.S. crude draw | Immediate bullish | Days to weeks |
| OPEC+ Policy Signal | Potential 3-month output pause | Medium-term bullish | Weeks to months |
| Geopolitical Risk Premium | U.S.-Iran conflict and Hormuz closure | Highly volatile | Event-dependent |
| Diplomatic De-escalation | Ceasefire pause and contradictory signals | Short-term bearish | Hours to days |
OPEC+ and the Geopolitical Overlay: Coordinating Supply Policy During Active Conflict
What makes the current OPEC+ dynamic particularly complex is the need to calibrate supply policy against a backdrop of active armed conflict involving member-adjacent states and a major global transit corridor. The group faces competing internal incentives: Gulf producers with high fiscal breakeven prices benefit from sustained higher oil revenues, while those seeking to protect long-term market share have historically resisted prolonged output restraint.
Furthermore, OPEC demand forecasts have added another layer of uncertainty to this calculus, as revised outlooks shift the internal debate over how aggressively to manage supply constraints. A lesser-appreciated dimension of OPEC+ accounting during conflict periods involves what analysts sometimes call shadow supply — the volume of crude from sanctioned, conflict-affected, or informally trading member states that flows to markets outside official OPEC+ output frameworks.
Brent vs. WTI: What the Price Spread Reveals About Market Structure
Decoding the Brent-WTI Differential During Supply Disruptions
The Brent-WTI spread of approximately $4.85 per barrel observed on July 29, 2026 reflects several structural realities about how these two benchmarks respond differently to Middle Eastern supply disruptions.
| Benchmark | Price (July 29, 2026) | Daily Change | % Change |
|---|---|---|---|
| Brent Crude Futures | $86.80/barrel | +$2.71 | +3.2% |
| WTI Crude Futures | $81.95/barrel | +$2.26 | +3.4% |
| Brent-WTI Spread | ~$4.85/barrel |
Brent, as an internationally traded benchmark priced against North Sea production and settled against global seaborne cargoes, carries more direct exposure to Middle Eastern supply route disruptions. When Hormuz-related risk is elevated, Brent tends to absorb a larger share of the geopolitical premium than WTI, which primarily reflects conditions in the U.S. domestic market, including Cushing, Oklahoma storage levels and Gulf Coast export infrastructure.
U.S. shale production, which now exceeds 13 million barrels per day according to EIA figures, provides a meaningful supply buffer that partially insulates WTI from external geopolitical shocks. Shale's relatively short production cycle — with wells coming online within weeks to months of drilling decisions compared with years for conventional projects — means the U.S. domestic supply picture can respond to price signals faster than Middle Eastern conventional production can.
What Does a $2+ Single-Session Recovery Signal About Market Sentiment?
Single-session recoveries of more than $2 per barrel are statistically uncommon outside of genuinely significant supply or sentiment catalysts. When they occur, they frequently reflect a combination of genuine fundamental buying from physical market participants and short-covering activity from traders who had established bearish positions during the prior session's sell-off.
Open interest data provides a complementary lens for interpreting such moves. When a sharp price decline is accompanied by rising open interest, it suggests genuine new short selling. When a subsequent recovery occurs with declining open interest, it points more toward short covering than fundamental buying conviction. This distinction matters for assessing whether a rebound represents durable price support or a temporary technical correction.
How Should Energy Market Participants Interpret Short-Term Oil Price Swings?
The Three-Layer Framework for Analyzing Oil Price Movements
Experienced energy analysts approach single-session price moves through a structured analytical lens that avoids attributing outsized influence to any single variable. A practical framework involves three sequential layers:
- Layer 1: Fundamental Supply and Demand — This encompasses inventory levels, refinery utilisation rates, production volumes from key regions, and demand indicators from major consuming economies. The 3.3 million barrel U.S. crude draw operates at this layer.
- Layer 2: Structural Policy — OPEC+ production decisions, U.S. Strategic Petroleum Reserve activity, export quota management, and bilateral trade flow arrangements. The reported three-month OPEC+ output pause operates here.
- Layer 3: Geopolitical Risk Premium — Conflict escalation and de-escalation cycles, chokepoint threat credibility, diplomatic signalling, and the probability-weighted market assessment of supply disruption duration. The Hormuz closure and U.S.-Iran negotiations operate at this layer.
"Experienced energy analysts rarely attribute a single-session price move to one cause. The most accurate interpretations layer inventory fundamentals over policy signals, then apply a geopolitical risk premium that fluctuates with the credibility of conflict resolution efforts."
The next major ASX story will hit our subscribers first
Frequently Asked Questions: Oil Prices and US Crude Supply Dynamics
Why do U.S. crude inventory figures move global oil prices?
The U.S. functions as the world's largest crude oil producer, making its weekly inventory shifts a meaningful proxy for global supply-demand balance. When U.S. stockpiles draw down sharply, it signals that domestic consumption and export demand are absorbing available supply faster than production and imports can replenish it, a condition that tightens the global physical market.
What is the difference between API and EIA inventory data?
The API publishes preliminary estimates based on member company self-reporting each Tuesday evening. The EIA releases government-verified official figures the following Wednesday. Markets typically react to API data in after-hours trading, then adjust again when EIA data either confirms or contradicts the preliminary reading.
How does a Strait of Hormuz disruption affect oil prices?
Approximately 20% of globally traded oil transits this waterway. Even a partial closure or credible closure threat introduces a risk premium that elevates Brent prices more acutely than WTI, given Brent's greater exposure to Middle Eastern supply routes and seaborne cargo pricing.
What does an OPEC+ output pause mean for consumers?
A pause in scheduled production increases constrains the rate at which additional supply enters the market. This supports firmer prices at the wholesale level, with the impact typically working through the physical distribution chain over a period of weeks to months before manifesting at the retail level.
Why do oil prices sometimes fall on peace talks and rise on conflict?
Markets price risk premiums during active conflict. When diplomatic signals suggest de-escalation, traders reduce their probability-weighted assessment of sustained supply disruption, compressing the risk premium and pushing prices lower. Contradictory signals — where one party signals progress while another denies engagement — create the whipsaw conditions seen across these two sessions.
Key Takeaways: What the Oil Price Rebound Tells Us About Global Energy Markets
The convergence of three independent catalysts within a single trading session produced a price move that, in isolation, any one factor would have been unlikely to generate alone. The 3.3 million barrel U.S. crude draw provided the fundamental anchor. The OPEC+ output pause signal added medium-term supply constraint credibility. The recalibration of the Hormuz geopolitical risk premium after one-sided ceasefire optimism had temporarily suppressed it completed the sequence.
Several structural observations emerge from this episode:
- Single-session moves exceeding $2 per barrel reflect genuinely significant supply or sentiment catalysts, not routine market noise.
- The Brent-WTI spread behaviour during Hormuz disruptions consistently demonstrates that international benchmarks carry disproportionate geopolitical exposure relative to landlocked domestic benchmarks.
- The API-to-EIA data release sequence creates a two-stage repricing opportunity that sophisticated traders exploit systematically.
- OPEC+ production decisions do not operate independently of geopolitical conditions; when conflict disrupts transit infrastructure, supply restraint decisions compound rather than offset existing tightness.
Looking forward, sustaining Brent prices above the $85 to $87 per barrel range requires at least two of the three current support pillars to remain intact. A credible Hormuz resolution that restores full transit flows would remove the geopolitical premium and could push Brent meaningfully below $80 in the near term. Conversely, a renewed escalation of hostilities combined with OPEC+ maintaining its output restraint posture could sustain or extend the current pricing environment well into the fourth quarter of 2026.
"The oil market's current volatility is not incidental noise. It reflects a supply environment simultaneously shaped by OPEC+ discipline, U.S. shale dynamics, and an active geopolitical conflict affecting one of the world's most critical maritime corridors. Directional clarity will only emerge when at least one of these three variables stabilises sufficiently for markets to anchor a durable price expectation."
Disclaimer: This article is intended for informational purposes only and does not constitute financial or investment advice. Oil price forecasts and market projections involve inherent uncertainty. Readers should conduct independent research and consult qualified financial professionals before making investment decisions. All price figures referenced are sourced from Reuters reporting dated July 29, 2026.
Want to Position Yourself Ahead of the Next Major Commodity Discovery?
While oil markets are shaped by geopolitical risk and supply dynamics, significant mineral discoveries on the ASX can deliver equally transformative returns — and Discovery Alert's proprietary Discovery IQ model ensures subscribers receive real-time alerts the moment those opportunities emerge. Explore historic examples of exceptional discovery outcomes and begin your 14-day free trial today to gain an immediate market edge.