July 28, 2026
The Gap Between Market Sentiment and Physical Reality in Oil Markets
Few situations in commodity markets are more instructive than when price signals and fundamental data move in opposite directions. Oil markets are doing exactly that right now. Prices have retreated sharply, driven by diplomatic headlines and the removal of a geopolitical risk premium. Yet the physical data underpinning supply conditions has continued to deteriorate, and forecast revisions from major institutions point to a 2026 supply picture that is meaningfully tighter than current prices suggest.
Understanding why oil prices retreat while the 2026 supply deficit doubles requires separating two distinct forces: the short-term sentiment response to geopolitical events, and the slower-moving structural reality of damaged export infrastructure, rerouted shipments, and production capacity that cannot be restored by a diplomatic pause alone. Furthermore, the oil price movements we have observed in recent months underscore just how rapidly sentiment can decouple from physical fundamentals.
When big ASX news breaks, our subscribers know first
The Forecast Reversal That Markets Appear to Be Ignoring
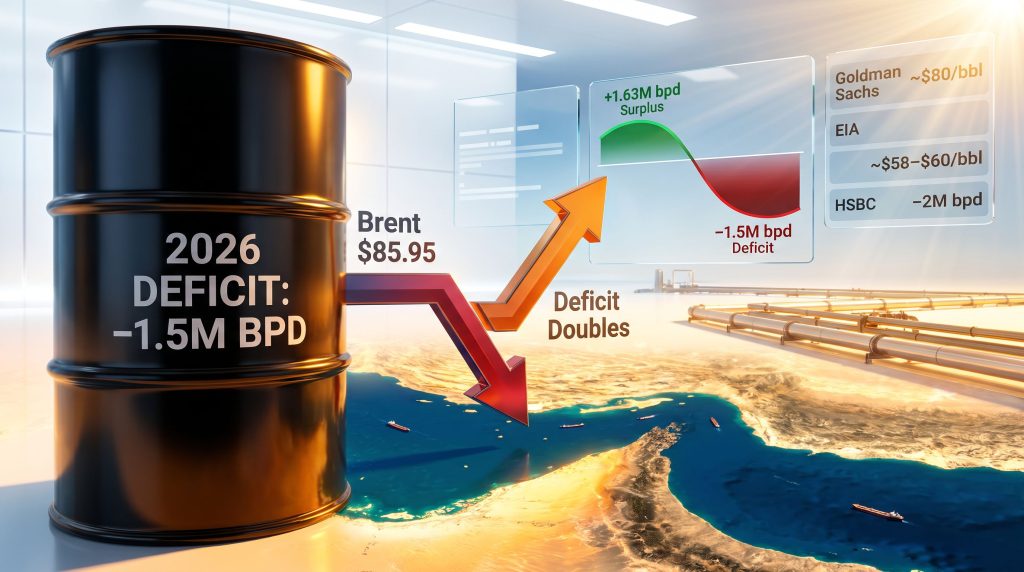
The scale of the shift in 2026 supply forecasts is difficult to overstate. Before the escalation of Middle East conflict, the consensus expectation among energy analysts pointed to a surplus of approximately 1.63 million barrels per day for 2026. That figure has since been completely reversed. A Reuters analyst poll now places the 2026 deficit at 1.5 million barrels per day, representing a swing of roughly 3.1 million barrels per day in the fundamental supply-demand balance within a matter of months.
The progression of revisions is particularly striking:
- The April 2026 Reuters poll estimated a deficit of approximately 750,000 barrels per day
- The most recent poll has revised that estimate upward to 1.5 million barrels per day, a near-doubling
- HSBC has modelled a more severe scenario in which gradual restoration of Gulf production results in a deficit approaching 2 million barrels per day
What makes this especially notable is the divergence between the most bearish and most deficit-focused institutional forecasts:
| Forecaster | 2026 Brent Price Target | Supply Outlook |
|---|---|---|
| Goldman Sachs | ~$80/bbl (Hormuz reopens) | Moderate surplus possible |
| HSBC | Elevated | Up to -2 million bpd deficit |
| Reuters Analyst Poll | Not specified | -1.5 million bpd deficit |
| IEA (July Outlook) | Surplus possible late 2026 | Conditional on Hormuz recovery |
| U.S. EIA | ~$58-$60/bbl | Supply outpaces demand |
| J.P. Morgan | ~$58-$60/bbl | Bearish on price |
The range between the EIA and J.P. Morgan's ~$58/bbl projections and HSBC's 2 million bpd deficit scenario represents one of the widest forecast dispersions in recent oil market history. This dispersion is itself a signal: supply uncertainty is structurally elevated, and the market has not yet settled on which scenario is most probable.
Why Prices Fell Despite a Worsening Fundamental Outlook
The Mechanics of the Geopolitical Risk Premium
Oil markets routinely embed a risk premium during periods of geopolitical stress. This premium functions as a temporary price buffer that compensates for the possibility of further supply disruption. It is not anchored to physical flows directly, but to the perceived probability that conditions could deteriorate further.
When the United States suspended its air-strike campaign against Iran, that probability was revised downward in a single session. The result was an approximately 8% decline across both major benchmarks, with Brent falling from $87.86 per barrel toward $85.95 intraday and WTI moving from $82.24 to approximately $80.81. Both benchmarks reached their lowest levels since July 20, 2026 during the same session.
The critical insight here is the asymmetry involved. The risk premium can be removed almost instantly when diplomatic signals emerge, but the underlying physical constraints cannot resolve at the same speed. Infrastructure takes time to repair, rerouted shipping lanes take weeks to normalise, and insurance markets for war-risk coverage do not reprice overnight. The trade war impact on oil has similarly demonstrated how quickly sentiment shifts can mask slower-moving structural realities.
Asian Demand Softness as a Secondary Headwind
Alongside the diplomatic catalyst, softening demand signals from Asia have added additional downward pressure on prices. Asia historically functions as the marginal driver of global oil consumption growth, meaning that weaker purchasing signals from the region carry disproportionate weight in near-term price formation. When demand-side weakness coincides with diplomatic de-escalation, the combined effect on sentiment can produce price declines that appear larger than the underlying fundamentals would justify.
This does not mean the demand signal is wrong. However, it does mean that near-term price weakness may be compressing a forward supply risk that remains very much intact.
What the Physical Flow Data Actually Shows
Hormuz: The Numbers Behind the Headlines
While futures markets priced in diplomatic optimism, the tanker tracking and port data for the Strait of Hormuz told a different story. Hormuz crude and refined product exports averaged 2.9 million barrels per day during the relevant period, compared to 5.9 million barrels per day the prior week. Persian Gulf oil flows as a whole remained at just 41% of prewar levels.
| Metric | Prewar Level | Current Level | Change |
|---|---|---|---|
| Hormuz crude and product exports | ~5.9 million bpd | 2.9 million bpd | -51% |
| Persian Gulf oil flows | 100% (baseline) | 41% of baseline | -59% |
| Red Sea shipments | Baseline | -3+ million bpd | Significant decline |
| OPEC+ June production | ~43 million bpd | 36.28 million bpd | -15.6% |
These figures represent the physical reality behind the price move. A diplomatic pause does not reopen an export corridor. It does not repair damaged petroleum infrastructure. It does not restore tanker routing confidence in a region where Houthi forces claimed an attack on the East-West Pipeline to Yanbu and Iran-backed groups launched drones targeting petroleum facilities near Riyadh. Consequently, the complexities surrounding geopolitical tensions and OPEC continue to shape supply outcomes in ways that diplomatic headlines simply cannot resolve overnight.
The Red Sea Dimension
The Strait of Hormuz is not the only chokepoint under pressure. Red Sea shipments declined by more than 3 million barrels per day in a single week. Saudi Arabia has rerouted a portion of its exports through the Suez Canal to reduce exposure to Red Sea transit risk, while Russia also reduced its Red Sea shipment volumes over the same period.
What makes the Red Sea disruption particularly significant for longer-term supply analysis is that it affects not just crude oil exports but also refined product flows, adding complexity to regional refining economics and extending the cost impact beyond the upstream sector.
The OPEC+ Equation: Why Higher Quotas May Not Solve the Supply Problem
OPEC+ is widely expected to raise its September output target by approximately 188,000 barrels per day at its August 2, 2026 meeting. For context, this figure needs to be measured against the actual production gap that has emerged since the conflict began.
June production across the group stood at 36.28 million barrels per day, compared to approximately 43 million barrels per day before the war. That is a structural shortfall of roughly 6.7 million barrels per day between prewar capacity and current output. A quota increase of 188,000 barrels per day covers less than 3% of that gap.
Step-by-Step: How to Interpret OPEC+ Quota Changes During Supply Disruptions
- Establish the actual baseline: Compare announced increases against prewar production levels rather than prior quota figures, which may already reflect earlier cuts
- Assess physical capacity: Determine whether member states have the infrastructure integrity to meet new targets, given conflict-related damage
- Evaluate non-OPEC+ offset potential: Consider whether US shale, Canadian oil sands, or Brazilian deepwater can realistically bridge the remaining gap on a relevant timescale
- Examine futures curve structure: Assess how much of the deficit is already embedded in the forward curve versus spot prices, which can reveal where mispricing exists
- Cross-reference physical flow data: Tanker tracking and port statistics provide ground-truth verification of whether quota increases are translating to actual shipments
The key point is that a quota decision is a policy instrument, not a production guarantee. Where conflict has damaged export infrastructure, rerouting costs are elevated, and insurance markets have tightened, the conversion rate from quota to physical barrel is materially lower than in normal operating conditions.
Energy Cost Inflation and the Industrial Cost Base
What an Oil Supply Shock Does to Mining Economics
The implications of sustained energy price elevation extend well beyond the oil market itself. S&P Global Market Intelligence modelled a comparable Middle East energy disruption scenario and found that it raised the global iron ore cost base from $50.81 to $56.57 per dry metric ton, an increase of 11.3%. Diesel alone contributed $1.54 per dry metric ton to that cost increase.
This modelling is directly relevant to commodity prices and mining performance, because diesel is the primary energy input for open-pit mining operations, haul truck fleets, and mineral processing facilities. When crude oil prices remain elevated, or when refinery supply chains are disrupted, the diesel price impact on mining operating costs can be both immediate and sustained.
US retail diesel averaged $5.134 per gallon as of July 20, 2026, up $0.338 on the week and $1.322 year-over-year. The gap between this physical fuel market pricing and the direction of oil futures illustrates the transmission lag between forward curve movements and actual cost conditions on the ground.
Integrated Miners vs. Independent Operators
| Cost Component | Prewar Baseline | Post-Disruption Estimate | Change |
|---|---|---|---|
| Global iron ore cost base | $50.81/dry metric ton | $56.57/dry metric ton | +11.3% |
| Diesel contribution | Baseline | +$1.54/dry metric ton | Additional cost |
| US retail diesel (July 20) | ~$3.81/gallon (prior year) | $5.134/gallon | +$1.322 YoY |
Producers with owned shipping fleets and active energy hedging programs absorb a materially smaller proportion of energy cost increases than independent operators who rely on spot freight and unhedged diesel purchases. This cost asymmetry is an underappreciated differentiator in mining equity analysis during commodity supply shocks.
The structural advantage held by integrated miners during periods of energy price volatility tends to compress the relative margins of independent producers more severely. For investors analysing mining equities during an oil supply disruption, energy cost resilience is a more meaningful variable than it appears in normalised market conditions. In addition, the broader resource and energy export challenges facing commodity-dependent economies further compound these dynamics for producers operating across global supply chains.
The next major ASX story will hit our subscribers first
Three Scenarios for Oil in 2026
Scenario 1: Full Hormuz Recovery
If diplomatic negotiations produce a clean resolution and Hormuz transit volumes recover to prewar levels, Goldman Sachs projects Brent could moderate toward $80 per barrel by year-end. This scenario is consistent with the IEA's conditional July outlook, which suggested the market could return to surplus by late 2026. Under this pathway, the near-term price weakness would prove to have been an accurate forward signal.
Scenario 2: Partial Recovery with Ongoing Red Sea Disruption
If Hormuz sees partial normalisation but Red Sea attacks continue and Saudi infrastructure remains at risk, the 2026 deficit holds near the 1.5 million bpd Reuters poll baseline. Brent would likely remain supported in the high $80s. OPEC+ quota increases fail to close the physical gap, and the cost base for energy-intensive industries remains elevated through the year.
Scenario 3: Renewed Escalation
A resumption of US strikes on Iran, which President Trump has explicitly flagged as a possibility if negotiations fail, would remove the diplomatic premium in reverse and likely push Brent sharply higher. Under HSBC's more severe modelling, the deficit could widen toward 2 million barrels per day, potentially driving Brent toward or above prior highs near $100 per barrel. Mining and industrial cost bases would face further upward pressure in this scenario.
What the Next Catalysts Reveal About Mispricing
Two near-term data releases carry particular significance for investors positioning around this divergence between price and fundamentals.
The OPEC+ August 2 meeting will provide the first official signal of whether the group is prepared to attempt a more meaningful production response to the supply gap, or whether the 188,000 bpd increment represents the ceiling of near-term ambition. Any signal of larger coordinated output increases from members with intact infrastructure would shift the scenario probability distribution toward Scenario 1.
The EIA Weekly Petroleum Status Report for the week ended July 24, 2026 will reveal whether US inventory builds are partially offsetting global supply shortfalls. A larger-than-expected inventory draw would confirm that physical tightness is persisting despite the diplomatic backdrop, strengthening the case that supply risks remain underpriced.
Furthermore, the Reuters analyst poll methodology — drawing on a broad base of institutional forecasters — provides one of the more reliable aggregated signals for tracking how the broader analyst community is revising its view of the 2026 supply balance as new data emerges.
The situation in which oil prices retreat while the 2026 supply deficit doubles is not necessarily a market error. It may reflect a rational reweighting of near-term probability distributions following the US strike pause. But it creates a measurable gap between current pricing and a range of plausible fundamental outcomes that investors cannot afford to ignore.
The physical data — including Hormuz flows at half their prior-week levels, Persian Gulf output at 41% of prewar capacity, and a global diesel price substantially above year-ago levels — has not resolved in line with the price move. Until it does, the asymmetry between diplomatic sentiment and physical supply reality remains a live and material risk factor across oil markets and the broader industrial cost base.
Disclaimer: This article contains forward-looking statements, forecasts, and analyst projections sourced from third-party institutions. These represent opinions and estimates subject to change and do not constitute investment advice. Readers should conduct independent research before making any investment decisions.
Want to Stay Ahead of Major Commodity Discoveries Before the Market Catches On?
Discovery Alert's proprietary Discovery IQ model scans ASX announcements in real time, instantly translating complex mineral data into actionable investment insights across oil-linked and resource sectors — precisely the kind of edge that matters when physical fundamentals and market sentiment diverge. Explore how significant mineral discoveries have historically generated substantial returns on Discovery Alert's dedicated discoveries page, and begin your 14-day free trial today to position yourself ahead of the broader market.