
July 14, 2026
The Geography of Vulnerability: Why One Narrow Passage Controls Global Energy
Few features on a world map carry the economic weight of a 33-kilometre-wide body of water connecting the Persian Gulf to the Gulf of Oman. The Strait of Hormuz is not simply a geographic curiosity — it is the most consequential chokepoint in the global energy architecture. Oil prices Strait of Hormuz attacks have become a defining market theme in 2026, as roughly 20% of the world's total oil supply moves through this corridor, alongside a significant share of global liquefied natural gas (LNG) exports. When military conflict threatens that passage, markets do not merely react — they reprice risk at a systemic level.
Understanding the current crisis requires stepping back from the day-to-day military developments and recognising the structural logic that makes the strait so uniquely vulnerable to disruption. Unlike most geopolitical flash points, Hormuz has no true peer. Pipeline alternatives exist — the UAE's Habshan-Fujairah pipeline and Saudi Arabia's East-West Pipeline can redirect some volumes — but neither possesses the throughput capacity to fully absorb the strait's flow. Analysts estimate that even under optimal rerouting conditions, effective disrupted flow through the strait could affect approximately 12.2 million barrels per day, a figure no alternative infrastructure can replace at scale.
The strait's maritime boundaries compound the strategic difficulty. Oman and Iran share oversight of the shipping lanes, and the narrow navigable channel runs through Iranian territorial waters on one side. This geographic reality means Iran retains an inherent ability to threaten or harass vessel movements without necessarily staging a full closure — a tool it has exercised repeatedly since the 1980s Tanker War, through the 2019 vessel seizures, and into the current 2026 escalation cycle. Furthermore, understanding oil price volatility trends is essential context for interpreting how rapidly markets can shift when this corridor is threatened.
When big ASX news breaks, our subscribers know first
The 2026 Escalation: How the Crisis Unfolded
A Ceasefire That Didn't Hold
A US-Iran memorandum of understanding signed on June 17, 2026 temporarily reduced hostilities and pushed oil prices toward multi-week lows. That calm proved short-lived. Within weeks, US military operations resumed, with American forces conducting three consecutive nights of strikes against Iranian positions. The ceasefire framework effectively collapsed under the weight of fundamentally incompatible strategic objectives held by both parties.
Iran's response moved beyond rhetoric. Iranian cruise missiles struck two UAE-flagged tankers operating in the southern lane of the strait within Omani territorial waters. The UAE Ministry of Defence confirmed the attacks, reporting one fatality — an Indian crew member — and eight additional personnel injured. These were not symbolic strikes; they targeted commercial vessels moving crude through one of the most heavily monitored shipping lanes on Earth. According to reporting from Al Jazeera, the sustained US-Iranian strikes have significantly complicated prospects for reopening the strait to normal commercial traffic.
The Naval Blockade and the 20% Fee Proposal
Washington's decision to reinstate a naval blockade of Iranian shipping marked a qualitative shift in the conflict beyond airstrikes alone. Blocking Iranian exports cuts off a critical revenue stream and tightens the global supply picture simultaneously. The proposal to charge vessels a 20% transit fee in exchange for US naval escort through the strait introduced an entirely novel economic dimension — effectively monetising military protection of a global commons.
This fee proposal, if operationalised, would represent an unprecedented structural cost embedded into every cargo transiting the world's most important energy corridor. Shipping companies, charterers, and end buyers would all face the question of who absorbs that cost, creating downstream pricing pressure across the entire supply chain. Consequently, the oil market disruption risks arising from this confrontation extend well beyond the immediate military exchange.
The Houthi Wildcard: A Second Corridor Under Threat
Yemen's Houthi movement launched missile strikes against Saudi Arabia, citing Saudi airstrikes on Houthi-controlled airport infrastructure as justification. The significance of this development extends beyond the immediate exchange of fire. The Red Sea corridor is Saudi Arabia's primary export route for crude and petroleum products destined for European and Asian markets. Any sustained Houthi campaign targeting Saudi crude infrastructure would compound the Hormuz supply risk with a second simultaneous corridor disruption.
Market analysts have characterised a dual-corridor disruption scenario — involving both the Strait of Hormuz and the Red Sea — as a macro-inflationary tail risk with implications extending well beyond oil pricing into central bank policy timelines across the US, EU, and Asia-Pacific.
The LNG dimension adds further complexity. Iranian strikes also targeted a Qatari LNG tanker — a development that extends the conflict's reach beyond crude oil. Qatar ranks among the world's largest LNG exporters, and the global LNG supply outlook is now materially affected as any sustained disruption to its export corridor carries direct consequences for European gas markets still managing post-Ukraine supply adjustments.
Oil Price Response: A Data-Driven Timeline
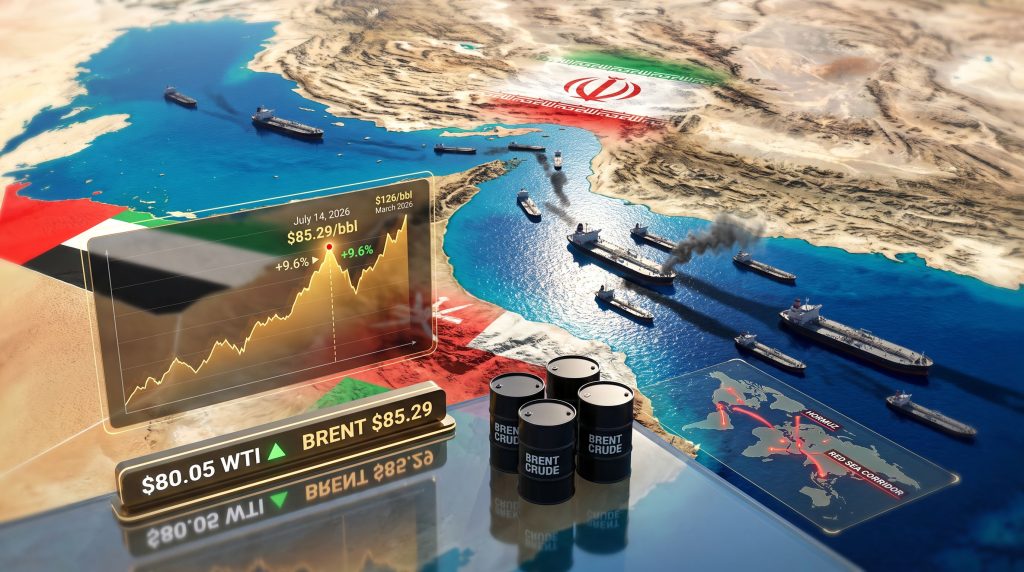
The market's reaction to the 2026 escalation has been both sharp and revealing. Brent crude's single-session gain of 9.6% in the session preceding July 14 represented the largest daily percentage increase since May 2020 — a period defined by the COVID-19 demand collapse and emergency OPEC+ intervention. That historical comparison is instructive: the scale of that earlier move reflected a genuine physical market dislocation, suggesting markets are treating the current oil prices Strait of Hormuz attacks as more than background noise.
| Date / Period | Brent Crude Price | Key Trigger |
|---|---|---|
| June 17, 2026 | Ceasefire-era lows | US-Iran MOU signed |
| Post-ceasefire collapse | ~$75.50-$80.00/bbl | Initial vessel attacks resume |
| Single-session surge | +9.6% (largest since May 2020) | US blockade reinstatement |
| July 14, 2026 | $85.29/bbl (+2.3%) | Ongoing escalation, tanker strikes |
| WTI equivalent | $80.05/bbl (+2.4%) | Mirroring Brent trajectory |
| March 2026 peak | ~$126/bbl | Iran restricts shipments by over 90% |
| Analyst upside scenario | $100+/bbl | Prolonged physical supply disruption |
On July 14, Brent crude futures settled at $85.29 per barrel, up $1.90 or 2.3%, while US West Texas Intermediate crude rose $1.91 or 2.4% to $80.05 per barrel (Reuters, July 14, 2026). Both contracts had earlier risen more than $2 before paring some gains, leaving prices at their highest since the June 17 ceasefire agreement.
Why Physical Tanker Data Matters More Than Headlines
The Leading Indicator That Markets Watch
Shipping movement data has become the primary real-time signal separating genuine supply disruption from geopolitical noise. Critically, shipping data confirmed that the number of tankers transiting the Strait of Hormuz fell to a two-month low within a single trading day following the latest escalation (Reuters, July 14, 2026). This distinction matters enormously for pricing:
- A perceived supply threat can inflate prices temporarily but tends to deflate once military activity stabilises without physical cargo disruption.
- An actual reduction in vessel transits signals that barrels are not reaching markets, creating genuine supply tightness that sustains higher price levels.
- Damage to export terminal infrastructure or confirmed cargo diversions would represent a further escalation in physical market impact beyond tanker route avoidance.
- The speed at which vessel numbers recover after an incident is itself a leading indicator of whether the geopolitical risk premium will persist or fade.
As KCM Trade's chief market analyst Tim Waterer noted, the competing objectives of both the US and Iran have made the supply picture highly uncertain even in the absence of a full closure (Reuters, July 14, 2026). This framing is analytically important: markets are not pricing a closure event — they are pricing uncertainty about the pathway toward one. The BBC's coverage of the Hormuz situation similarly highlights how rapidly this uncertainty is reshaping global energy security calculations.
The Geopolitical Risk Floor Concept
One of the more sophisticated market frameworks emerging from the 2026 crisis is what analysts are calling a persistent geopolitical risk floor beneath oil prices. This floor exists because the structural tension between US and Iranian objectives in the strait does not resolve with a single ceasefire or even a temporary de-escalation. The US seeks to maintain open passage while applying maximum economic pressure on Tehran; Iran retains the strait as its ultimate deterrent lever.
Phillip Nova analyst Priyanka Sachdeva identified physical tanker movement as the decisive variable to monitor, noting that any meaningful blockage of tanker traffic, prolonged vessel movement reductions, or export flow disruptions would likely trigger a further leg higher in oil prices (Reuters, July 14, 2026). Conversely, continued barrel movement despite the military escalation would allow part of the current geopolitical premium to gradually fade.
Downstream Consequences: Inflation, Inventories, and OPEC+ Positioning
How Oil Prices Transmit Into Broader Economies
Oil price spikes above the $85-$100 per barrel range historically transmit into retail fuel prices within two to four weeks across major consuming economies. The downstream effects are not limited to petrol stations:
- Aviation faces immediate jet fuel cost escalation, compressing airline margins and ultimately ticket prices.
- Shipping and logistics see freight rate increases that cascade through retail goods pricing.
- Petrochemicals and agriculture face input cost pressure from both energy and fertiliser price transmission.
- Headline CPI rises in response, complicating monetary policy decisions in economies already managing inflation targets.
The inflationary feedback loop from sustained Hormuz disruption creates a particularly awkward environment for central banks that had been anticipating a pathway toward interest rate reductions. A dual-corridor disruption scenario involving both the Strait of Hormuz and Red Sea shipping would represent a macro-inflationary shock capable of reversing rate cut timelines.
US Inventory Levels and the Buffer Problem
A preliminary Reuters market poll conducted ahead of the July 14 session indicated that US crude oil stockpiles were expected to have declined the prior week, while gasoline and distillate stocks were projected to have risen modestly. Monitoring US crude inventory trends is therefore increasingly critical, as falling crude inventories reduce the domestic buffer available to absorb import disruption and amplify price sensitivity to Hormuz developments. The modest gasoline and distillate build provides limited downstream relief but does not offset the upstream exposure created by tightening crude stocks.
OPEC+ and the Non-Gulf Production Response
OPEC's market influence is constrained in this scenario, as members with Hormuz-dependent export infrastructure face asymmetric exposure — Saudi Arabia, Iraq, Kuwait, the UAE, and Iran collectively account for the vast majority of strait throughput. Any emergency production increase from non-Gulf producers would require weeks to months to reach market at scale:
- US shale can theoretically respond within months but faces infrastructure and logistics constraints.
- West African producers have limited surge capacity on short timelines.
- North Sea output is structurally declining and cannot meaningfully offset Gulf disruption.
Saudi Arabia's own export flexibility is complicated by the Red Sea corridor risk. Gabelli Funds portfolio manager Simon Wong flagged in a July 14 note that any Houthi extension of attacks to Saudi crude products flowing through the Red Sea would add further uncertainty to regional crude flows (Reuters, July 14, 2026) — a scenario that would effectively compress Saudi Arabia's rerouting options from both directions simultaneously.
Frequently Asked Questions: Oil Prices and the Strait of Hormuz
What percentage of global oil supply passes through the Strait of Hormuz?
Approximately 20% of the world's total oil supply, along with a substantial share of global LNG, transits the strait, making it the single most strategically critical energy chokepoint on Earth.
What triggered the July 2026 oil price spike?
The resumption of US military strikes against Iran, reinstatement of a US naval blockade, Iranian cruise missile attacks on UAE-flagged tankers, and a measurable two-month low in tanker transits collectively pushed Brent crude to $85.29 per barrel on July 14, 2026.
Could oil prices breach $100 per barrel again?
Analysts identify a sustained physical disruption to tanker traffic as the primary catalyst for a move above $100/bbl. A dual-corridor disruption combining Hormuz and Red Sea interference represents the highest-risk pricing scenario currently being modelled. The oil prices Strait of Hormuz attacks dynamic is, consequently, the single most watched variable in energy markets.
How does the Hormuz crisis affect inflation?
Sustained oil price increases feed into transport, manufacturing, and agricultural input costs, contributing to headline inflation and potentially delaying or reversing central bank rate cut cycles.
What is the significance of the proposed 20% transit fee?
The fee proposal represents an unprecedented attempt to monetise US naval protection of the strait, introducing a novel cost structure into the global oil trade that would affect charterers, shippers, and end buyers across the supply chain.
The next major ASX story will hit our subscribers first
Key Takeaways for Monitoring the Hormuz Risk Premium
- Physical tanker transit data is the most reliable leading indicator — geopolitical risk premiums built on perceived threats deflate quickly if actual barrel flows continue uninterrupted.
- The structural US-Iran conflict over Hormuz creates a persistent geopolitical floor beneath oil prices that will not resolve through any single ceasefire or diplomatic gesture.
- The Houthi wildcard introduces a second corridor risk capable of transforming a regional energy disruption into a global supply shock with macro-inflationary consequences.
- Falling US crude inventory levels reduce the domestic buffer available to absorb import disruption, amplifying the price sensitivity of any Hormuz development.
- The $85-$100/bbl range represents the current near-term price sensitivity band, with tail-risk scenarios extending well beyond $100/bbl under conditions of sustained physical disruption.
- LNG markets face an underappreciated exposure through Qatar's export corridor — a dimension of the crisis that has received less attention than crude oil pricing but carries significant implications for European and Asian gas markets.
This article contains forward-looking analysis and scenario projections based on publicly available market data and analyst commentary as of July 14, 2026. Oil price forecasts and geopolitical scenarios involve significant uncertainty and should not be construed as financial or investment advice. Readers should conduct their own due diligence before making any investment decisions.
Want to Position Yourself Ahead of the Next Major Resource Discovery?
While geopolitical shocks like the Strait of Hormuz crisis reshape global commodity markets, Discovery Alert's proprietary Discovery IQ model scans ASX announcements in real time, instantly identifying significant mineral discoveries across 30+ commodities — explore historic discoveries and their returns to see how major finds have delivered exceptional outcomes, and begin your 14-day free trial at Discovery Alert to secure a market-leading edge before the broader market catches on.