
June 23, 2026
The Chokepoint That Moves Markets: Understanding the Strait of Hormuz Crisis
Every few years, global energy markets are reminded of a fundamental truth: the geography of oil matters as much as the geology of it. When a single waterway handles roughly one-fifth of the world's entire oil and gas consumption, any sustained disruption there does not merely inconvenience traders. It restructures the pricing architecture of global energy, sometimes for months or years at a time. That is precisely the dynamic now playing out as oil prices up as Strait of Hormuz remains shut continues to dominate market headlines, with Brent and WTI futures extending a seven-session winning streak and analysts debating not whether prices will stay elevated, but for how long.
Understanding what is actually happening, and what could happen next, requires looking beyond the war headlines and into the mechanics of physical energy delivery.
When big ASX news breaks, our subscribers know first
Why Oil Prices Keep Rising: The Core Mechanism
The question readers most urgently want answered is straightforward: why are crude prices climbing even after multiple rounds of diplomatic signalling?
The answer lies in a critical distinction. Markets are not simply reacting to geopolitical noise. They are repricing the physical availability of crude oil in a world where the primary export corridor for Middle Eastern producers remains functionally impaired. When vessel movement through the strait stays curtailed, regardless of what negotiators say in press conferences, the supply that global refiners depend on cannot reach them on schedule. That supply gap, not the rhetoric surrounding it, is what sustains the risk premium embedded in futures prices.
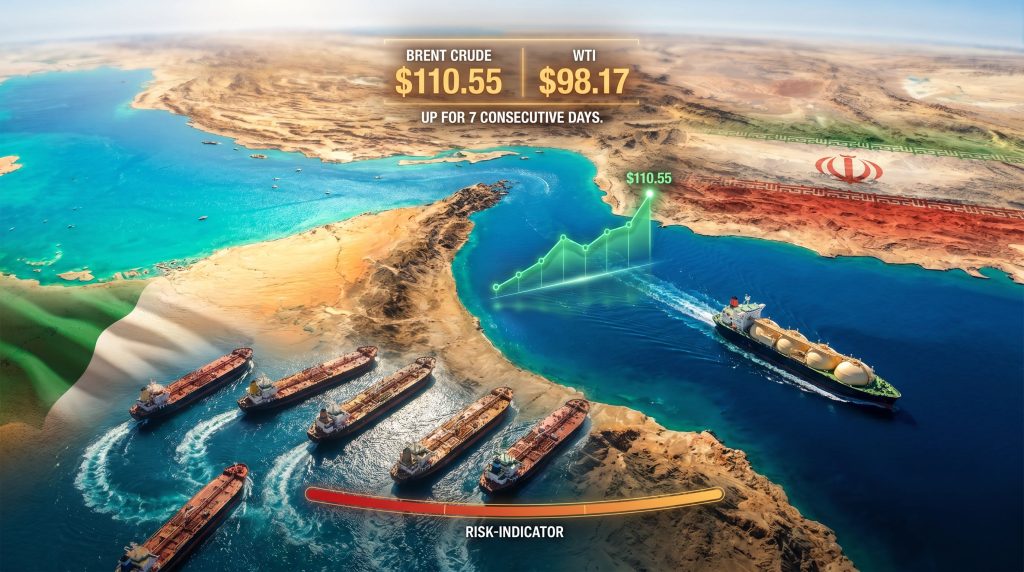
As of April 28, 2026, Brent crude futures for June had climbed $2.32, or 2.1 percent, to $110.55 per barrel as of 09:38 a.m. Saudi time, extending a gain of 2.8 percent recorded in the prior session, which represented the benchmark's highest close since April 7. The contract had posted gains for seven consecutive sessions. US West Texas Intermediate crude for June rose $1.80, or 1.9 percent, to $98.17 per barrel, following a 2.1 percent advance the session before.
These are not minor fluctuations. A seven-day streak in crude pricing reflects a market that has moved beyond the initial shock phase and is now pricing in the durability of disruption. Furthermore, the crude market dynamics at play here echo previous chokepoint crises, though the current scale of impairment is particularly acute.
How Important Is the Strait of Hormuz to Global Energy Markets?
To appreciate why this chokepoint commands such outsized influence over global pricing, consider the following metrics:
| Metric | Pre-Disruption Level | Current Signal | Why It Matters |
|---|---|---|---|
| Daily vessel transits | 125 to 140 vessels | Severely curtailed | Any reduction directly tightens physical supply |
| Iranian tankers turned back | N/A | 6 confirmed | Active interdiction, not passive deterrence |
| LNG tankers crossing | Multiple daily | 1 observed crossing | Near-complete suppression of LNG flows |
| Share of global oil and gas consumption | ~20% | Largely blocked | No comparable alternative route exists |
The strait, at its narrowest point, spans only about 33 kilometres, yet it connects the Persian Gulf producers, including Saudi Arabia, Iraq, Kuwait, the UAE, and Iran, to global markets. There is no infrastructure equivalent that can substitute for it at scale. The nearest alternatives, the Suez Canal and overland pipelines, handle fractions of Hormuz's volume and cannot be rapidly expanded.
Production vs. Deliverability: A Distinction That Matters
One important nuance that market coverage often glosses over is the difference between what producers can pump and what buyers can actually receive. These four concepts operate independently:
- Oil production: the volume extracted from reservoirs, which continues even during shipping disruptions
- Export capacity: the infrastructure available to load and dispatch crude, which may remain intact even during a blockade
- Physical transit: the actual movement of loaded tankers through the strait, currently the primary constraint
- Deliverability to buyers: whether refiners in Asia, Europe, and elsewhere can take custody of crude within their operational planning windows
It is the gap between export capacity and deliverability that the current disruption exploits. Oil may be produced and loaded, but if it cannot clear the strait, it piles up in storage or forces buyers to seek alternative sources at premium prices.
Three Scenarios That Define the Oil Price Outlook
Rather than treating the current disruption as a binary on-off switch, energy analysts increasingly frame the outlook through a scenario lens. Each pathway carries distinct implications for pricing, volatility, and the sustainability of the current risk premium.
| Scenario | Primary Trigger | Oil Price Direction | Shipping Impact | Key Indicator |
|---|---|---|---|---|
| Rapid diplomatic thaw | Successful talks, naval withdrawal | Brent retreats below $100 | Transit resumes gradually | Daily vessel count rises toward 125+ |
| Prolonged ceasefire limbo | Stalled talks, partial access | $100 to $125 per barrel range | Uneven, risk-impaired passage | Tanker turnbacks persist |
| Full escalation | Broadened interdiction, insurance collapse | Potential sharp spike above $125 | Near-complete shutdown | War-risk premiums surge |
Scenario One: Diplomatic Thaw and Phased Reopening
This pathway requires more than rhetoric. It demands observable changes in vessel behaviour, a reduction in naval enforcement activity, and confirmed improvements in tanker transits relative to the pre-disruption norm of 125 to 140 daily crossings. If these signals materialise, the geopolitical risk premium embedded in Brent crude would compress relatively quickly, potentially pulling the benchmark back below triple digits. However, given that negotiations collapsed as recently as last week following failed face-to-face discussions, this scenario currently carries the lowest near-term probability.
Scenario Two: Prolonged Ceasefire Limbo
This is the base case framing now gaining traction among energy sector analysts. Suvro Sarkar, energy sector team leader at DBS Bank, has described a shift in the base case away from hopes of de-escalation toward a prolonged ceasefire limbo, where the strait's status remains ambiguous rather than clearly open or clearly closed. Within this scenario, Sarkar has outlined a trading range of $100 to $125 per barrel for crude. Critically, this scenario also predicts that day-to-day volatility may eventually diminish as the conflict becomes absorbed into market expectations, even as the average price floor remains structurally higher than pre-conflict levels.
"When physical markets catch up with the expectations already priced into futures, the volatility spike fades, but the elevated baseline tends to persist until actual shipping capacity is demonstrably restored."
Scenario Three: Escalation and Deeper Dislocation
If interdiction broadens beyond current tanker disruptions, incorporating intensified naval confrontations, a systemic collapse in war-risk insurance for Hormuz passages, or broader port access restrictions, the upside price risk becomes considerably more severe. According to Al Jazeera's reporting on the crisis, violence flaring in the strait has already meaningfully altered trader sentiment. In this scenario, the modest crossings currently observed would cease entirely, and the price ceiling becomes largely a function of demand destruction rather than supply restoration.
Vessel Movement as the True Signal: Why Logistics Data Outweighs Diplomacy
One of the most important analytical lessons from previous energy disruptions is that what leaders say matters far less than what ships do. Priyanka Sachdeva, senior market analyst at Phillip Nova, has observed that diplomatic language around peace currently lacks concrete evidence of de-escalation, and that the real pricing driver is the ongoing curtailment of vessel movement through the strait, which is what keeps the oil risk premium elevated regardless of the surrounding rhetoric.
This operational framing provides a more reliable toolkit for tracking where prices are headed. The following indicators carry the highest signal value:
- Daily vessel transit counts relative to the pre-conflict norm of 125 to 140
- The number of tankers forced to turn back beyond the six already confirmed
- Frequency of successful crossings like the observed UAE-linked LNG tanker
- Changes in freight rates and war-risk insurance premiums for Hormuz passages
- AIS and satellite ship-tracking patterns showing loading, transit, and arrival behaviour
- Inventory build-up in tanker holding areas near the Persian Gulf
- Refinery run-rate adjustments in Asia, the region most exposed to Hormuz supply
"In energy markets, price spikes often last longer when physical shipping remains impaired, even if political leaders signal that they want de-escalation. Watching tanker behaviour provides a more reliable forward indicator than monitoring negotiating tables."
Paper Markets vs. Physical Markets: The Pricing Lag Explained
A concept that often confuses market observers is why crude prices can keep moving higher even after a major shock headline has already been absorbed. The answer lies in the structural difference between paper markets and physical markets.
- Paper market reaction: Futures contracts reprice geopolitical risk almost immediately when disruption signals emerge. This is the fast-moving, sentiment-driven component of oil pricing.
- Physical market reaction: Actual crude availability, loading schedules, tanker routing, and refinery intake adjust far more slowly. Inventories absorb initial shocks, but as stockpiles draw down and procurement windows tighten, physical market prices begin catching up with the elevated futures curve.
- Longer-term equilibrium: As Suvro Sarkar at DBS Bank has noted, financial markets eventually normalise a persistent conflict, leading to reduced daily volatility. The new equilibrium, however, tends to carry a higher average price baseline than existed before the disruption began.
This lag dynamic explains why traders who expected prices to peak on the initial shock and then retreat have repeatedly found themselves wrong during prolonged chokepoint crises. Furthermore, the oil market impacts observed during previous geopolitical episodes reinforce this pattern of sustained price elevation.
The next major ASX story will hit our subscribers first
Macro Ripple Effects: From Crude to Consumers
The consequences of sustained elevated crude pricing do not stop at the futures desk. The transmission mechanism from Hormuz disruption to end-user costs follows a recognisable sequence, though with varying lags depending on the economy involved.
| Stakeholder | Primary Risk | Potential Offset | Leading Indicator to Watch |
|---|---|---|---|
| Oil-importing nations | Current account pressure, inflation | Subsidy deployment, demand reduction | CPI energy component, import bill data |
| Gulf producers outside corridor | Revenue uncertainty, security cost | Pricing power on accessible volumes | Export terminal capacity utilisation |
| Asian refiners | Feedstock availability, margin compression | Alternative crude sourcing at premium | Refinery run rates, spot crude differentials |
| LNG buyers | Supply scheduling disruption | Spot LNG market sourcing | LNG spot prices, tanker diversion data |
| Shipping firms | War-risk cost surge, rerouting costs | Premium rate environment | Baltic exchange rates, insurance premiums |
| Consumers | Retail fuel price increases, inflation | Government intervention, demand elasticity | Pump price indices, headline CPI |
Higher crude costs feed into retail fuel prices through a refining and distribution lag that typically spans two to six weeks depending on regional market structures. Airlines, freight carriers, and petrochemical producers face more immediate input cost pressures, which in turn compress margins and may eventually pass through to consumer prices across a broad range of goods. In addition, the Asian LNG market pressures already building in the region are being significantly compounded by the strait's current impairment.
Can Alternative Routes or Workarounds Absorb the Shock?
A question frequently raised during Hormuz disruption episodes is whether rerouting, strategic reserve releases, or supply substitution can meaningfully offset the impact. The honest answer is: partially, but never fully, and certainly not at the volumes required.
What can be partially replaced:
- Shipment timing through delayed but eventual alternative routing
- Near-term demand from strategic petroleum reserve drawdowns
- Some regional sourcing from Atlantic Basin producers at a price premium
What cannot be quickly replaced:
- The raw transit capacity of a corridor handling 20 percent of global oil and gas consumption
- The economics of established, low-cost Persian Gulf export flows
- Confidence in delivery schedule reliability, which underpins long-term supply contracts
- LNG logistics, which are particularly sensitive to route integrity and vessel scheduling
The Syria-as-bypass-route concept that has received some attention is logistically constrained and nowhere near capable of substituting for Hormuz-scale volumes. These bypass discussions reflect the desperation of market participants seeking alternatives rather than a credible near-term solution. Moreover, OPEC's market influence over production decisions adds another layer of complexity to any assumptions about supply substitution from non-Gulf producers.
What Price Levels Are Analysts Monitoring?
Based on available analyst framing, the following benchmarks serve as useful reference points for assessing how the market is evolving:
- Brent above $110.55: confirms the risk premium remains fully embedded in the futures curve
- WTI near $98.17: serves as a benchmark for assessing spillover into US domestic pricing and downstream fuel markets
- DBS Bank scenario band of $100 to $125: represents the most clearly articulated analyst range for the prolonged limbo scenario, based on commentary from Suvro Sarkar
Reuters reporting from early May 2026 has further highlighted how traders continue to weigh supply risks carefully, with oil prices up as Strait of Hormuz remains shut serving as the dominant narrative shaping near-term positioning decisions.
Disclaimer: All price references and analyst forecasts cited in this article reflect information available as of April 28, 2026. Oil market conditions are highly dynamic, and actual price outcomes may differ materially from any scenario range discussed. This article is for informational purposes only and does not constitute financial or investment advice.
FAQ: Oil Prices Up as Strait of Hormuz Remains Shut
Why do oil prices rise when the Strait of Hormuz is disrupted?
The strait handles roughly 20 percent of global oil and gas consumption. When vessel transit is curtailed, the crude oil that major exporters produce cannot reach global buyers on schedule. Traders immediately reprice this supply-access risk into futures markets, pushing crude prices higher until physical delivery confidence is restored.
Is the Strait of Hormuz fully closed or partially operating?
The current situation reflects risk-impaired passage rather than complete formal closure. Six Iranian oil tankers have been confirmed as turned back, while at least one LNG tanker managed by Abu Dhabi National Oil Co. was tracked completing a crossing. This mixed picture characterises what analysts are calling a restriction scenario rather than an absolute blockade, though the practical effect on deliverable supply remains severe.
What oil price range are analysts watching?
The most clearly articulated near-term range, based on the prolonged ceasefire limbo scenario, is $100 to $125 per barrel. This range assumes continued shipping impairment without a decisive escalation or resolution. Any credible signs of transit normalisation would likely compress the upper end of this range.
How does this affect petrol and diesel prices for consumers?
The pass-through from crude to retail fuel prices typically involves a lag of two to six weeks, depending on local market structures, refinery contracts, and government pricing mechanisms. Sustained crude at current levels would be expected to feed into elevated pump prices across major importing economies, contributing to broader inflation pressures in the weeks ahead.
Want To Know Which ASX Discoveries Could Benefit From Surging Energy Prices?
When commodity markets reprice as dramatically as crude oil has during the Strait of Hormuz crisis, the ripple effects extend well beyond oil futures — and Discovery Alert's proprietary Discovery IQ model delivers real-time alerts on significant ASX mineral discoveries, ensuring subscribers can identify actionable opportunities the moment they emerge. Explore how historic major discoveries have generated substantial returns and begin a 14-day free trial today to position yourself ahead of the broader market.