June 27, 2026
The Architecture of Vulnerability: How a 33-Kilometre Waterway Determines Global Energy Prices
Every decade or so, global energy markets are forced to confront an uncomfortable structural truth: the modern petroleum supply chain was never designed with redundancy in mind. The Strait of Hormuz sits at the centre of this fragility. Not as a theoretical risk, not as a scenario in a stress-test model, but as a daily operational reality upon which roughly one-quarter of all seaborne oil trade depends. When that corridor faces disruption, the ripple effects reach fuel pumps, manufacturing costs, and monetary policy decisions across six continents.
The events of 2026 brought this architecture of vulnerability into sharp relief. What began as an escalating Iran conflict evolved into what analysts have characterised as the most severe supply disruption in the recorded history of global oil markets. The partial reopening now underway is generating significant optimism, however the mechanics of recovery are far more complex than a single diplomatic handshake.
Understanding why oil prices and Strait of Hormuz crude flows are moving in tandem requires a deeper look at the physical, diplomatic, and financial forces simultaneously reshaping the market. Furthermore, the crude oil market dynamics at play extend well beyond the strait itself, touching every major importing nation on earth.
When big ASX news breaks, our subscribers know first
Just How Critical Is the Strait of Hormuz to Global Petroleum Supply?
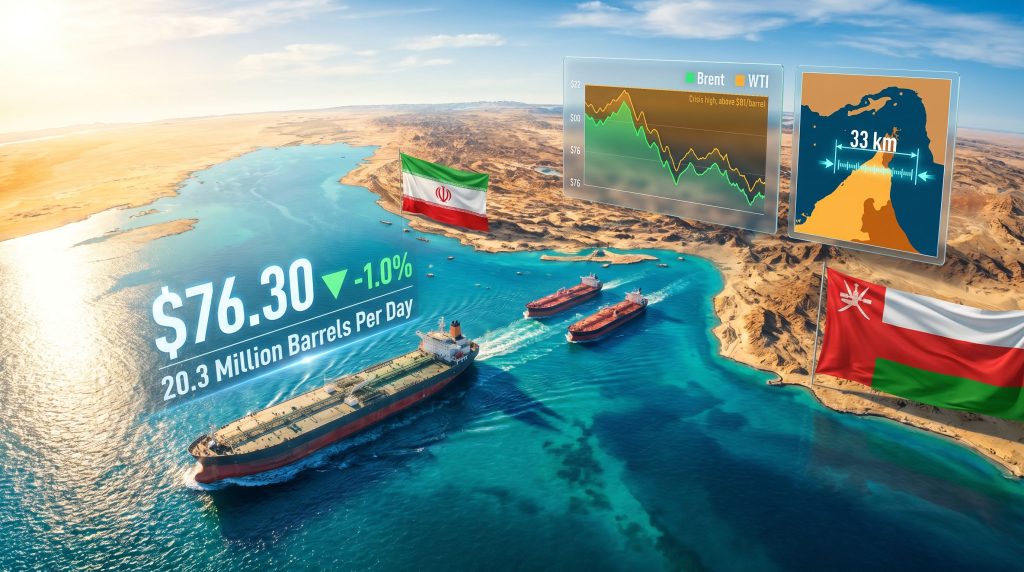
The strait itself is deceptively modest in geographic terms, a navigable channel of approximately 33 kilometres at its narrowest point, wedged between the southern coast of Iran and the northern tip of Oman. Its physical dimensions bear no relationship to its economic significance.
Under normal operating conditions, the waterway facilitates the transit of approximately 20 million to 20.3 million barrels of crude oil and petroleum products every single day. That figure represents close to 25-27% of all seaborne petroleum trade worldwide and roughly 20% of total global oil consumption passing through a single geographic pinch point with no fully equivalent substitute. According to the EIA's world oil transit chokepoints analysis, no other maritime passage carries comparable strategic weight for global energy security.
| Metric | Value |
|---|---|
| Daily throughput (2024 baseline) | ~20 million barrels per day |
| Daily throughput (Q1 2025 estimate) | ~20.1 million b/d |
| Share of global maritime oil trade | ~25-27% |
| Primary destination markets | Asia-Pacific (~84-89%) |
| Asian importers most exposed | China, India, Japan, South Korea |
| US crude import exposure |
Why Alternative Routes Cannot Bridge the Gap
A persistent misconception in mainstream market commentary is that overland pipeline bypasses can meaningfully substitute for open strait transit. The numbers, however, tell a different story:
- Saudi Arabia's Petroline (East-West Pipeline) carries approximately 7 million barrels per day of bypass capacity
- The UAE's Habshan-Fujairah pipeline adds roughly 1.8 million barrels per day of additional routing
- Combined, these two routes provide approximately 8.8 million b/d of alternatives
- Against normal strait throughput of 20+ million b/d, this covers less than 44% of normal volumes
- Critically, neither pipeline system can be rapidly scaled; their capacities reflect years of infrastructure investment, not flexible logistics
The implication is structural: no combination of currently existing bypass infrastructure can prevent a Hormuz closure from generating a genuine global supply shock. This is not a temporary vulnerability — it is an engineered constraint that will persist for the foreseeable future regardless of diplomatic outcomes.
The 2026 Disruption: Scale, Mechanics, and Market Impact
The conflict escalation of 2026 produced conditions that exceeded previous stress scenarios modelled by energy analysts. At peak disruption, an estimated 14 million or more barrels per day were effectively removed from accessible supply, as Iranian threats and reported mine deployments caused vessel operators to halt or divert transit.
The scale of the paralysis was not merely statistical. Ship-tracking data revealed that hundreds of vessels, including very large crude carriers (VLCCs), became stranded within the Persian Gulf unable to proceed. An estimated 11,000 seafarers found themselves aboard stationary ships in a contested maritime zone, prompting the UN's International Maritime Organization to begin developing an organised evacuation framework.
At the height of the crisis, Brent crude prices surged by approximately 10%, breaching $82 per barrel, a level that reflected not just physical supply disruption but the elevated insurance risk premium and the psychological weight of market uncertainty. Indeed, the geopolitical oil price pressures stemming from this conflict reached a severity not seen in decades.
ING commodity strategists noted in a research note published on 24 June 2026 that vessel crossings had increased in recent days but remained well below pre-war levels, characterising the situation as a market in transition rather than one approaching normalisation.
What Made This Disruption Historically Unprecedented
Several factors combined to push this event beyond prior crisis benchmarks:
- The simultaneous involvement of mine warfare, diplomatic standoff, and active military posturing created compounding logistics barriers that individual prior crises had not combined
- The duration of peak disruption was sufficient to strand vessels and disrupt Asian refinery scheduling, unlike shorter flare-ups that markets could absorb through inventory drawdowns
- Marine insurance markets effectively shut down for Persian Gulf transit, creating a financial barrier to resumption even as physical conditions partially improved
- The breadth of Asian exposure meant that the world's fastest-growing energy demand centres were simultaneously impacted, amplifying the global pricing response
Benchmark Prices as of Late June 2026: The Anatomy of a Decline
As of 24 June 2026, crude benchmarks extended losses that began earlier in the week, with both primary indices trading near four-month lows:
| Benchmark | Price | Change |
|---|---|---|
| Brent Crude Futures | $76.30/barrel | -$0.78 (-1.0%) |
| US West Texas Intermediate (WTI) | $72.43/barrel | -$0.78 (-1.1%) |
| Recent session low (both benchmarks) | ~$73.98/barrel | Lowest since early March 2026 |
| Peak crisis price (Brent) | >$82/barrel | +~10% above pre-crisis |
Three distinct forces are simultaneously pressing prices downward, and understanding their interaction is essential for assessing whether the current decline is durable or fragile.
Force 1: Physical transit signals improving. Ship-tracking data confirmed that three stranded supertankers successfully passed through the strait on 24 June, operating under coordination protocols managed by Iran's Revolutionary Guards Navy. This was the first meaningful evidence of organised tanker movement since the height of the crisis.
Force 2: US sanctions relief reducing Iranian supply constraints. Washington extended a 60-day sanctions waiver to Tehran following initial peace negotiations, enabling Iranian crude exports to legally re-enter global trade flows. This adds incremental supply at precisely the moment when market psychology is shifting toward optimism.
Force 3: Regional de-escalation reducing the geopolitical risk premium. Reduced hostilities across the broader Levant, including easing tensions in Lebanon, stripped away a layer of the geopolitical risk premium that had been embedded in crude pricing since the early stages of the conflict.
The Diplomatic Framework: Durable Progress or Fragile Optimism?
The market's willingness to price in further normalisation rests on a diplomatic foundation that carries meaningful uncertainty. Several key developments are shaping the trajectory:
- Oman-Iran bilateral discussions are ongoing regarding the future governance of strait navigation rights, adding a regional diplomatic layer to the US-Iran framework
- US Secretary of State Marco Rubio publicly stated that any Iranian attempt to impose transit fees on vessels would constitute a violation of international maritime law, drawing a clear US red line
- A significant factual dispute has emerged between Washington and Tehran: US President Trump stated that Iran had agreed to nuclear inspections in perpetuity, while Iranian officials explicitly denied making any such concession during negotiations
This last point is not a minor diplomatic detail. Markets that are pricing in a durable ceasefire framework face the risk that the underlying agreement is less settled than headline reporting suggests. The gap between the American and Iranian characterisations of the nuclear inspection commitment represents a genuine source of fragility embedded in current crude pricing. In addition, the oil market trade risks introduced by wider geopolitical tensions continue to complicate any straightforward path to normalisation.
Senior economists at Mitsubishi UFJ Research and Consulting have stated that meaningful further progress in nuclear negotiations holds the potential to return crude prices toward their pre-conflict baseline, though the timeline remains contingent on the durability of any diplomatic agreements reached.
Three Diplomatic Scenarios and Their Price Implications
| Scenario | Diplomatic Outcome | Brent Price Implication |
|---|---|---|
| Full Deal | Comprehensive nuclear agreement reached | Prices return toward $70-74/barrel range |
| Extended Talks | Negotiations continue without resolution | Prices stabilise in $74-80/barrel range with elevated volatility |
| Breakdown | Ceasefire collapses; strait re-closes | Prices spike toward $85-95/barrel range |
The Physical Barriers That Diplomacy Cannot Instantly Remove
One of the most underappreciated dimensions of the current situation is the distinction between diplomatic progress and physical supply restoration. Even under a stable ceasefire, several material barriers constrain the pace of normalisation.
Unexploded mines remain the single most consequential physical barrier. Iranian mine deployments during the conflict created navigational hazards that persist regardless of the political situation. Mine clearance operations in active or recently active conflict zones are methodical, time-intensive processes requiring naval cooperation and specialised technical access. Even optimistic estimates place full clearance at one to three months under cooperative conditions.
Marine insurance markets have not recovered. Lloyd's of London syndicates and Protection and Indemnity clubs effectively suspended standard coverage for Persian Gulf transit at the height of the crisis. The return to normal insurance availability requires a period of demonstrated operational stability that is measured in months, not days. Without affordable insurance, commercially rational ship operators will continue to avoid or limit transit regardless of physical conditions.
Vessel repositioning creates its own timeline. The hundreds of VLCCs and product tankers that diverted away from the Gulf during the crisis are not instantly available to resume normal operations. Repositioning a global tanker fleet to serve Middle Eastern export terminals requires weeks of scheduling, logistical coordination, and cargo planning.
| Recovery Phase | Estimated Duration | Key Dependency |
|---|---|---|
| Initial vessel evacuation | Weeks | UN/IMO coordination and ceasefire stability |
| Mine clearance operations | 1-3 months | Naval cooperation and technical access |
| Insurance market normalisation | 2-4 months | Risk reassessment by Lloyd's and P&I clubs |
| Full tanker traffic restoration | 3-6+ months | Geopolitical confidence and operational capacity |
| Crude price return to pre-war levels | Uncertain | Nuclear deal progress and OPEC+ response |
The next major ASX story will hit our subscribers first
Inventory Data: A Counterintuitive Signal from US Storage
Against the backdrop of improving diplomatic signals, US crude inventory data released by the American Petroleum Institute for the week ending 19 June 2026 delivered a reading that challenges the prevailing optimism:
- Actual crude stock draw: -765,000 barrels
- Reuters analyst consensus estimate: -4.5 million barrels
- Variance from consensus: the actual draw was approximately 83% smaller than expected
A smaller-than-expected inventory draw in a disrupted supply environment is a double-edged signal. On one interpretation, it suggests that supply is reaching US storage facilities more effectively than anticipated, consistent with improving logistics. On another reading, it could reflect softer-than-expected refinery demand, a metric that warrants monitoring as a leading indicator of broader economic conditions.
The divergence between the API draw of -765,000 barrels and the consensus forecast of -4.5 million barrels illustrates the complexity of a market in transition, where diplomatic signals and physical supply flows are moving at materially different speeds.
Asian Energy Security: The Asymmetric Stakes of Hormuz Disruption
The geographic distribution of Hormuz crude flows reveals a profound asymmetry in geopolitical risk exposure. With 84-89% of normal strait throughput destined for Asian markets, the Indo-Pacific region bears the overwhelming majority of disruption risk from any future closure. Furthermore, OPEC's market influence over production decisions continues to shape how quickly supply gaps can be addressed during periods of elevated regional tension.
| Country | Hormuz Dependency | Key Vulnerability |
|---|---|---|
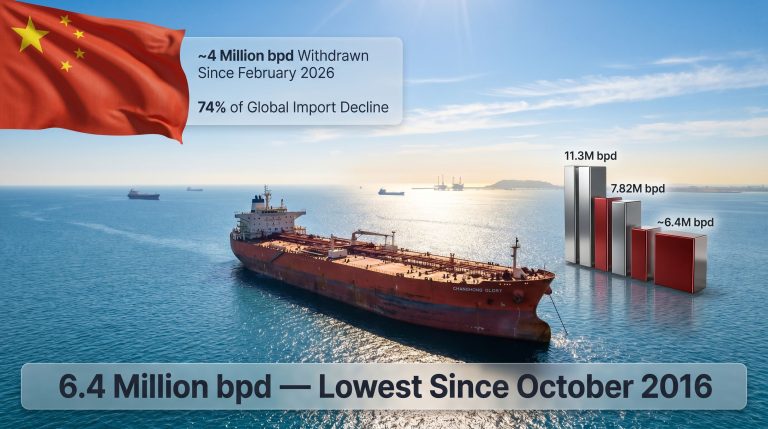
| China | High | World's largest crude importer; strategic reserve buffer |
| India | High | Limited domestic production; growing refinery capacity |
| Japan | Very High | Near-total import dependency; minimal domestic reserves |
| South Korea | Very High | Refining hub with minimal domestic crude production |
The Strategic Reserve Reality
A less-discussed dimension of Asian energy security is the meaningful variation in strategic petroleum reserve (SPR) coverage across the region's major importers:
- Japan and South Korea maintain IEA-mandated SPR volumes covering approximately 90 days of net import requirements
- China's estimated SPR capacity provides roughly 80-90 days of import cover
- India's strategic reserves, by contrast, cover only approximately 9-10 days of full utilisation, representing the most acute vulnerability in the region
This disparity matters because SPR capacity determines how long each economy can absorb supply disruption before domestic energy constraints begin affecting industrial output, transportation systems, and inflation dynamics. India's limited buffer creates a scenario in which a prolonged strait closure would generate macroeconomic pressure in South Asia on a compressed timeline compared to its regional peers.
What the Current Price Level Tells Experienced Energy Investors
With Brent trading near $76 per barrel as of late June 2026, markets are pricing a scenario somewhere between full normalisation and a renewed breakdown. This mid-range pricing reflects genuine uncertainty rather than conviction in either direction.
Experienced energy market participants have learned from prior geopolitical disruptions — including the 1973 oil embargo, the 1990 Gulf War, and the 2019 Abqaiq attacks — that the market's initial pricing of risk frequently undershoots or overshoots the eventual outcome. The current situation introduces an additional complexity: the risk is simultaneously a supply story, a diplomacy story, and an insurance and logistics story, each operating on different timescales.
The dominant pricing variable for the remainder of 2026 is the trajectory of US-Iran nuclear negotiations. Consequently, the US-China oil price impact also warrants close attention, given that China's import volumes represent the single largest slice of normal oil prices and Strait of Hormuz crude flows. A comprehensive agreement would likely push Brent toward the $70-74 range. Extended talks without resolution would maintain elevated volatility in the $74-80 corridor. A ceasefire breakdown, particularly one involving renewed Iranian mine activity or military posturing in the strait, carries price spike potential toward the $85-95 range based on current analyst scenario modelling. The Brookings Institution's detailed analysis of the strait as a geopolitical chokepoint reinforces why these scenarios carry such asymmetric consequences for the global economy.
Disclaimer: This article contains forward-looking scenario analysis and price projections derived from analyst commentary and market data available as of 24 June 2026. These projections involve significant uncertainty and should not be interpreted as investment advice. Readers should conduct independent due diligence before making any financial decisions related to energy markets or commodity exposure.
Want to Stay Ahead of the Next Major Resource Discovery Driving Global Commodity Markets?
When geopolitical shocks reshape energy and commodity prices, the investors best positioned are those with real-time intelligence on significant ASX mineral discoveries — Discovery Alert's proprietary Discovery IQ model delivers exactly that, instantly converting complex discovery data into actionable opportunities across 30+ commodities. Explore how historic discoveries have generated substantial returns by visiting Discovery Alert's dedicated discoveries page, and begin your 14-day free trial today to secure a market-leading edge before the next major announcement hits the ASX.