July 31, 2026
When Geography Becomes Destiny: Understanding the Oil Price Crisis at the World's Most Critical Waterway
Few geographic features on Earth carry the economic weight of a 54-kilometre-wide stretch of water separating the Persian Gulf from the Gulf of Oman. The Strait of Hormuz has long sat at the intersection of global energy logistics and geopolitical risk, but the current conflict environment has elevated its strategic significance to a level not seen in decades. For energy traders, policymakers, and import-dependent economies alike, understanding oil prices amid Strait of Hormuz disruption has become essential, not just academically interesting.
When big ASX news breaks, our subscribers know first
The Strait of Hormuz as a Global Energy Chokepoint: Why It Matters More Than Ever
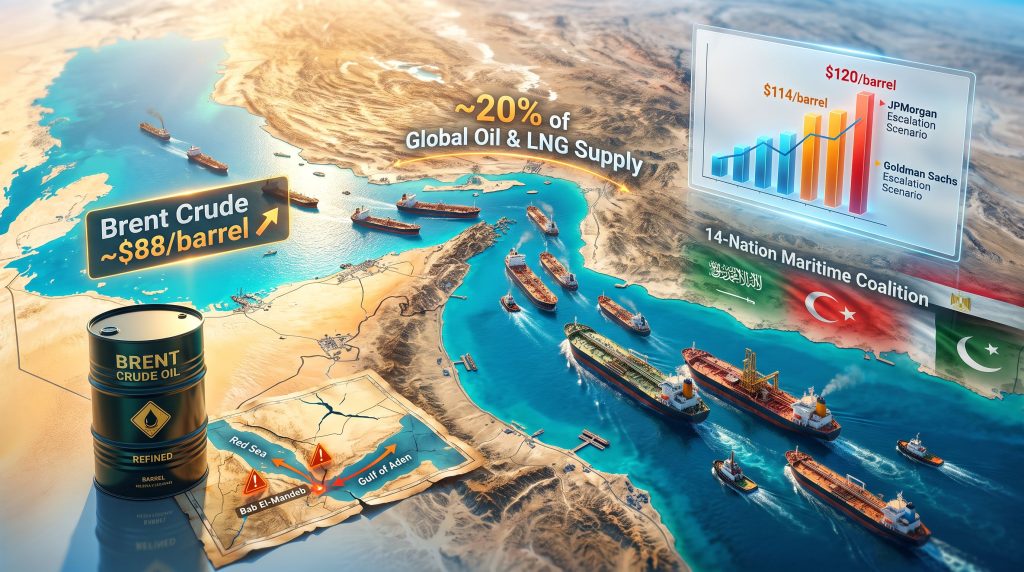
The numbers alone tell a compelling story. Under normal operating conditions, approximately one-fifth of the world's combined oil and liquefied natural gas supply moves through this single maritime passage every day. No other waterway comes close to replicating this function in the global energy supply chain.
What makes the strait particularly consequential from a market pricing perspective is the scale of supply that becomes inaccessible when transit is restricted. Analysts estimate that a sustained closure or severe disruption could remove somewhere between 10.1 million and 14 million barrels per day from accessible global supply. The breadth of that range itself reflects the deep uncertainty around disruption severity and duration that markets are currently pricing.
Why Energy Markets React So Violently to Hormuz Threat Signals
A critical dynamic that distinguishes Hormuz risk from most other commodity supply disruptions is the asymmetric market response: the credible threat of closure, even without physical blockade, is sufficient to inject a substantial risk premium into Brent crude futures. This occurs for several interconnected reasons:
- No scalable short-term bypass exists. Rerouting tankers around the Cape of Good Hope adds between 10 and 15 days of transit time per voyage and substantially increases freight and insurance costs.
- Strategic petroleum reserve releases are structurally limited. Coordinated IEA drawdowns can buffer short-term demand shocks but cannot replace sustained daily throughput over months.
- Futures markets price forward probability, not just current supply. When Hormuz security deteriorates, the forward curve steepens rapidly as traders price in compounding disruption risk across multiple delivery periods.
- Tanker insurance markets amplify the signal. War risk premiums on Gulf tanker insurance have surged, adding a secondary cost layer that tightens effective supply even before any physical restriction occurs.
Furthermore, a subtler dynamic worth understanding: oil markets operate on expectations of expectations. When major banks publish disruption scenarios, their models themselves become inputs into trader positioning, creating a reflexive feedback loop between analyst forecasts and actual price formation. Monitoring crude oil price trends helps market participants identify these feedback loops before they fully materialise.
What Is Happening to Oil Prices Right Now? Brent and WTI Snapshot
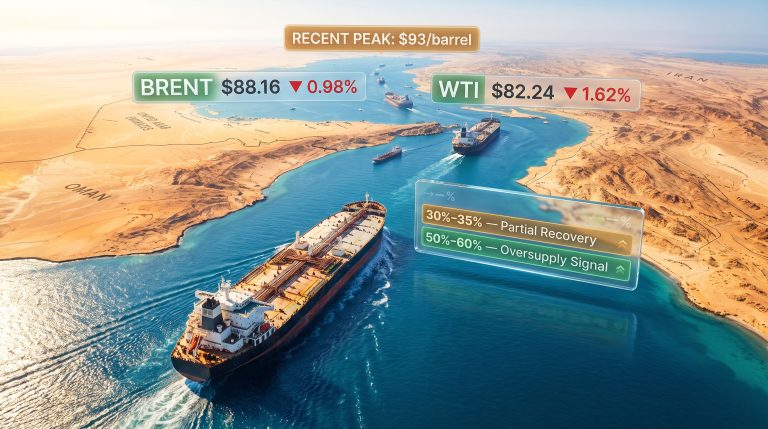
The current crude pricing environment reflects a market simultaneously pulled in two directions, with geopolitical risk premium competing against short-term diplomatic signals. Brent and WTI futures have both exhibited considerable intraday volatility as a direct consequence of this tension.
| Benchmark | Recent Level | Session Change | Notable Intraday High |
|---|---|---|---|
| Brent Crude | ~$88/barrel | -1.16% (-$1.03) | $93.31/barrel |
| WTI Crude | ~$81.70/barrel | -2%+ | $85.94/barrel |
| Prior Brent Session Close | $89.03/barrel | -1.88% | N/A |
The intraday swing captured in this data is particularly instructive. Brent touching $93.31 before retreating to $88 within a single session illustrates just how sensitively crude markets are responding to real-time geopolitical signals. The prior session saw Brent briefly recover before settling lower, reflecting the whiplash dynamic that characterises conflict-driven commodity markets.
Why Are Oil Prices Falling Even as Tensions Remain Elevated?
A counterintuitive price retreat has emerged: Brent has pulled back from its intraday highs despite ongoing regional conflict and unresolved disruption to Hormuz tanker traffic. The drivers behind this divergence include:
- Saudi Arabia's proposal to lead a 14-nation maritime security coalition covering the Bab El-Mandeb Strait, the Red Sea, and the Gulf of Aden, which signals coordinated effort to stabilise shipping lanes and reduces perceived probability of uncontrolled escalation.
- Ongoing Iran-Oman diplomatic engagement around Strait of Hormuz management, which markets have partially interpreted as evidence that full closure remains politically costly even for Tehran.
- Investor rotation away from crisis-premium positions as the conflict extends without a catastrophic strike on major export infrastructure.
It is critical not to misread this price retreat as a resolution of the underlying supply constraint. Tanker traffic through the Strait of Hormuz remains materially below pre-conflict levels, confirming that structural disruption persists even as headline prices temporarily ease.
The Geopolitical Architecture Driving the Oil Price Risk Premium
Saudi Arabia's 14-Nation Maritime Security Coalition
Saudi Arabia has moved to formalise a regional maritime defence framework targeting three critical shipping corridors. The Saudi defence ministry confirmed that 14 nations, including Turkey, Pakistan, Egypt, Sudan, and Djibouti, issued a joint statement backing the proposed alliance. The significance of this development for energy markets extends beyond the military dimension.
A functioning multilateral maritime security coalition would, if effective, reduce the war risk insurance premium currently embedded in tanker freight rates. This premium has acted as a secondary mechanism keeping effective oil supply costs elevated beyond what pure supply-and-demand fundamentals would suggest. Reduced insurance costs would partially unwind this layer of the price premium, independent of any change in physical supply volumes.
The Houthi Naval Blockade: Compounding the Chokepoint Problem
Iran-backed Houthi forces in Yemen declared a naval blockade targeting Saudi Arabian shipping through the Red Sea. The strategic implication of this development is often underappreciated in mainstream coverage: it simultaneously threatens two separate bypass options, not just the primary Hormuz route.
The Red Sea corridor functions as the principal alternative for Saudi crude exports when Hormuz conditions are constrained. By targeting this route simultaneously, the Houthi blockade declaration reduces the market's confidence that available bypass infrastructure can absorb displaced Hormuz traffic. This compounds the supply risk calculus in a non-linear way: the loss of both primary and alternative routes creates a multiplier effect on supply vulnerability that no single-route disruption model fully captures. The geopolitical oil risks associated with this dual-route threat have consequently attracted significant analytical attention from leading energy research houses.
Tehran's Rejection of Joint Hormuz Management: A Durable Price Floor
While Iran-Oman diplomatic engagement around Strait of Hormuz governance has continued, Tehran's formal rejection of Oman's joint management proposal carries significant forward pricing implications. According to Anindya Banerjee, Head of Commodity Research at Kotak Securities, the market has progressively shifted its analytical focus away from active military exchanges toward the declining probability of a diplomatic breakthrough.
Tehran's imposition of new preconditions for restarting negotiations has materially reduced near-term prospects for normalised tanker traffic, Banerjee noted, while successive disruption events have pushed any timeline for traffic recovery further out. Banerjee further assessed that any confirmed strike on major Gulf export infrastructure could force Brent to retest the $95–100 range and potentially beyond — a threshold that would represent a meaningful escalation from current levels.
Mediterranean Spillover: The Damietta Port Drone Strike
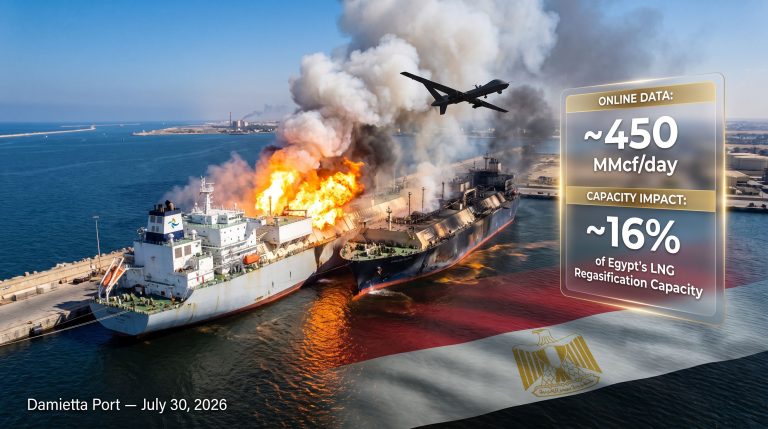
Egypt's confirmation that a drone strike caused fires aboard two gas vessels at the Mediterranean port of Damietta introduced a new geographic dimension to the conflict's footprint. British maritime security firm Ambrey assessed that a U.S.-owned gas storage tanker docked at the port was struck, raising the prospect of energy infrastructure attacks extending beyond the Persian Gulf corridor.
This geographic expansion of targeting, if it continues, would dramatically widen the supply risk premium embedded in global crude pricing and challenge the assumption that the conflict's energy market impact is confined to the Gulf region. In addition, OPEC's market influence in managing production responses to these evolving supply threats remains a key variable that traders are monitoring closely.
Where Are Oil Prices Headed? Scenario Modelling and Analyst Price Targets
JPMorgan's Duration-Sensitive Disruption Model
JPMorgan has constructed a pricing framework that quantifies the compounding cost of prolonged disruption:
- Each additional month of sustained supply disruption is estimated to add approximately $7 to $8 per barrel to Brent crude pricing.
- A three-month sustained disruption, under this model, could push average monthly Brent prices to approximately $114 per barrel.
This framework explains a dynamic that standard supply-and-demand analysis can miss: even if near-term prices ease, the cumulative cost of disruption compounds rapidly. A market that appears to be stabilising at $88 today faces dramatically different arithmetic if disruption persists for another two to three months.
Goldman Sachs Scenario Framework
| Scenario | Brent Price Projection | Key Assumption |
|---|---|---|
| Escalation / Sustained Disruption | Up to $120/barrel | Hormuz and Red Sea disruptions persist |
| Base Case (Gradual De-escalation) | ~$80/barrel (Q4 average) | Tensions ease, shipping normalises |
| Extended Base Case | ~$75/barrel (following year) | Diplomatic resolution, supply recovery |
Goldman Sachs has explicitly flagged that risks to its base case projections remain tilted to the upside, citing the simultaneous threat to both the Strait of Hormuz and Red Sea shipping corridors. The bank's $120/barrel escalation scenario is contingent on disruptions persisting across both waterways, which is precisely the configuration the Houthi blockade declaration and Tehran's rejection of joint Hormuz management have made more plausible.
What Would Push Brent Above $100? Key Trigger Events
The pathway to triple-digit Brent pricing runs through a specific escalation sequence. Consequently, monitoring these triggers provides the most actionable forward signal for energy market participants:
- A confirmed strike on major Gulf oil export infrastructure, including terminals, loading facilities, or pipeline hubs.
- A formal, enforced closure of the Strait of Hormuz by Iranian naval forces.
- Failure of the Saudi-led maritime coalition to deter Houthi interdiction of Red Sea shipping lanes.
- Collapse of Iran-Oman diplomatic channels, removing the last active de-escalation mechanism.
- Geographic expansion of drone strike activity to additional Mediterranean or Indian Ocean energy infrastructure nodes.
The trade war oil impact on global demand adds a further layer of complexity, as softening economic conditions in key import nations could partially offset upward price pressure even in a disruption scenario.
How Tanker Traffic Data Reveals the True State of Disruption
One of the most reliable and least-discussed leading indicators for oil prices amid Strait of Hormuz disruption is real-time tanker transit data through the waterway. Current shipping activity through the Strait of Hormuz remains materially below pre-conflict levels — a persistent signal that the underlying disruption has not been resolved even during periods when headline prices have temporarily retreated. Analysts at OilPrice.com regularly publish tanker traffic updates that provide granular insight into these shifting supply conditions.
| Market Condition | Brent Price Range | Key Driver |
|---|---|---|
| Pre-disruption baseline | High $70s/barrel | Normal supply-demand fundamentals |
| Initial disruption / threat escalation | $80–$97/barrel | Risk premium accumulation |
| Peak crisis pricing | Above $100/barrel | Confirmed infrastructure attacks |
| De-escalation / traffic resumption | Low $70s/barrel | Ceasefire signals, rerouting success |
| Current environment | ~$88/barrel | Coalition formation, diplomatic uncertainty |
The gap between current tanker throughput and pre-war levels represents a persistent structural supply constraint. This constraint is not visible in headline crude price data during periods of temporary easing, which is precisely why tanker traffic monitoring provides a more accurate reading of underlying market conditions than spot price movements alone.
The next major ASX story will hit our subscribers first
Global Energy Security: Alternative Supply Pathways and Their Limitations
What Exists Beyond the Strait of Hormuz?
When Hormuz transit is constrained, the global energy system possesses limited and imperfect structural alternatives:
- Saudi Arabia's East-West Pipeline (Petroline): Carries approximately 5 million barrels per day at capacity, significant but insufficient to replace full Hormuz throughput and unavailable to non-Saudi producers.
- Cape of Good Hope rerouting: Adds 10 to 15 days of transit time per voyage and substantially higher freight and insurance costs, reducing effective supply even without physical restriction.
- IEA Strategic Petroleum Reserve releases: Coordinated drawdowns can buffer demand for weeks but are structurally finite and cannot substitute for sustained supply across months.
- OPEC+ spare capacity deployment: Dependent on member willingness, physical infrastructure, and the critical assumption that spare capacity is not itself subject to the same geographic risk concentration.
Which Economies Face the Greatest Exposure?
Energy-import-dependent economies in Asia, particularly those with limited strategic reserve depth and high dependence on Persian Gulf crude grades, carry the greatest economic exposure to sustained Hormuz disruption. Supply tightening at this chokepoint translates directly into import cost inflation, current account deterioration, and downstream energy price pressures across industrial and consumer sectors.
India, Japan, South Korea, and China collectively account for a substantial share of Persian Gulf crude imports, making Hormuz security a systemic macroeconomic variable for the Asia-Pacific region rather than merely an oil sector concern. For broader context on how oil functions as a global commodity and its structural role in international trade, Wikipedia's overview of oil provides a useful foundational reference.
Frequently Asked Questions: Oil Prices and the Strait of Hormuz
What percentage of global oil flows through the Strait of Hormuz?
Approximately one-fifth of the world's combined oil and liquefied natural gas supply transits the Strait of Hormuz daily under normal operating conditions. This makes it the single most consequential maritime energy chokepoint on the planet.
How much could oil prices rise if the Strait of Hormuz is blocked?
JPMorgan's modelling estimates each additional month of disruption adds $7 to $8 per barrel to Brent, with a three-month scenario potentially pushing Brent to $114/barrel. Goldman Sachs has identified $120/barrel as a plausible ceiling under a sustained, multi-route disruption scenario.
Why did oil prices fall even though the strait remains disrupted?
Prices retreated from intraday highs primarily due to Saudi Arabia's 14-nation maritime coalition announcement, ongoing Iran-Oman diplomatic engagement, and investor repositioning. However, tanker traffic through the strait remains below pre-conflict levels, meaning the structural supply constraint persists beneath the surface of the temporary price easing.
What indicators should investors monitor for oil price direction?
- Real-time tanker traffic volumes through the Strait of Hormuz.
- Progress or breakdown of Iran-Oman diplomatic negotiations.
- Effectiveness of the Saudi-led maritime security coalition in deterring Houthi interdiction.
- Any confirmed strikes on Gulf oil export terminals or pipeline infrastructure.
- OPEC+ spare capacity deployment announcements.
- IEA strategic petroleum reserve release coordination signals.
Disclaimer: This article contains forward-looking analysis, scenario projections, and analyst forecasts from JPMorgan and Goldman Sachs. These represent probabilistic assessments, not guaranteed outcomes. Energy markets are subject to rapid change based on geopolitical developments. This article does not constitute financial or investment advice.
Want to Identify the Next Major Commodity Discovery Before the Market Does?
When geopolitical shocks drive commodity volatility — as the Strait of Hormuz crisis illustrates — being first to act on significant resource discoveries can be the difference between capturing exceptional returns and watching from the sidelines. Discovery Alert's proprietary Discovery IQ model delivers real-time alerts on significant ASX mineral discoveries across more than 30 commodities, instantly converting complex geological data into actionable investment insights — explore historic discovery returns to understand the scale of opportunity, then begin your 14-day free trial to position yourself ahead of the broader market.