August 5, 2026
The Paradox at the Heart of Global Oil Markets in 2026
Energy markets operate on the logic of anticipation. Prices rarely wait for physical reality to confirm what traders have already decided is coming. This forward-pricing mechanism, so elegantly functional in calm conditions, becomes profoundly disorienting during geopolitical crises when the gap between sentiment and reality widens to extremes. The events surrounding oil prices Strait of Hormuz shipping reopening in mid-2026 offer a textbook illustration of exactly this dynamic. Oil prices are falling even as the world's most critical maritime energy corridor inches toward reopening, and understanding why requires peeling back the layers of market psychology, structural supply mechanics, and geopolitical sequencing that govern how energy prices actually behave under stress.
When big ASX news breaks, our subscribers know first
How Strategically Important Is the Strait of Hormuz to Global Oil Supply?
The World's Most Critical Maritime Chokepoint
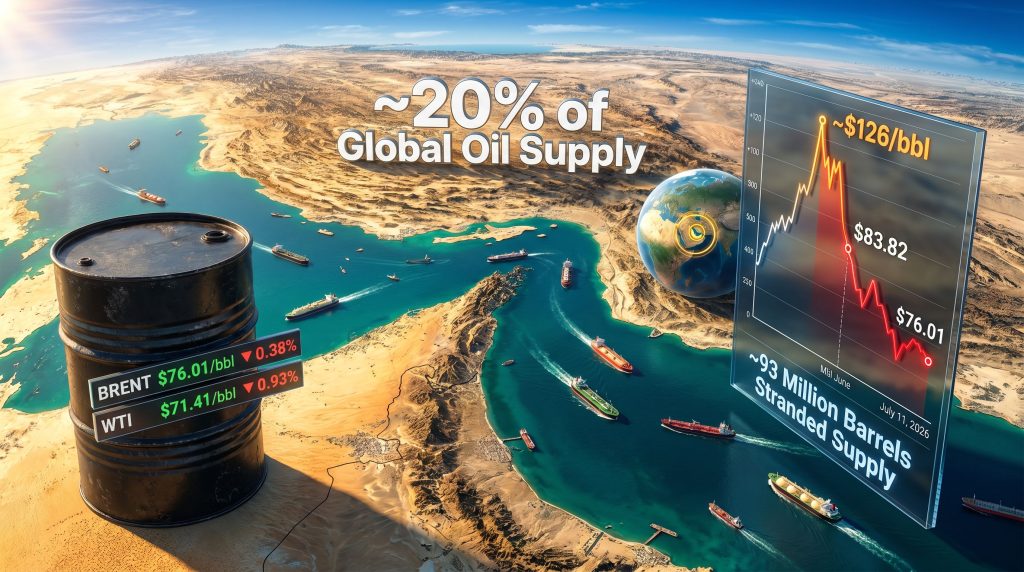
Few geographical features carry as much economic consequence as a narrow strip of water barely 33 kilometres wide at its most constricted point. The Strait of Hormuz, connecting the Persian Gulf to the Gulf of Oman and ultimately the Indian Ocean, serves as the primary transit corridor for approximately 20% of all global oil and liquefied natural gas shipments under normal operating conditions. No other maritime passage concentrates this volume of energy trade.
Before hostilities escalated on February 28, 2026, the strait facilitated the movement of an estimated 10 million barrels per day of crude oil and petroleum products from Gulf producers to markets across Asia, Europe, and beyond. The closure that followed triggered what analysts described as the largest single-month oil price surge in recorded market history, with Brent crude surging to a peak of approximately $126 per barrel at the height of the disruption.
Critically, the strait is not merely a crude oil corridor. It is also the exclusive export route for Qatari liquefied natural gas, making it simultaneously the world's most important oil chokepoint and one of its most consequential LNG passages. Furthermore, ship-tracking data confirmed that daily vessel movements through the strait fell dramatically below pre-conflict averages during the closure, affecting both crude tankers and LNG carriers.
Comparing the Hormuz Closure to Historical Supply Disruptions
To appreciate the severity of the 2026 event, it is worth measuring it against the major supply shocks of the past half-century.
| Disruption Event | Estimated Supply Impact | Peak Price Response | Duration |
|---|---|---|---|
| Strait of Hormuz Closure (2026) | ~10 million bpd removed | Brent peaked at ~$126/bbl | Ongoing normalization |
| 1973 Arab Oil Embargo | ~5 million bpd removed | ~300% price increase | ~5 months |
| Gulf War (1990-91) | ~4-5 million bpd removed | ~$40/bbl spike | ~6 months |
| Russia-Ukraine Supply Shock (2022) | ~2-3 million bpd disrupted | Brent peaked ~$139/bbl | Multi-year adjustment |
The 2026 Hormuz closure removed more barrels from daily global circulation than any previous single supply disruption in recorded history, surpassing even the 1973 Arab Oil Embargo in raw volumetric terms. The comparison underscores why initial price reactions were so extreme.
What the raw numbers alone do not capture is the psychological component. The 1973 embargo unfolded over weeks and was politically telegraphed. The 2026 strait closure was abrupt, physically enforceable, and concentrated at a single geographical point with no viable bypass alternative. These characteristics amplified trader anxiety and compressed the price response into a much shorter timeframe. For context, the broader crude oil price trends leading into 2025 had already signalled mounting vulnerability in global energy markets.
What Triggered the Strait of Hormuz Reopening and What Are the Conditions?
From Escalation to De-escalation: A Condensed Timeline
The sequence of events leading from crisis peak to the current normalisation phase unfolded across several months and involved overlapping diplomatic and military developments:
- February 28, 2026: Hostilities between the United States and Iran formally escalate, disrupting commercial shipping lanes through the Strait of Hormuz.
- Early conflict phase: Iranian armed forces launch retaliatory strikes on US military infrastructure across Gulf states following US strikes targeting Iran's southern coastal and eastern provinces.
- April 17, 2026: Following a 10-day ceasefire, Iran's Foreign Minister declares the strait completely open to commercial shipping. Brent crude sheds 11% in a single trading session on the announcement.
- Qatari mediation role: Qatari negotiators travel to Tehran to facilitate de-escalation talks, playing a pivotal intermediary role in creating conditions for broader diplomatic engagement.
- Mid-June 2026: A US-Iran framework agreement establishes a 30-day timeline for shipping normalisation. Brent settles at $83.82/bbl and WTI at $80.95/bbl following the announcement.
- July 11, 2026: Brent settles at $76.01/bbl (down 0.38%) and WTI at $71.41/bbl (down 0.93%), reflecting continued market repricing as diplomatic conditions hold.
What Does Reopening Actually Mean in Practice?
A declaration of openness and a functional resumption of shipping operations are meaningfully different things. Several friction points continue to delay full normalisation:
- Vessels that reversed course during peak hostilities remain in holding patterns as insurers and operators complete updated risk assessments before committing tonnage back to the route.
- Port infrastructure damage across southern Iran, including areas near Bushehr, where a major nuclear facility is located, has introduced logistical complexity into the resumption timeline.
- LNG tankers have partially resumed transit through the strait in recent days, according to ship-tracking data, but overall daily traffic volumes remain well below historical norms.
- Industry analysts broadly expect complete operational normalisation to require several months, not weeks, from the point of the reopening declaration.
This lag between political announcement and physical resumption is itself a significant market force, acting as a temporary buffer against the full bearish weight of the returning supply wave.
How Have Oil Prices Responded to the Strait of Hormuz Reopening?
Immediate Market Reaction: The Logic of Forward Pricing
When Iran announced the reopening of the strait on April 17, 2026, oil markets did not wait for tankers to actually transit the waterway before repricing. Brent crude fell approximately 11% in a single session, one of the most rapid single-day demand-side adjustments in recent oil market history. This response reflects a fundamental truth about commodity markets: prices discount anticipated supply changes, not confirmed ones.
By mid-June 2026, with the US-Iran framework deal confirmed, Brent had retreated further to $83.82/bbl, representing a decline of approximately $42/bbl or roughly 33% from its crisis peak of $126/bbl. The market was effectively pricing in the prospective return of supply while physical flows remained constrained. The dynamics of oil trade and geopolitics have rarely been as intertwined as they are in this extraordinary repricing cycle.
Weekly Price Performance: Gains Within a Declining Trend
The July 11 settlement data reveals a nuanced picture that underscores just how sensitive this market is to incremental news flow:
- Brent crude: Settled at $76.01/bbl, down 0.38% on the day, but up approximately 5.5% for the week.
- WTI crude: Settled at $71.41/bbl, down 0.93% on the day, but up nearly 4.0% for the week.
This apparent contradiction — where prices rise over a week while falling on the final day — reflects the push-pull dynamic between residual geopolitical anxiety and growing confidence in diplomatic progress. As Again Capital partner John Kilduff noted, the market has demonstrated a clear disposition to respond positively to any absence of deteriorating news, not merely to outright positive developments.
The 93 Million Barrel Supply Wave
Among the more technically significant dynamics in this repricing cycle is the volume of stranded supply waiting to re-enter global markets. Analysts estimate that the reopening is positioned to release approximately 93 million barrels of non-Iranian crude from Persian Gulf storage positions and in-transit holdings. This accumulated supply overhang represents the single most powerful structural force pushing prices lower as normalisation progresses.
The 93-million-barrel supply wave is not a theoretical projection. It represents physical barrels that were produced, loaded, and rendered inaccessible by the closure. As shipping resumes, these barrels will compete for the same refinery slots and storage capacity that has been operating under scarcity conditions for months.
What Are the Key Factors Still Preventing a Full Oil Price Collapse?
Structural Floors Supporting Current Price Levels
Despite the reopening narrative and the looming supply wave, several converging forces are acting as meaningful price supports:
- Physical normalisation lag: LNG tankers have resumed some transit, but overall daily vessel movements through the strait remain well below pre-conflict levels, constraining the actual pace of supply additions to the market.
- Inventory depletion: Global oil stockpiles were drawn down substantially during the closure period. The rebuilding process will absorb a significant portion of returning supply, potentially sustaining prices near the $75-90/bbl range through much of the normalisation period.
- Retained geopolitical risk premium: Markets continue to embed a residual uncertainty discount reflecting the possibility that the current ceasefire could collapse. UBS analyst Giovanni Staunovo observed that reduced flows through the strait are limiting the downside even as political conditions improve.
- Iranian infrastructure protection: The Trump administration's decision not to target Iranian energy facilities during US strikes provided significant market reassurance. ANZ commodity strategist Daniel Hynes noted that this deliberate restraint prevented a worst-case supply destruction scenario from materialising, allowing markets to retain confidence in the eventual physical return of supply.
- Russian production headwinds: Independently of the Hormuz situation, the IEA downgraded Russian oil production forecasts following Ukrainian drone strikes on major refineries. Russian gasoline output fell to approximately 65% of seasonal average consumption, removing a potential global supply buffer at a time when markets are already recalibrating.
The IEA Surplus Forecast Under Pressure
The International Energy Agency had previously projected a significant oil market surplus for the coming year based on pre-conflict production assumptions. The sustained Hormuz disruption and its slow-moving aftermath have materially complicated that baseline. Consequently, if shipping normalisation proceeds gradually and inventory rebuilding absorbs available supply faster than anticipated, the forecast surplus may prove substantially smaller than pre-conflict modelling suggested.
In addition, the role of OPEC's market influence in shaping how this surplus ultimately materialises cannot be understated. Production policy decisions from member states will significantly determine whether the returning supply wave intensifies or is partially absorbed by coordinated output adjustments.
What Scenarios Could Drive Oil Prices Higher or Lower From Here?
Three Pathways for Oil Markets Through Q4 2026
Scenario 1: Rapid Normalisation (Bearish for Prices)
Ceasefire holds, the US-Iran framework is implemented within its 30-day window, and vessel traffic through the strait returns to pre-conflict levels by September 2026. The 93-million-barrel supply wave hits markets in a compressed timeframe, surplus conditions materialise broadly in line with IEA projections, and Brent crude retreats toward the $65-70/bbl range.
Scenario 2: Gradual Normalisation (Neutral to Mildly Bearish)
Shipping resumes incrementally over three to six months due to infrastructure constraints, insurer hesitancy, and residual security concerns. Inventory replenishment absorbs much of the returning supply in a measured fashion. Brent stabilises in the $75-90/bbl range through year-end. This scenario represents the base-case consensus among most commodity analysts as of mid-July 2026.
Scenario 3: Renewed Escalation (Bullish for Prices)
Diplomatic talks collapse, the ceasefire breaks down, or a new military incident disrupts shipping lanes. The strait is effectively re-closed, stranded supply remains locked in the Gulf, and Brent re-tests the $100-120/bbl range as supply anxiety returns. While this scenario carries the lowest assigned probability among current analyst consensus views, it retains the highest potential price impact magnitude.
Price Futures Group senior analyst Phil Flynn captured the underlying psychology of the current moment well, noting that prices were declining primarily because traders had confidence that US military capability would prevent any extended strait closure. This means US deterrence capacity itself is functioning as a structural price suppressant — an unusual dynamic where geopolitical power directly influences commodity valuations. The broader potential for oil market disruption extending into 2025 and beyond remains a live concern for long-term energy planners.
The next major ASX story will hit our subscribers first
How Does the Hormuz Situation Affect Global LNG Markets and Energy Security?
Beyond Crude: The Overlooked LNG Dimension
One underappreciated aspect of the 2026 crisis is its impact on global LNG markets, which operate on entirely different contract structures and price mechanisms than crude oil. Qatar, as one of the world's largest LNG exporters, routes essentially all of its production through the Strait of Hormuz. The closure did not merely disrupt oil flows; it interrupted long-term LNG supply agreements that underpin energy security planning for major importing nations.
European and Asian LNG importers who scrambled to secure alternative supply during the closure now face a period of price normalisation and contract renegotiation as Qatari volumes gradually return to market. The disruption also accelerated policy conversations about global LNG supply diversification, with major importing nations examining strategic reserve frameworks and alternative route investments to reduce dependence on a single maritime chokepoint.
Regional Energy Security Implications
| Region | Primary Exposure | Response During Closure | Long-Term Policy Implication |
|---|---|---|---|
| Asia-Pacific (Japan, South Korea, India) | High: major Gulf crude importers | Emergency spot LNG purchases; strategic reserve drawdowns | Accelerated supply diversification |
| Europe | Moderate: LNG exposure via Qatar | Increased US LNG imports; Norwegian gas substitution | Renewed energy independence investment |
| China | High: significant Gulf crude dependency | Activated strategic petroleum reserves | Strengthened bilateral Gulf supply agreements |
| United States | Low: net energy exporter | Benefited from elevated export prices | Geopolitical leverage through energy diplomacy |
Key Market Data Summary
| Metric | Value |
|---|---|
| Brent crude settlement (July 11, 2026) | $76.01/bbl |
| WTI crude settlement (July 11, 2026) | $71.41/bbl |
| Brent weekly gain | ~5.5% |
| WTI weekly gain | ~4.0% |
| Brent peak during closure | ~$126/bbl |
| Brent post-reopening announcement drop | ~11% (single session) |
| Brent mid-June 2026 settlement | $83.82/bbl |
| WTI mid-June 2026 settlement | $80.95/bbl |
| Estimated stranded supply to be released | ~93 million barrels |
| Daily supply removed during closure | ~10 million bpd |
| Strait's share of global oil/LNG trade | ~20% |
| Russian gasoline output (post-drone strikes) | ~65% of seasonal average |
| Conflict start date | February 28, 2026 |
| Strait reopening announcement | April 17, 2026 |
Frequently Asked Questions: Oil Prices, Strait of Hormuz, and Shipping Normalisation
What percentage of global oil supply passes through the Strait of Hormuz?
Approximately 20% of daily global oil and LNG shipments transit the Strait of Hormuz under normal operating conditions. During the 2026 closure, an estimated 10 million barrels per day were effectively removed from accessible global supply, making it the single largest volumetric supply shock in market history.
Why did oil prices fall after the strait reopened?
Oil markets are forward-looking mechanisms that price anticipated conditions rather than confirmed physical realities. When Iran announced the reopening, traders immediately began pricing in the expected return of approximately 93 million barrels of stranded supply, causing Brent crude to fall roughly 11% in a single session from its crisis peak. The oil prices Strait of Hormuz shipping reopening dynamic exemplifies how geopolitical announcements can move markets well ahead of physical supply changes.
How long will full shipping normalisation take?
Industry analysts broadly expect complete operational normalisation to require several months from the reopening announcement, due to infrastructure damage in southern Iran, lingering insurer risk assessments, and the operational complexity of resuming large-scale tanker movements after an extended disruption.
Could oil prices rise again if tensions escalate?
Yes. If the current ceasefire collapses or new military incidents disrupt shipping lanes, Brent crude could re-test the $100-120/bbl range. The market continues to embed a residual geopolitical risk premium reflecting this possibility, which is why the oil prices Strait of Hormuz shipping reopening narrative has not produced as sharp a price decline as the raw supply wave logic alone would suggest.
Disclaimer: This article contains forward-looking analysis, scenario projections, and market commentary drawn from publicly available sources as of July 2026. Price forecasts and geopolitical scenarios represent analytical frameworks and should not be interpreted as investment advice. Oil markets involve material uncertainty and prices may deviate significantly from any projected range depending on developments not currently foreseeable.
Want to Stay Ahead of the Next Major Resource Discovery Amid Energy Market Volatility?
While geopolitical shocks like the Strait of Hormuz closure reshape global commodity markets, Discovery Alert's proprietary Discovery IQ model delivers real-time alerts on significant ASX mineral discoveries, instantly translating complex resource data into actionable investment insights — explore historic discoveries and their returns to understand the opportunity, then begin your 14-day free trial to position yourself ahead of the market.