June 12, 2026
The Anatomy of an Oil Price Shock: When Geopolitics Overrides Fundamentals
Energy markets have a long memory for chokepoint risk. The history of oil price volatility is not primarily a story of supply and demand imbalances — it is a story of geography, specifically the handful of narrow waterways and coastal facilities through which the majority of the world's crude must pass before reaching refineries. When those chokepoints come under credible threat, markets do not wait for barrels to disappear.
They price in the probability of disruption immediately, and that forward-looking risk premium can be far larger than any actual volume loss. Understanding oil geopolitics and logistics is therefore essential context for interpreting how swiftly benchmarks can reprice.
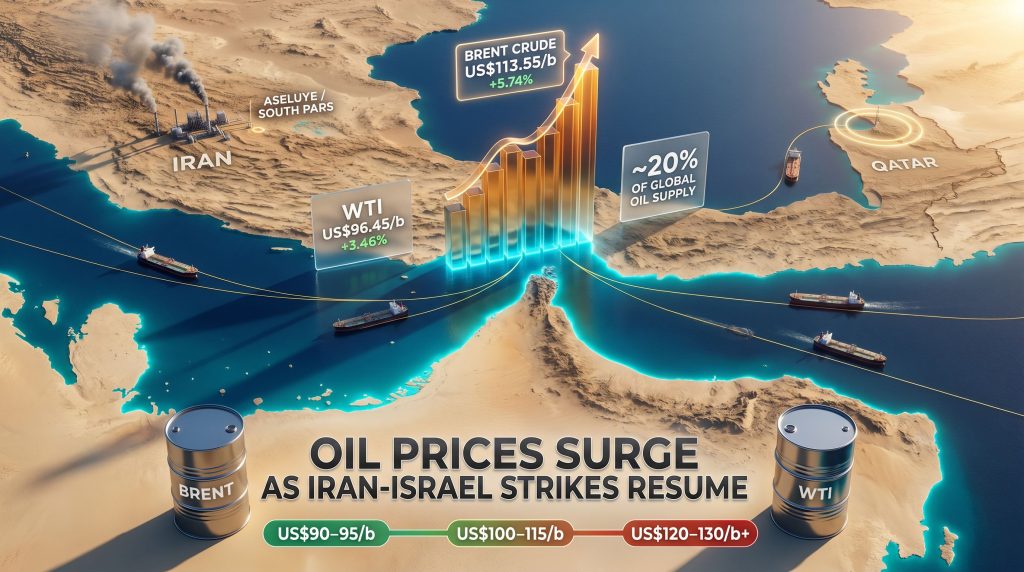
That mechanism is exactly what drove global benchmarks sharply higher at the start of the week, as oil prices surge as Iran-Israel strikes resume, shattering a fragile two-month ceasefire. The session reopened a risk premium that investors had spent most of May unwinding — and the speed of that repricing reflects just how thin the margin of confidence in Gulf stability had become.
When big ASX news breaks, our subscribers know first
From Ceasefire to Confrontation: Understanding the Renewed Escalation
The April 2026 ceasefire had been brokered under significant diplomatic pressure, with the Trump administration playing a central mediation role. For approximately six weeks, energy markets responded with relief, gradually discounting the extreme risk premiums that had built up during the worst of the Strait of Hormuz disruption. Brent crude fell close to 19% from its April peak as investors priced in a trajectory toward diplomatic resolution and restored Gulf oil flows.
That trajectory broke sharply over the weekend when Iran launched drones and missiles in the first direct exchange between the two parties since the early April ceasefire. The Israeli Air Force responded with strikes on military targets in western and central Iran. Reports indicated Israeli operations also targeted the Aseluye oil refinery and facilities associated with the South Pars gas field in southern Iran — one of the world's largest natural gas reservoirs — elevating the conflict from a military confrontation to one with direct energy infrastructure implications.
Iranian threats to retaliate against oil assets across the Gulf added another layer of market anxiety. Reports of missile damage near the Ras Laffan industrial city in Qatar — home to one of the planet's largest liquefied natural gas export complexes — and Saudi Arabia's confirmed interception of missiles targeting Riyadh and a drone attack on a natural gas facility compounded the picture significantly. Al Jazeera's coverage of these strikes highlighted how quickly the conflict shifted from bilateral to regional in its energy risk profile.
Furthermore, the policy shifts in oil markets introduced by renewed conflict have forced major producers and traders to reassess forward positioning across multiple asset classes simultaneously.
Markets are not primarily reacting to barrels already lost. They are pricing in the probability that critical Gulf energy infrastructure, LNG terminals, and regional shipping lanes could all face simultaneous disruption across multiple sovereign territories at once.
Current Oil Benchmarks: What the Numbers Actually Show
Monday's session crystallised the risk repricing across all major benchmarks. The following table captures the key price movements:
| Benchmark | Price Level | Change |
|---|---|---|
| Brent Crude (July Futures) | US$96.05/b | +3.18% |
| WTI (August Futures) | US$93.67/b | +3.46% |
| Brent Intraday Peak | US$98.00/b+ | Session high before diplomatic signals eased pressure |
| Dated Brent Spot Cargo (April peak) | US$120.00+/b | Reflected near-complete Hormuz tanker shutdown |
The divergence between spot cargo prices and futures during peak April disruption was particularly revealing. Even as Brent June futures closed near US$94.75/b in April, physical cargo prices were trading approximately US$30/b higher, reflecting the real-world constraint that tanker operators were simply not moving oil through the Strait. That kind of basis dislocation is rare in liquid commodity markets and signals genuine physical supply stress rather than speculative positioning.
The Strait of Hormuz: Why This Waterway Determines Global Energy Prices
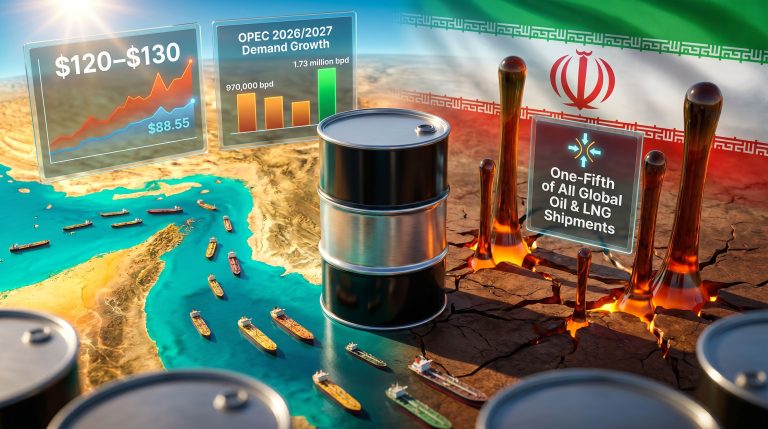
The Strait of Hormuz is approximately 33 kilometres wide at its narrowest navigable point, connecting the Persian Gulf to the Gulf of Oman and, from there, to global shipping routes. Roughly 17 to 20 million barrels of crude oil per day transit this passage, representing approximately one-fifth of global supply. There is no practical alternative for most Gulf producers — rerouting via pipeline or around the Cape of Good Hope adds 10 to 14 days per voyage and dramatically increases freight costs and insurance premiums.
During peak April escalation, near-complete shutdown of tanker traffic demonstrated in live market conditions exactly what the theoretical risk of Hormuz closure looks like in practice. War-risk insurance premiums for Gulf routes re-priced sharply, and tanker operators began factoring in the realistic possibility that vessels could be targeted.
The global LNG supply outlook adds a separate but related vulnerability: Qatar's Ras Laffan complex exports substantial volumes of liquefied natural gas to European and Asian buyers, meaning a simultaneous oil and gas disruption is now a scenario markets must assign meaningful probability to.
The Asian Inventory Buffer and Its Limits
One structural factor that has prevented the worst-case supply shock scenarios from materialising is China's strategic response to the crisis. Rather than competing in an elevated spot market, China drew down existing inventories aggressively, reducing its import volumes significantly since the conflict began. This behaviour dampened demand-side pressure on spot prices during the initial disruption.
However, inventory drawdown strategies have a finite duration. The critical dynamic to understand is that:
- Strategic reserves and commercial inventories can absorb weeks, not months, of reduced imports
- Once buffers are exhausted, buyers must re-enter the spot market regardless of price levels
- Japan, South Korea, and India face structurally similar exposure without equivalent strategic reserve depth
- Extended Hormuz restriction would eventually force all Asian importers back into a severely constrained supply environment simultaneously
The buffer has bought time. It has not, however, eliminated the underlying supply risk.
OPEC+ Production Decisions in a Destabilised Market
OPEC+ approved a July production quota increase of 188,000 barrels per day ahead of Monday's session. The logic underpinning that decision was straightforward: the cartel was betting that the diplomatic trajectory pointed toward ceasefire consolidation and gradual Hormuz reopening, which would allow increased production to meet recovering demand. OPEC's market influence remains a central variable in how these price movements ultimately resolve.
The weekend missile exchanges put that assumption under direct challenge. There is a structural disconnect between OPEC+ paper supply increases and physical delivery capacity when the primary transit route for Gulf crude remains operationally uncertain. Quota increases that cannot be physically moved to market provide limited price relief.
Furthermore, OPEC demand revisions had already signalled a cautious outlook before the weekend's events, adding further complexity to the cartel's forward planning.
The EIA's Short-Term Energy Outlook had projected global oil inventory drawdowns averaging 8.5 million barrels per day in the second quarter of 2026, with Brent crude averaging approximately US$106/b across May and June. That forecast was constructed under conditions of ceasefire optimism. If the weekend exchanges signal a return to sustained conflict, the EIA's inventory drawdown projections would likely require upward revision, with Q3 2026 averages potentially moving materially above current consensus.
Three Scenarios for Oil Prices Through Q3 2026
Understanding the forward price environment requires thinking in scenarios rather than point forecasts. The probability distribution across outcomes shifted meaningfully following the weekend strikes.
Scenario 1: Rapid De-escalation (Base Case, Now Diminished Probability)
Diplomatic intervention restores ceasefire conditions within two to four weeks. Hormuz tanker traffic normalises progressively, and OPEC+'s July quota increase offsets disrupted Iranian volumes. Under this pathway, Brent would likely retrace toward the US$90 to 95/b range by late Q3 2026, and the extreme spot-to-futures basis dislocation seen in April would gradually close.
Scenario 2: Prolonged Stalemate (Elevated Probability Post-Weekend Strikes)
Intermittent strikes continue without escalating to full-scale regional war. Hormuz remains partially disrupted, with tanker traffic operating but under elevated insurance premiums and operational restrictions. Reuters reporting on supply worries has similarly highlighted the structural risk of this prolonged stalemate scenario. Under these conditions:
- Brent consolidates in the US$100 to 115/b range through Q3 2026
- Asian inventory buffers gradually exhaust, accelerating spot market tightening
- OPEC+ faces increasing pressure between its stated quota policy and physical delivery realities
- Refined product markets tighten faster than crude benchmarks suggest
Scenario 3: Broader Gulf Escalation (Tail Risk, Materially Higher Than Pre-Weekend)
Iranian strikes successfully damage energy infrastructure in Saudi Arabia, the UAE, or Qatar. A Ras Laffan LNG disruption would trigger simultaneous oil and gas price spikes across both commodity markets. Under this pathway, Brent would retest or exceed the US$120/b+ April peak, with some scenario analyses pointing toward US$130/b+ if multiple facilities face concurrent damage. Global recession risk increases materially, and central banks face a genuine stagflationary policy dilemma.
The next major ASX story will hit our subscribers first
Mexico's Structural Position: Benefit Constrained by Self-Imposed Limitations
For Mexico, the oil prices surge as Iran-Israel strikes resume creates a paradoxical fiscal situation that illustrates how policy architecture can limit the capture of external price windfalls.
The 2026 federal budget was constructed on a Mexican Mix reference price of US$54.9/b — a figure that has been rendered almost historically irrelevant by events. The SHCP's April Pre-Criterios 2027 revision pushed that assumption up by 40.8% to US$77.3/b, reflecting acknowledgment that the Iran conflict had fundamentally altered the price environment. Even this revised figure has been consistently exceeded by actual export prices through the second quarter.
| Fiscal Reference Point | Price Assumption | Context |
|---|---|---|
| Original 2026 Budget Reference Price | US$54.9/b | Set pre-conflict |
| SHCP April Pre-Criterios 2027 Revision | US$77.3/b | +40.8% upward adjustment |
| Actual Q2 2026 Export Prices | Materially above US$77.3/b | Consistent outperformance |
The revenue capture problem, however, is structural rather than cyclical. PEMEX export volumes in April 2026 averaged just 418,200 barrels per day, approximately 20% below the SHCP's 521,000 barrel per day target. The administration's refinery-first policy directs crude toward domestic processing facilities rather than export markets, which means fewer barrels are available to benefit from elevated international pricing. Selling more barrels into a domestic subsidy mechanism rather than an elevated export market is a policy choice with significant fiscal consequences.
The IEPS Subsidy: The Mechanism That Works Against Mexico When Prices Rise
Mexico's IEPS fuel subsidy framework operates as an automatic stabiliser for domestic pump prices, absorbing the difference between international refined product costs and what consumers pay at the forecourt. The mechanism is consumer-friendly by design but fiscally expensive when global benchmarks rise.
The current subsidy is running at approximately MX$2.5 billion per week, and that figure expands automatically with every dollar increase in international benchmarks. Goldman Sachs flagged an additional concern: easily accessible buffers of refined products, particularly naphtha, LPG, and jet fuel, are being depleted at an accelerating rate.
If the disruption extends further, localised supply shortages in these specific product categories become a material risk, not merely a theoretical one.
The fiscal mathematics of Mexico's position therefore work in two opposing directions simultaneously: elevated crude export prices generate incremental revenue, while rising refined product import costs expand the IEPS liability. The net benefit is positive but structurally smaller than headline price movements suggest.
The Broader Macroeconomic Transmission Mechanism
Sustained Brent crude above US$100/b has historically transmitted into headline consumer price inflation within six to eight weeks, primarily through fuel costs, freight rates, and transportation inputs. Central banks across the US, eurozone, and major emerging markets face a difficult policy environment when energy-driven inflation coincides with growth uncertainty.
The LNG dimension adds a specifically European vulnerability. European energy security remains structurally dependent on spot LNG imports following the restructuring of Russian gas supply relationships. A simultaneous disruption to Qatari LNG exports would tighten the global LNG market significantly, with European buyers competing against Asian importers for constrained spot volumes.
Second-order effects through jet fuel and shipping cost escalation create inflationary pressure that is less visible than pump prices but equally persistent across global supply chains. Diesel market tightness in particular carries significant freight cost implications that affect goods prices broadly rather than just energy sector inputs.
Frequently Asked Questions
Why did oil prices surge when Iran and Israel resumed strikes?
Renewed missile and drone exchanges raised the probability of sustained Strait of Hormuz disruption, which channels roughly one-fifth of global daily oil supply. Markets price in this infrastructure risk immediately, regardless of whether physical volumes have yet been affected.
What is the significance of the Strait of Hormuz to oil prices?
The Strait represents the only practical exit route for crude produced across the Gulf region. Its effective closure during April 2026 produced a spot cargo price premium of approximately US$30/b above futures, demonstrating the direct relationship between tanker traffic disruption and physical market pricing.
Why can't Mexico fully capture the revenue benefit of higher oil prices?
Two structural constraints limit Mexico's upside. PEMEX export volumes are running approximately 20% below government targets due to domestic refinery prioritisation, while the IEPS subsidy mechanism automatically expands the government's fiscal liability as international refined product prices rise.
What refined product shortages is Goldman Sachs warning about?
Goldman Sachs specifically flagged accelerating depletion of naphtha, LPG, and jet fuel buffers as near-term supply vulnerabilities if disruption extends beyond current projections. These petrochemical feedstocks and aviation fuels carry supply chain implications well beyond the energy sector itself.
Readers seeking further context on Middle East energy geopolitics and Mexico's oil sector dynamics can explore related coverage through Mexico Business News' Oil and Gas section at mexicobusiness.news/oilandgas.
This article contains forward-looking scenario analysis and market forecasts. These projections involve inherent uncertainty and should not be interpreted as investment advice. Actual market outcomes may differ materially from scenarios presented.
Want To Stay Ahead When Geopolitical Shocks Reprice Energy And Resource Markets Without Warning?
Discovery Alert's proprietary Discovery IQ model delivers real-time alerts on significant ASX mineral discoveries, instantly translating complex resource data into actionable investment insights for both short-term traders and long-term investors — explore historic discovery returns to understand the magnitude of opportunity these moments can create, then begin your 14-day free trial at Discovery Alert to position yourself ahead of the market.