July 18, 2026
When Two Chokepoints Collide: Understanding the Structural Oil Price Crisis Unfolding in 2026
Energy market historians often measure geopolitical oil shocks by a single variable: one conflict, one chokepoint, one price spike. The 1973 Arab embargo targeted Western consumers through coordinated export restrictions. The 1979 Iranian Revolution removed a single major producer from global supply. The 1990 Gulf War threatened one corridor. What makes the current situation — driven by oil prices on US Iran hostilities and Red Sea closure — fundamentally different is not the intensity of any individual disruption, but the simultaneous compression of two separate maritime arteries that together handle a disproportionate share of the world's seaborne crude oil.
Understanding why this convergence matters requires stepping back from the daily headline cycle and examining the structural architecture of global oil logistics. Furthermore, examining the oil trade geopolitics at play reveals how interconnected these pressure points truly are.
When big ASX news breaks, our subscribers know first
The Strait of Hormuz: Anatomy of a Single-Point Failure
Why One Narrow Waterway Controls Global Energy Security
The Strait of Hormuz sits between the Persian Gulf and the Gulf of Oman, spanning roughly 33 kilometres at its narrowest navigable point. Under normal conditions, approximately 20% of the world's total oil supply transits this passage, making it the single most consequential maritime chokepoint in the global energy system. There is no viable large-scale alternative route for the majority of Persian Gulf producers.
The dependency of Asia-Pacific economies on Hormuz transit is particularly acute:
- China sources a substantial portion of its Gulf crude imports through the strait
- India relies on Hormuz for a majority of its Middle Eastern oil imports, which account for roughly 60% of its total crude intake
- Japan and South Korea have virtually no alternative supply chain architecture for Gulf crude, making them especially exposed to disruption
- Smaller Southeast Asian economies have even less strategic flexibility in the event of prolonged transit restriction
This structural dependency is what transforms Hormuz from a diplomatic pressure point into an existential energy security variable for much of the industrialised world.
Tanker Targeting and the Insurance Mechanism Nobody Talks About
One of the least-discussed dynamics in the current crisis is how tanker interdiction creates supply shortfalls without requiring a formal closure declaration. When Iran targets vessels transiting the Persian Gulf, the immediate market response is not just operational — it is financial. War-risk insurance premiums surge, and at a certain threshold, vessel operators make a purely commercial decision to remove their ships from that trade lane.
This mechanism is critical to understand because it means the effective supply restriction can occur well before any formal blockade. When shipowners refuse to enter the Persian Gulf due to prohibitive insurance costs or direct security risk, the functional impact on oil flows mirrors a partial closure, even if the strait remains technically open. The current episode has already triggered a measurable decline in vessel traffic through the Strait of Hormuz following the collapse of the US-Iran ceasefire.
Industry analysts have observed that sustained tanker targeting creates a self-reinforcing cycle: rising insurance premiums reduce the number of willing operators, reduced operator participation further tightens effective supply, and tightening supply pushes prices higher, which paradoxically increases the geopolitical leverage of the targeting party.
The 2019 to 2020 tanker attack period offered a preview of this dynamic, but the current episode is operating at a materially higher level of intensity and with a broader regional conflict backdrop. Oil market disruption of this nature tends to have compounding effects that extend well beyond the initial trigger event.
How the Ceasefire Collapse Triggered a 4%+ Single-Session Crude Surge
The Escalation Sequence That Moved Markets
The price action that defined the week ending July 18, 2026 was not the product of a single event but the cumulative weight of a rapid escalation sequence. Reports of intensifying US-Iran hostilities confirmed that following the breakdown of the US-Iran ceasefire, military activity intensified across multiple fronts simultaneously:
- US forces conducted strikes on Iranian infrastructure, including bridges and airport facilities inside Iranian territory
- Iran launched retaliatory attacks targeting power and desalination infrastructure in Kuwait, a Gulf state with no direct involvement in the conflict
- Iran carried out what was described as its first direct strike on US facilities in Syria, representing a significant geographic expansion of the conflict
- Qatar's defence ministry confirmed its armed forces intercepted an Iranian missile attack, with a child reported wounded by shrapnel from interception operations
- In a parallel conflict zone, Ukraine's military conducted a strike on a Russian oil refinery in the Yaroslavl region, compounding global supply uncertainty from an entirely separate theatre
The compounding effect of these simultaneous events across multiple geographies produced a market response that went beyond simple risk premium repricing. It signalled to traders that the conflict had entered a phase of multi-directional escalation with no near-term de-escalation pathway visible.
Oil Price Response: The Numbers Behind the Move
The crude market's reaction to this escalation sequence was sharp and broad-based:
| Benchmark | Session Close | Session Gain | Weekly Gain | Pre-War Baseline | Prior May Peak |
|---|---|---|---|---|---|
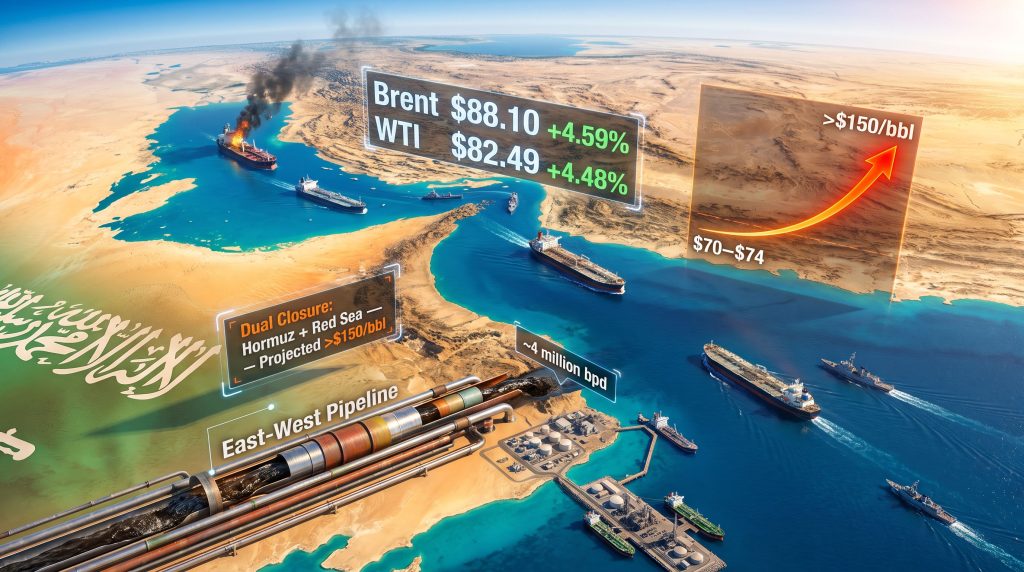
| Brent Crude | $88.10/bbl | +$3.87 (+4.59%) | ~16% | ~$70–$74/bbl | ~$103/bbl |
| WTI Crude | $82.49/bbl | +$3.54 (+4.48%) | ~16% | ~$70–$74/bbl | ~$103/bbl |
Both benchmarks settled at their highest levels since mid-June. Brent was on track for a third consecutive weekly gain while WTI registered its second. The weekly performance of approximately 16% for both contracts represents one of the more compressed bullish moves seen in crude markets outside of outright supply shock events.
The price trajectory is also instructive in what it reveals about market memory. Crude had traded near $70 to $74 in early July before conflict escalation resumed. A prior spike to approximately $103 per barrel occurred in May during earlier hostilities, before retreating as diplomatic activity created temporary relief. The current trajectory, if the escalation sequence continues, points toward a retest of those May highs as a near-term probability. Monitoring crude volatility trends remains essential for understanding where prices may settle in the weeks ahead.
The Red Sea Dimension: Saudi Arabia's Strategic Pivot Becomes Its Vulnerability
How the Yanbu Bypass Strategy Created an Unintended Exposure
One of the more structurally complex dynamics of the current crisis involves Saudi Arabia's response to Hormuz risk. When ceasefire conditions deteriorated earlier in the conflict, the kingdom made the logical decision to redirect crude exports away from Persian Gulf shipping lanes. The mechanism for this redirection was the East-West Pipeline, which carries oil from the eastern oil fields to the Red Sea port of Yanbu on Saudi Arabia's western coast.
The scale of this redirection is substantial:
- Saudi Arabia has redirected more than 70% of its normal daily crude exports through the Yanbu route
- Shipments from Yanbu averaged 4 million barrels per day in recent weeks
- This compares to approximately 973,000 bpd from the same port in the equivalent period of the prior year
- The increase represents a near fourfold surge in Red Sea export volumes from a single Saudi terminal
This strategy was rational when the primary threat was confined to the Strait of Hormuz. Yanbu offered a genuine bypass. However, the strategic calculus changed fundamentally when Iran began pressing Houthi-aligned forces in Yemen to prepare a Red Sea closure contingent on continued US strikes against Iranian power infrastructure.
The strategic paradox at the heart of the current crisis is that Saudi Arabia's most effective hedge against Hormuz disruption has simultaneously become its most concentrated vulnerability if the Red Sea route is closed.
The Bab el-Mandeb Strait, located at the southern end of the Red Sea between Yemen and Djibouti, controls the gateway through which Yanbu exports must travel to reach global markets. A closure at Bab el-Mandeb would not merely add disruption to an already stressed system — it would directly neutralise the primary risk management tool that the world's largest oil exporter has deployed. The threat of Red Sea closure has consequently become one of the most closely watched variables in global energy markets.
Mapping the Chokepoint Risk Matrix
| Disruption Scenario | Estimated Brent Price Range | Estimated Supply Volume at Risk |
|---|---|---|
| Hormuz Partial Restriction (current) | $88 to $98/bbl | ~20% of global oil supply |
| Hormuz Full Closure | $98 to $126/bbl | ~20% of global oil supply |
| Bab el-Mandeb Closure Only | +$20/bbl incremental | Saudi and Gulf redirected exports |
| Dual Closure: Hormuz and Red Sea | Projected above $150/bbl | Potentially 25 to 30% of seaborne crude |
Why the Dual Chokepoint Scenario Has No Historical Precedent
Comparing the Current Crisis to Prior Oil Shocks
Every significant geopolitical oil shock in modern history involved either a supply restriction or a single chokepoint threat, never a credible simultaneous closure of both primary exit corridors for Gulf crude. A brief comparison illustrates this point clearly:
- 1973 Arab Oil Embargo: Politically coordinated export restrictions targeting specific consuming nations; no physical chokepoint closure
- 1979 Iranian Revolution: Removal of Iranian production from global supply; Hormuz remained open
- 1990 Gulf War: Hormuz closure was threatened but never executed; no Red Sea dimension
- 2019 Houthi Drone Strikes on Saudi Aramco: Temporary production disruption at Abqaiq; neither chokepoint was closed
- 2023 to 2024 Houthi Red Sea Campaign: Red Sea disruption without simultaneous Hormuz pressure; a single-corridor event
The current scenario is the first in which credible operational threats exist against both corridors simultaneously, which is precisely why standard scenario-modelling tools produce unusually wide price forecast ranges. There is no historical calibration point for markets to anchor expectations to.
The $150 Pathway and What It Would Mean
Three distinct scenarios map the trajectory from the current $88 Brent level to the threshold that analysts describe as historically unprecedented:
Scenario A: Continued Partial Hormuz Disruption
Brent holds in the $88 to $98 range. Tanker targeting continues but no formal closure is declared. War-risk insurance remains elevated, reducing effective tanker availability. Global strategic petroleum reserve releases provide partial relief. Price pressure is sustained but manageable.
Scenario B: Hormuz Full Closure
Brent moves into the $98 to $126 range. Emergency OPEC+ coordination is triggered. Major consuming nations activate coordinated strategic petroleum reserve releases. Global refinery feedstock security becomes a near-term concern, particularly for Asian refiners with limited inventory buffers.
Scenario C: Dual Closure of Hormuz and Bab el-Mandeb
Brent is projected above $150 per barrel. Saudi Yanbu exports are halted. No alternative routing exists at scale for Gulf crude. The inflationary pass-through into retail fuel, food, and manufacturing costs in major economies becomes severe within weeks. In this context, OPEC market influence becomes increasingly relevant, as the alliance's ability to deploy spare capacity represents one of the few available price stabilisation mechanisms.
A critical but underappreciated ceiling exists in this scenario framework: crude prices sustained above $120 to $130 per barrel historically generate measurable demand destruction in price-sensitive emerging markets, particularly across South and Southeast Asia. A $150+ event would likely trigger its own correction mechanism through demand collapse, but the economic damage occurring during the transition to that correction could be severe and lasting for vulnerable economies.
Infrastructure as a Weapon: The Emerging Pattern in Multi-Theatre Conflict
Energy Systems Under Direct Attack
One of the analytically important developments in the current crisis is the deliberate targeting of non-military energy infrastructure. Iranian strikes on Kuwait's power and desalination facilities represent an escalation beyond tanker interdiction toward attacking the foundational systems that sustain Gulf state economies and populations.
Desalination infrastructure is particularly significant in this context because Gulf states depend on it for potable water, meaning attacks on these systems carry humanitarian as well as economic consequences. Simultaneously, Ukraine's strike on a Russian oil refinery in the Yaroslavl region added another layer of global supply uncertainty from an entirely separate conflict theatre. The application of Russian oil sanctions in recent years has already demonstrated how targeted pressure on energy infrastructure can reshape trade flows in lasting ways.
For energy market participants, this pattern carries a specific implication: the risk premium embedded in crude prices is no longer simply a function of chokepoint probability. It now incorporates the broader risk that production, refining, and utility infrastructure supporting oil sector operations in multiple regions could be directly targeted. This represents a structural shift in how oil prices on US Iran hostilities and Red Sea closure are being assessed by market participants globally.
The next major ASX story will hit our subscribers first
What Investors and Market Participants Should Monitor
Key Variables That Will Determine the Price Trajectory
For those navigating the current environment, the following indicators represent the highest-signal data points for assessing near-term price direction:
- Tanker transit volume through Hormuz: Any measurable further decline in vessel numbers confirms effective supply restriction is deepening
- War-risk insurance premium levels: A sustained spike above current elevated levels signals the shipowner refusal threshold is approaching
- Houthi operational activity in the Red Sea: Any confirmed military preparation for Bab el-Mandeb interdiction would represent a step-change escalation
- Diplomatic back-channel signals: Qatar and Oman have historically served as communication conduits between the US and Iran; any reported diplomatic activity through these channels is a potential de-escalation indicator
- OPEC+ emergency meeting speculation: Any credible reporting of emergency coordination discussions among major producers would signal the alliance is preparing to deploy spare capacity as a price suppression tool
- US strategic petroleum reserve release announcements: Historical precedent suggests coordinated consumer-nation SPR releases can produce a $10 to $20 per barrel correction in Brent, though the effect is typically temporary
The asymmetry of the current risk profile is worth stating explicitly. De-escalation through a renewed ceasefire would likely unwind a meaningful portion of the geopolitical risk premium embedded in current prices, but the upside scenario from further escalation into dual chokepoint closure territory represents a magnitude of impact that underscores just how consequential oil prices on US Iran hostilities and Red Sea closure have become for the global economy.
This article contains forward-looking analysis, scenario projections, and price range estimates based on publicly available market information and historical precedent. These projections are not investment advice and should not be relied upon as predictions of future commodity prices. Energy markets are subject to rapid change, and actual outcomes may differ materially from any scenarios described above.
Want to Stay Ahead of the Next Major Resource Discovery Amid Global Energy Volatility?
When geopolitical shocks reshape commodity markets at this speed, Discovery Alert's proprietary Discovery IQ model cuts through the noise — delivering real-time ASX mineral discovery alerts that transform complex market data into actionable investment insights. Explore historic discoveries and their extraordinary returns, then start your 14-day free trial at Discovery Alert to position yourself ahead of the market before the next major opportunity emerges.