July 30, 2026
The Geopolitical Risk Premium Driving Crude Markets in 2026
Energy markets have long operated under a principle that experienced traders understand intimately: the most powerful price driver is not always the disruption that has already occurred, but the uncertainty about whether it will worsen or resolve. This psychological dimension of commodity pricing, where ambiguity commands its own premium, sits at the heart of why oil prices rise on US-Iran peace talks uncertainty even as a ceasefire technically remains in place.
The current crude market dynamics are a textbook study in how diplomatic deadlock translates into structural price floors. When active conflict is replaced by fragile ceasefire, markets do not simply relax. Instead, they recalibrate around a new set of unknowns: Will talks collapse? Will infrastructure ever fully recover? How long can producers in disrupted regions sustain reduced output?
These questions, layered on top of one another, create a pricing environment that resists easy resolution.
When big ASX news breaks, our subscribers know first
How Stalled US-Iran Diplomacy Is Reshaping Global Oil Market Fundamentals
Understanding the Geopolitical Risk Premium in Crude Pricing
The geopolitical risk premium is the additional cost baked into crude oil prices above what supply-demand fundamentals alone would justify. In stable periods, this premium is minimal. During active conflicts or unresolved diplomatic standoffs, it can represent anywhere from $5 to $30 per barrel depending on the severity and duration of the threat.
What makes the current situation particularly complex is that diplomatic uncertainty, not active warfare, is now the dominant pricing force. A ceasefire was established six weeks ago, yet markets have not responded with meaningful price relief. The reason is straightforward: a ceasefire stops the shooting but does nothing to repair destroyed terminals, restore tanker traffic, or restart the logistical chains that move crude from wellhead to export berth.
This creates a dual pressure dynamic that experienced commodity analysts recognise as especially persistent:
- Supply destruction already underway continues to remove barrels from the market regardless of diplomatic progress
- The risk of further disruption if talks collapse or the ceasefire fractures provides a forward premium that traders are unwilling to relinquish
- Infrastructure repair timelines mean that even a successful agreement produces no immediate price relief, extending the premium well into 2027
Key Price Benchmarks and What They Signal Right Now
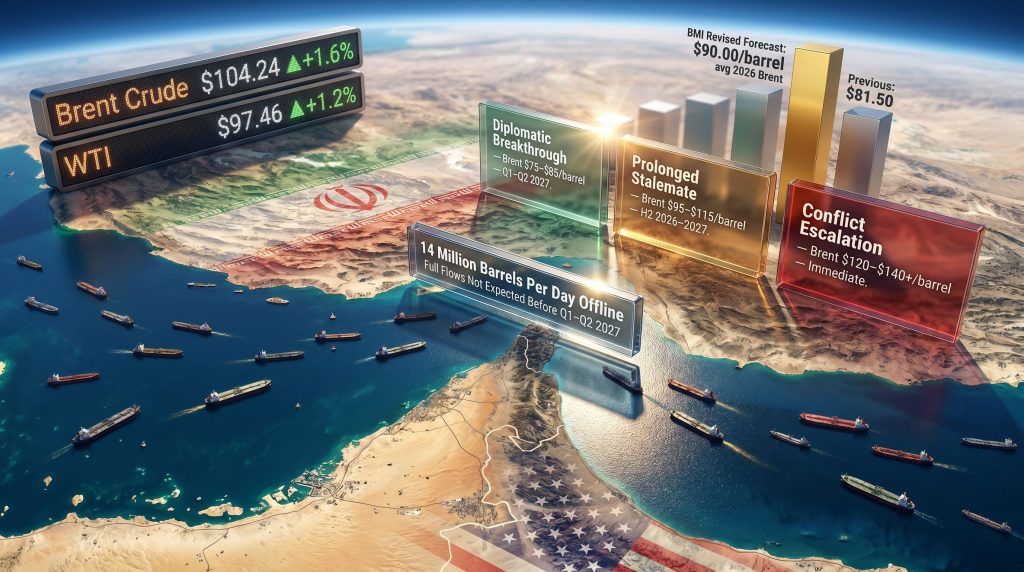
The price action observed on May 22, 2026 captured this tension in a single trading session:
| Benchmark | Price (May 22, 2026) | Daily Change | Weekly Change |
|---|---|---|---|
| Brent Crude Futures | $104.24/barrel | +$1.66 (+1.6%) | -4.6% |
| WTI (West Texas Intermediate) | $97.46/barrel | +$1.11 (+1.2%) | -7.6% |
The divergence between intraday gains and weekly losses is not a contradiction. It reflects a market caught between two competing forces: short-term pessimism about diplomatic progress driving prices higher on any given day, and periodic bursts of optimism over the course of the week triggering sell-offs before scepticism reasserts itself.
Commodity analyst Satoru Yoshida of Rakuten Securities has assessed that WTI is likely to remain broadly within a $90 to $110 per barrel range in the near term, a forecast that has held since late March. This range functions as a structural feature of the conflict environment rather than a temporary aberration.
A sustained Brent price above $100 per barrel carries significant macroeconomic consequences that ripple well beyond energy markets:
- Consumer price inflation accelerates across import-dependent economies
- Central banks in the US, EU, and UK face complications in their rate-cutting cycles
- Corporate input costs rise, compressing margins in manufacturing and logistics
- Sovereign budget pressures increase in oil-importing nations with limited reserve buffers
Key Insight: The simultaneous weekly decline and daily gain in crude prices reflects a market caught between diplomatic optimism and structural supply destruction. Analysts warn this tension could persist well into 2027, making the current price environment a structural feature rather than a temporary spike.
What Is the Strait of Hormuz and Why Does It Control Global Oil Prices?
The World’s Most Critical Energy Chokepoint
The Strait of Hormuz is a narrow waterway connecting the Persian Gulf to the Gulf of Oman, spanning roughly 33 kilometres at its narrowest navigable point. Despite its modest physical dimensions, it functions as the circulatory artery of the global energy system. Before the current conflict, approximately 20% of all global oil and LNG shipments transited this corridor annually, making it the single most consequential energy chokepoint on the planet.
No alternative route exists that can absorb its full throughput capacity. While Saudi Arabia operates the East-West Pipeline connecting Gulf fields to Red Sea terminals, and the UAE has the Habshan-Fujairah pipeline with a capacity of roughly 1.5 million barrels per day, neither infrastructure network can substitute for the full volume that historically moved through the Strait.
The four major exporters whose flows have been materially disrupted include:
- Saudi Arabia (the world’s largest crude exporter)
- Iraq (OPEC’s second-largest producer)
- The United Arab Emirates
- Kuwait
How Much Supply Has Been Removed From Global Markets?
The scale of the current disruption is difficult to overstate. An estimated 14 million barrels per day (bpd) has been effectively removed from functioning global supply since the conflict began. Against a baseline of approximately 100 million bpd in total global consumption, this represents a withdrawal of roughly 14% of all oil the world uses daily.
To contextualise this figure historically, the 1973 Arab oil embargo removed approximately 4 to 5 million bpd from Western markets, triggering price quadrupling and recession across multiple economies. The current disruption is more than three times that scale in raw volume terms, though modern strategic reserves, demand flexibility, and non-OPEC production capacity provide partial buffers that did not exist in 1973.
Even a partial restoration of Strait transit capacity would meaningfully shift price trajectories. Consequently, the market’s sensitivity to incremental supply recovery is high, which is precisely why each diplomatic signal, however ambiguous, triggers notable price swings.
When Will Full Oil Flows Through the Strait Resume?
The head of ADNOC, Abu Dhabi National Oil Company, has stated clearly that full oil flows through the Strait of Hormuz are not expected to resume before the first or second quarter of 2027, even if a peace agreement were concluded immediately. This is not a political forecast but an engineering one.
The infrastructure repair timeline involves multiple sequential steps:
- Physical damage assessment of terminals, loading facilities, and subsea pipelines
- Procurement and mobilisation of specialised repair equipment and crews
- Safety certification of repaired facilities before commercial operations resume
- Gradual restart of loading operations, tanker scheduling, and shipping insurance normalisation
- Full throughput restoration requiring 6 to 8 weeks of post-conflict stabilisation at minimum
This creates what analysts refer to as conflict tail risk, the lag period between diplomatic resolution and actual market normalisation. It is a concept that investors often underestimate when pricing in the value of a potential peace deal.
Critical Data Point: Even a fully successful peace agreement signed today would not restore full oil supply flows until early-to-mid 2027, according to ADNOC leadership. This structural supply deficit cannot be resolved by diplomacy alone, making current elevated prices a forward-looking economic reality rather than a speculative premium.
What Are the Sticking Points in US-Iran Peace Talks?
Why Diplomatic Progress Has Stalled After Six Weeks of Ceasefire
Six weeks have elapsed since the ceasefire came into effect, and substantive progress toward a durable agreement remains elusive. The negotiations are deadlocked around two core unresolved issues:
- Iran’s uranium enrichment stockpile: The scale of accumulated enriched uranium and the conditions under which it would be disposed of, transferred, or monitored remain deeply contested. Iran’s enrichment programme represents a fundamental security concern for the US and its regional partners, and neither side has yet found mutually acceptable verification mechanisms.
- Control arrangements for the Strait of Hormuz: Who governs transit rights, under what legal framework, and with what enforcement mechanisms are questions that touch directly on Iranian sovereignty and regional power balance. Any arrangement that Iran perceives as surrendering control over this waterway faces significant domestic political resistance.
A senior Iranian source confirmed to Reuters that gaps with the US have narrowed, whilst US Secretary of State Marco Rubio acknowledged there are positive indications emerging from the negotiating process. However, according to Al Jazeera’s coverage of the stalled talks, markets interpreted this language as cautiously insufficient, noting that diplomatic communiqués typically use more definitive language when a breakthrough is genuinely imminent.
Why Markets Are Discounting Diplomatic Optimism
The asymmetry in market response to diplomatic signals has become a defining characteristic of the current trading environment. Positive signals produce modest and short-lived price dips. Signs of stalemate produce sharper and more sustained rallies. This asymmetry reflects a rational updating of probability weights by traders who have now observed six weeks of ceasefire without structural progress.
This phenomenon, sometimes described as diplomatic fatigue in commodity markets, occurs when repeated near-breakthroughs erode the credibility of future positive signals. Each time optimistic language fails to produce an agreement, the market applies a larger discount to the next round of optimistic language. Investors effectively condition themselves to treat diplomatic progress as noise until hard evidence of agreement materialises.
A less commonly appreciated dynamic is the role of options market positioning in amplifying this effect. When traders hedge against conflict escalation by buying call options on crude, the resulting dealer hedging activity creates upward price pressure in futures markets independent of fundamental supply changes. This mechanical feedback loop can sustain elevated prices even when physical supply and demand conditions are static.
How Are Global Energy Markets and Economies Responding?
Inflation, Growth Risk, and the Macroeconomic Transmission of High Oil Prices
Elevated crude prices transmit into broader economic conditions through multiple channels simultaneously, creating a compounding effect that is more damaging than any single channel in isolation:
- Transport and logistics costs rise directly with fuel prices, feeding into the cost of virtually every physical good
- Agricultural production costs increase as fertiliser prices (which track natural gas) and farming equipment fuel costs rise
- Manufacturing input costs climb across energy-intensive industries including chemicals, plastics, and metals processing
- Retail energy bills for households and businesses increase directly, reducing discretionary spending capacity
The UK has emerged as a notable case study in how Middle East conflict-driven energy price increases feed into domestic inflation metrics. Furthermore, economies that import the majority of their energy needs and carry limited strategic reserve capacity are disproportionately exposed to sustained crude price elevation.
Equity Markets Under Pressure From the Oil Price Surge
Global equity markets have broadly declined in response to stalled negotiations and persistently high crude prices. Analysts describe the current environment as a tug of war between strong corporate earnings in energy-producing sectors and the drag that high energy costs impose on the broader economy.
The central bank policy dimension adds another layer of complexity. Sustained oil prices above $100 per barrel complicate rate-cutting cycles in the US, EU, and UK by preventing inflation from fully returning to target. Central banks that had anticipated easing monetary conditions in 2026 now face a scenario where energy-driven inflation forces a more cautious stance, extending the period of restrictive borrowing costs and weighing on growth-sensitive asset classes.
What Capital Economics Is Forecasting for Oil Market Fundamentals
David Oxley, Chief Commodities Economist at Capital Economics, has assessed that oil prices will only trend materially lower when market fundamentals improve in a sustained way, a shift he projects is likely to extend into 2027. This view aligns precisely with the ADNOC infrastructure timeline and reinforces the interpretation that the current supply deficit is structural rather than transient.
A concept worth introducing here is the demand-side ceiling: the price level at which demand destruction begins to counteract supply-side disruption. Historical evidence suggests that sustained Brent prices above $110 to $120 per barrel begin triggering meaningful demand reduction in price-sensitive economies, particularly in Asia. This ceiling acts as a natural cap on how far prices can rise before market forces begin to self-correct, though it provides cold comfort to inflation-affected consumers in the interim.
What Has OPEC+ Decided and Can It Fill the Supply Gap?
The June 7 OPEC+ Meeting: What a Modest Output Hike Actually Means
Seven leading OPEC+ member nations are expected to agree to a modest production increase for July at their June 7 meeting. However, a critical distinction must be understood before interpreting this as meaningful market relief. OPEC’s global influence over supply decisions remains significant, yet several member states expected to contribute to this increase have their own delivery disruptions caused by the Iran conflict.
This introduces a fundamental gap between announced production and physically delivered supply, a distinction commodity traders express as the difference between paper barrels and wet barrels.
| Production Type | Definition | Market Impact |
|---|---|---|
| Paper Barrels | Announced or quota-allocated production | Influences sentiment, limited real impact |
| Wet Barrels | Physically produced and delivered crude | Directly affects supply-demand balance |
When OPEC+ members face their own infrastructure damage or transit disruptions, announced quota increases do not automatically translate into additional barrels reaching consuming markets. Investors who price in the full announced increase without accounting for this delivery gap risk overestimating the supply relief. In addition, OPEC demand revisions have further complicated how markets interpret supply commitments in the current environment.
BMI’s Revised Price Forecast: What Fitch Solutions Is Telling Investors
| Metric | Previous Forecast | Revised Forecast | Reason for Revision |
|---|---|---|---|
| Average 2026 Brent Price | $81.50/barrel | $90.00/barrel | Supply deficit, infrastructure damage, 6-8 week normalisation lag |
BMI, operating as a unit of Fitch Solutions, has raised its average 2026 Brent crude price forecast by $8.50 per barrel. The revision reflects three compounding factors working simultaneously: the ongoing physical supply deficit, the time required to repair damaged Middle East energy infrastructure, and the post-conflict normalisation window that delays the translation of any peace agreement into actual supply recovery.
Analyst Watch: BMI’s revised forecast of $90 per barrel represents a floor estimate for average 2026 Brent pricing. Given that prices have already traded well above this level, the forecast implies continued upside risk if diplomatic talks remain deadlocked through the second half of the year.
For energy sector investors, this forecast revision carries several practical implications:
- Upstream producers with assets outside the conflict zone benefit from sustained high realisations
- Refining margins face pressure as feedstock costs remain elevated while product demand shows early signs of softening
- Sovereign wealth funds in oil-exporting nations enjoy revenue windfalls but face complex reinvestment decisions in a volatile price environment
- Hedging costs for airlines, shipping companies, and industrial energy consumers have risen substantially, compressing margins across transport-dependent sectors
The next major ASX story will hit our subscribers first
What Does This Mean for Energy Security and Long-Term Supply Strategy?
Structural Vulnerabilities Exposed by the Hormuz Disruption
The current crisis has exposed with unusual clarity the degree to which global energy security remains concentrated around a single maritime chokepoint. Decades of infrastructure investment and geopolitical risk management have not eliminated the fundamental vulnerability of routing one-fifth of global energy supply through a 33-kilometre waterway.
The policy responses taking shape across consuming nations include:
- Accelerated interest in alternative pipeline routes that bypass the Persian Gulf entirely
- LNG supply diversification toward Atlantic Basin and Australian sources
- Strategic petroleum reserve deployment to bridge the gap between current supply and normalised flows
- Non-OPEC production acceleration, particularly from US shale operators, Canadian oil sands, and Brazilian deepwater fields
The limits of non-OPEC offset capacity are real and important to understand. US shale production is already operating near capacity in key basins, and the rapid-response drilling capability that characterised the 2014 to 2019 shale boom has been partially constrained by capital discipline commitments and labour market tightness. Brazilian pre-salt fields operate on long lead times unsuited to emergency production increases.
Scenario Modelling: Three Paths Forward for Oil Prices
| Scenario | Trigger Condition | Projected Brent Range | Timeline |
|---|---|---|---|
| Diplomatic Breakthrough | Full peace agreement and Strait reopening | $75-$85/barrel | Q1-Q2 2027 |
| Prolonged Stalemate | Talks collapse, ceasefire holds | $95-$115/barrel | H2 2026-2027 |
| Conflict Escalation | Ceasefire breakdown, new hostilities | $120-$140+/barrel | Immediate |
Based on current diplomatic signals, market participants appear to be assigning the highest probability weight to the prolonged stalemate scenario. This is reflected in the options market, where implied volatility at the $110 and $120 strike prices for Brent calls remains elevated, suggesting traders are hedging meaningfully against both continued stalemate and escalation outcomes.
The diplomatic breakthrough scenario is not being priced out entirely. However, the six-week track record of ceasefire without substantive progress has reduced its near-term probability weighting substantially. Even in this scenario, the infrastructure repair timeline means that sub-$90 Brent is unlikely to materialise before 2027 at the earliest.
Frequently Asked Questions: Oil Prices and US-Iran Peace Talks
Why are oil prices rising if there is already a ceasefire in place?
A ceasefire pauses active hostilities but does nothing to restore physical infrastructure or resume oil flows. With 14 million barrels per day still offline and the Strait of Hormuz not fully operational, the supply deficit continues to support elevated prices regardless of ceasefire status. Markets price the physical reality of missing barrels, not the political status of hostilities.
What would a successful US-Iran peace deal do to oil prices?
Even a fully successful agreement would not immediately lower prices. Infrastructure repair and supply normalisation are projected to take until Q1 or Q2 2027 at the earliest, according to ADNOC leadership. Prices are therefore likely to remain structurally elevated for six to twelve months following any agreement, with gradual easing as physical supply progressively recovers.
What is the WTI price forecast for the coming weeks?
Commodity analysts have projected WTI to remain broadly within a $90 to $110 per barrel range in the near term, reflecting the balance between ongoing supply disruption and the possibility, however uncertain, of diplomatic progress. This range has held as a structural feature of the market since late March 2026.
How does the Strait of Hormuz disruption compare to past oil supply shocks?
The removal of 14 million barrels per day, representing approximately 14% of global supply, is comparable in proportional scale to the 1973 Arab oil embargo. The 1973 event removed roughly 4 to 5 million bpd but from a much smaller total consumption base, producing percentage reductions of similar magnitude. However, modern strategic reserve systems, demand flexibility, and diversified non-OPEC production provide buffers that did not exist in 1973.
Which economies are most exposed to sustained high oil prices?
Oil-importing economies with limited strategic reserves and high energy intensity face the greatest macroeconomic exposure. This includes several Asian manufacturing economies, European importers, and lower-income developing nations where energy costs represent a larger share of household budgets and where currency weakness compounds the impact of dollar-denominated crude prices.
Key Takeaways: What the Oil Market Is Telling Us About the Iran Conflict
The current market environment is one in which oil prices rise on US-Iran peace talks uncertainty as a structural rather than speculative phenomenon. Furthermore, understanding each of the following realities in isolation misses the full picture:
- The 14 million bpd supply deficit created by the Hormuz disruption is the primary structural driver of elevated prices and will not resolve quickly regardless of diplomatic outcomes
- The 2027 normalisation timeline articulated by ADNOC leadership is a market-shaping constraint that no peace agreement can accelerate past engineering reality
- Investor scepticism about near-term diplomatic breakthroughs is not pessimism but a rational, data-supported posture after six weeks of ceasefire without substantive progress
- The geopolitical risk premium in global energy markets has been permanently recalibrated upward by this conflict, with implications for infrastructure investment decisions, energy security policy, and commodity hedging strategies that will persist for years
- The distinction between paper barrels and wet barrels in OPEC+ production announcements is more important than ever, and investors who overlook this gap risk misreading the supply outlook
For context on broader commodity-level consequences, the oil market effects of simultaneous geopolitical and trade pressures have compounded the structural challenges facing energy markets in 2026. In addition, the oil price impacts stemming from US-China trade tensions have added further layers of complexity to an already fragile pricing environment. As Reuters and Investing.com have reported, inventory drawdowns have provided additional support to prices even as diplomatic signals remain ambiguous.
Disclaimer: This article contains forward-looking statements, analyst forecasts, and scenario projections based on information available as of May 22, 2026. These projections are subject to significant uncertainty and should not be construed as investment advice. Commodity prices are inherently volatile and actual outcomes may differ materially from any forecast cited. Readers should conduct independent research before making any investment decisions.
Further Exploration: Readers seeking ongoing coverage of the geopolitical dynamics shaping global energy markets can explore reporting published by Arab News on the War in Iran and its economic consequences at arabnews.com.
Want to Stay Ahead of the Next Major Commodity Discovery Driven by Shifting Energy Markets?
While geopolitical disruptions reshape global energy supply chains and elevate commodity prices across the board, Discovery Alert’s proprietary Discovery IQ model delivers real-time alerts on significant ASX mineral discoveries — instantly translating complex market data into actionable investment opportunities for both short-term traders and long-term investors. Explore historic examples of exceptional discovery returns and begin your 14-day free trial today to position yourself ahead of the next major market move.