July 13, 2026
The Geopolitics of Chokepoints: Why the Strait of Hormuz Defines Global Oil Risk
Few geographic features carry as much economic consequence as a narrow body of water separating the Arabian Peninsula from Iran. The Strait of Hormuz, at its narrowest point only about 33 kilometres wide, serves as the single most critical artery in the global oil distribution network. Roughly 17 to 21 million barrels of crude oil transit this passage every day under normal conditions, representing approximately 20% of the world's total petroleum liquids supply. When military conflict begins to orbit this waterway, energy markets do not simply react to headlines — they reprice entire risk frameworks.
Understanding how oil prices after US-Iran strikes behave requires more than tracking daily movements in Brent crude or WTI futures. It demands a layered reading of military intent, physical supply continuity, historical precedent, and the psychology of traders who have now witnessed multiple cycles of Gulf escalation. The events of the weekend of July 13, 2026 offer a compelling case study in exactly that complexity. For broader context on geopolitical oil price tensions, the region has consistently demonstrated its capacity to reshape global energy markets with little warning.
When big ASX news breaks, our subscribers know first
The Weekend Escalation and What It Actually Involved
The sequence of events that drove oil markets higher on Monday, July 13 unfolded over a compressed 48-hour window. US forces conducted more than 80 strike operations targeting Iranian drone infrastructure near Bandar Abbas, a critical naval and industrial hub on Iran's southern coast. Iran's Revolutionary Guard responded by targeting US airbases operating within the broader region.
Critically, Tehran did not limit its response to direct US positions. Iranian strikes were extended to include Qatar and the United Arab Emirates, two Gulf states that host major US military installations and together account for a significant share of global liquefied natural gas exports. This geographic expansion of the conflict introduced a new dimension of risk that markets had not yet fully priced.
The backdrop to all of this was a fragile interim agreement reached the previous month, which had briefly stabilised the situation and allowed commercial shipping through the strait to partially resume. That accord had raised genuine hopes of a negotiated resolution within a further 60-day window. The weekend's military exchanges placed serious doubt on whether that framework retained any operational validity.
Furthermore, the relationship between trade war oil prices and military conflict risk had already primed markets for heightened sensitivity, making the escalation's impact more pronounced than it might otherwise have been.
"The convergence of US strikes near Bandar Abbas, Iran's widening of targets to include Gulf state infrastructure, and the contested status of Strait transit rights created a market environment where the tail risks became suddenly much more visible, even if the base case remained one of managed friction rather than full-scale rupture."
How Oil Prices Moved: A Full Breakdown of the Price Swing
What Did the Benchmarks Actually Show?
Tracking oil prices after US-Iran strikes requires understanding not just the Monday session bounce, but the full arc of price movement across the escalation cycle. The table below captures the key benchmark movements:
| Benchmark | Price Level | Movement | Context |
|---|---|---|---|
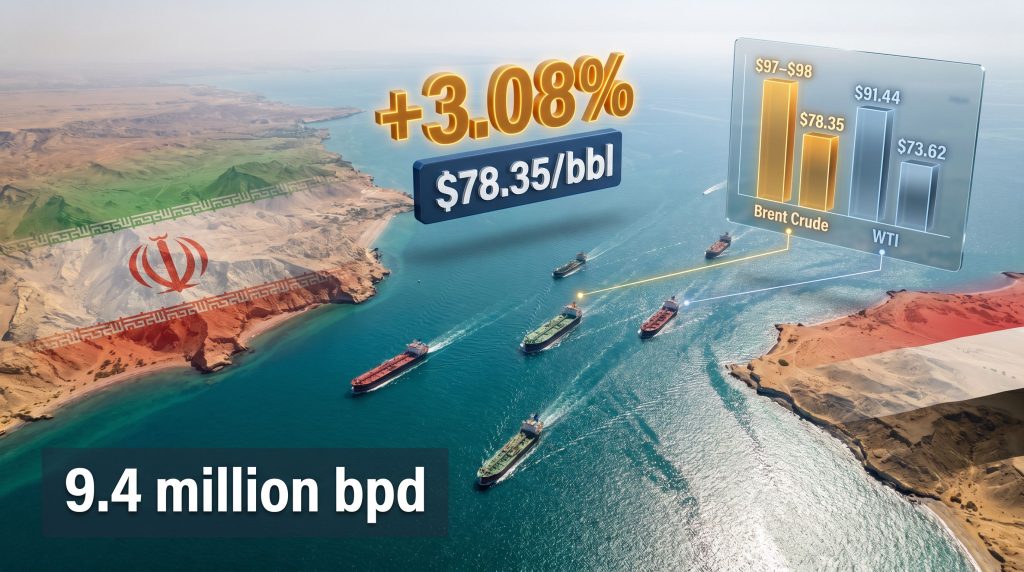
| Brent Crude (initial strike spike) | ~$97-$98/bbl | +~6.5% | Trump declared prior ceasefire over |
| WTI (initial strike spike) | ~$91.44/bbl | +3.1% | Immediate market response to first strikes |
| Brent Crude (Monday session) | $78.35/bbl | +3.08% (+$2.34) | Post-weekend escalation bounce |
| WTI (Monday session) | $73.62/bbl | +3.09% (+$2.21) | Post-weekend escalation bounce |
| Brent Crude (after correction) | ~$76.98/bbl | ~-2% | Market discounts full-war scenario |
| WTI (after correction) | ~$72.38/bbl | ~-2% | Supply continuity signals emerge |
| Brent Crude (pre-strike diplomatic period) | ~$93.36/bbl falling | -5% (approx.) | Interim agreement optimism priced in |
Several dynamics within this price sequence deserve closer analysis:
- The initial 6.5% surge in Brent reflected genuine shock at the speed with which the interim agreement appeared to dissolve, along with uncertainty about whether Kharg Island, Iran's primary crude export terminal, would be targeted.
- The subsequent correction of approximately 2% from the spike highs reflected markets reassessing Iran's response as restrained and purposeful rather than existentially escalatory.
- The 5% decline during the diplomatic optimism phase illustrates how quickly a geopolitical risk premium can deflate when talks appear viable — a pattern directly relevant to understanding what a genuine diplomatic breakthrough would do to current prices.
- The Monday session's 3% gain to $78.35 for Brent represented a middle-ground repricing: real enough to reflect the deterioration in ceasefire prospects, but measured enough to suggest traders were not yet modelling a worst-case scenario.
Why Markets Are Not Pricing a Full Supply Shock
What Is Keeping Prices From Spiking Above $100?
The most analytically interesting feature of oil price behaviour after US-Iran strikes is not the magnitude of the gains, but their relative restraint given the scale of military activity involved. Several factors explain why markets avoided a panic-driven spike above $100.
Physical supply continuity remained largely intact. Kharg Island, which handles the overwhelming majority of Iran's crude export volumes, continued operating through the weekend. Until that terminal faces direct disruption, Iran's oil exits the country regardless of the political noise surrounding the strait.
Shipping data told a nuanced story. Vessel tracking data from Kpler confirmed that six vessels transited the Strait of Hormuz on Sunday — the lowest five-week count but not a complete cessation of traffic. Markets interpret active transit data as evidence that the waterway remains functionally open, even if operating at reduced capacity and under elevated risk.
Contested claims created analytical ambiguity. US President Donald Trump stated publicly that the strait remained open to commercial traffic. Iran simultaneously declared a closure following an incident involving a vessel travelling an unapproved route. When two major parties assert contradictory operational realities, markets tend to weight physical evidence over declaratory positions from either side.
ANZ Research analysts noted that hopes for a relatively quick resolution to the recent skirmishes were fading given the weekend's developments — a signal that the risk premium, while real, was being assessed against a base case of sustained but bounded conflict rather than outright war. According to reporting from CNBC, supply disruption concerns were driving market sentiment even before the weekend's further escalation.
IG Market analysis framed the price response as reflecting a market judgement that the current escalation represented a flare-up within a fragile truce structure, falling meaningfully short of a complete ceasefire collapse. Whether that interpretation holds will depend heavily on whether either side escalates further in the days ahead.
The Supply Gap: Understanding the IEA Numbers
One of the most significant and underappreciated dimensions of this conflict is the cumulative supply damage already embedded in global oil markets, independent of what happens next at the strait.
| Supply Metric | Volume |
|---|---|
| Global oil supply increase following June interim agreement | +4.1 million barrels per day |
| Current supply deficit vs. pre-war levels | -9.4 million barrels per day |
| Strait of Hormuz normal daily transit volume | ~17-21 million bpd |
| Vessels transiting strait on conflict Sunday | 6 vessels (5-week low) |
The International Energy Agency's monthly report, released Friday July 11, confirmed that the 9.4 million barrel per day shortfall relative to pre-war supply levels represents one of the most severe sustained disruptions to global oil availability in modern history. The June interim agreement contributed a 4.1 million bpd recovery, but that partial restoration now looks increasingly vulnerable.
For context, the 9.4 million bpd gap is larger than the entire combined production of several major OPEC members. A thorough crude oil market overview illustrates just how exposed global supply chains have become. The notion that alternative suppliers can simply absorb this deficit if the ceasefire collapses entirely is not supported by current global spare capacity data.
Scenario Analysis: Where Oil Prices Go From Here
The most rigorous way to think about the forward price trajectory is through a scenario framework that maps geopolitical outcomes to supply implications and price ranges.
| Scenario | Market Implied Probability | Estimated Brent Range |
|---|---|---|
| Fragile truce holds with intermittent strikes | Moderate to High | $74-$82/bbl |
| Formal, sustained Strait of Hormuz closure | Low to Moderate | $100-$130+/bbl |
| Diplomatic breakthrough, talks resume | Moderate | $65-$72/bbl |
| Broader Gulf escalation (UAE/Qatar supply disrupted) | Low | $110-$140+/bbl |
Each scenario carries distinct implications for energy markets globally.
Scenario 1 (Fragile Truce): The most likely near-term outcome based on current shipping data and the measured military exchanges observed so far. Prices oscillate within a volatility band, with each new escalation triggering a spike and each diplomatic signal triggering a pullback. Traders accumulate and distribute positions around this cycle.
Scenario 2 (Formal Strait Closure): Represents the most severe tail risk. A complete and enforced closure removing 17-21 million barrels per day from global transit would represent a supply event with no modern historical precedent in scale. Price models in this scenario range above $130/bbl and could extend further depending on how quickly strategic petroleum reserves are deployed by consuming nations.
Scenario 3 (Diplomatic Resolution): Would rapidly deflate the geopolitical risk premium embedded in current prices. The 5% price decline observed during the pre-strike optimism phase provides a useful baseline for how aggressively markets would reprice on genuine progress.
Scenario 4 (Broader Gulf Escalation): The involvement of Qatar and the UAE introduces LNG disruption risk alongside crude oil supply risk, creating a compound energy security shock affecting both gas and oil markets simultaneously.
"The most dangerous dynamic in the current situation is the gap between the declaratory positions of both the US and Iran on strait access, and the physical reality of reduced but continuing vessel transits. Markets are betting on physical reality. If either side moves to enforce its stated position militarily, that bet fails rapidly and prices would reprice sharply higher within hours."
The next major ASX story will hit our subscribers first
Historical Parallels and What They Reveal
How Do Previous US-Iran Confrontations Compare?
Students of energy markets will recognise a recurring pattern in how oil prices respond to US-Iran confrontations. The 2019 tanker attack campaign in the Gulf of Oman produced an initial spike of approximately 4% in Brent crude before markets stabilised as physical supply disruption failed to materialise at scale. The January 2020 Soleimani strike generated an initial 4% surge that entirely reversed within 48 hours once Iran's measured missile response avoided casualties and signalled de-escalation intent.
These historical episodes point to a consistent phenomenon: geopolitical oil premiums in the Gulf tend to decay rapidly when physical supply infrastructure remains operational and when the adversarial exchange follows a pattern of calibrated rather than maximalist responses. The current cycle shares structural similarities with those precedents, though the 9.4 million bpd supply gap already embedded in the system means the price floor is meaningfully higher than in previous episodes.
A key insight that often escapes mainstream analysis is that repeated escalation cycles progressively desensitise markets. Each successive confrontation that fails to produce a sustained supply shock raises the threshold at which traders are willing to pay for geopolitical insurance. This dynamic explains why a set of military exchanges that would have generated much larger price moves in 2019 is producing relatively contained responses in 2026.
In addition, OPEC's market influence has played a meaningful role in shaping the underlying supply environment against which these geopolitical shocks are being assessed, adding another layer of complexity to price forecasting.
Who Bears the Greatest Risk if the Strait Is Blocked?
The geographic and economic exposure to a Strait of Hormuz disruption is not evenly distributed across the global economy. The nations with the greatest vulnerability include:
- India: Among the world's largest crude importers, with significant exposure to Middle Eastern supply, particularly from Gulf producers whose exports transit the strait.
- China: Depends heavily on Gulf crude to fuel its manufacturing economy, with limited ability to rapidly redirect to alternative supply sources at comparable cost.
- Japan and South Korea: Both nations import the vast majority of their crude through Hormuz, with limited domestic production and high dependence on stable transit routes.
- European LNG importers: Particularly exposed to the Qatar angle of the conflict, given Qatar's role as a leading global LNG exporter whose terminal infrastructure could face risk if the conflict expands.
OPEC+ producers with capacity outside the strait's geographic footprint — primarily Saudi Arabia via its East-West pipeline and the Sumed pipeline connecting the Red Sea to the Mediterranean — hold some strategic bypass capacity. However, that alternative routing is estimated to handle only a fraction of normal Hormuz transit volumes and cannot serve as a full substitute in a severe disruption scenario.
US shale producers face a paradoxical position in this environment. Higher oil prices above $80/bbl meaningfully improve their economics, but the same geopolitical instability that drives those prices also complicates US foreign policy positioning and increases the strategic cost of maintaining regional military presence. The relationship between oil prices and trade war dynamics further complicates the demand outlook, particularly given China's central role as a major consumer of Gulf crude.
FAQ: Oil Prices After US-Iran Strikes
What Caused Oil Prices to Jump 3% After the July 2026 US-Iran Strikes?
The price move reflected a combination of Iran expanding its strikes to include Gulf states Qatar and the UAE, new US counter-strikes near Bandar Abbas targeting drone infrastructure, and growing uncertainty about whether the fragile June interim agreement could survive the escalation. Al Jazeera's reporting confirmed that prices surged sharply as the initial wave of US strikes hit, reversing earlier declines to pre-war levels.
Why Did Oil Prices Retreat After the Initial Spike?
Analysts interpreted Iran's military response as deliberate and calibrated, falling short of the kind of maximalist escalation that would justify pricing in a complete supply rupture. Continued operation of Kharg Island and actual vessel transits through the strait on Sunday reinforced that physical supply remained partially intact.
Is the Strait of Hormuz Actually Closed?
As of July 13, 2026, the strait remained in contested operational status. Six vessels transited on Sunday according to Kpler shipping data — the lowest five-week count but not a total cessation. Iran declared closure following a vessel incident, while the US maintained it remained open to commercial traffic.
What Would a Full Hormuz Closure Do to Oil Prices?
A complete and sustained closure removing the estimated 17-21 million barrels per day normally transiting the strait would represent the largest single supply shock in modern energy history. Scenario models place Brent crude above $100/bbl in that case, with some projections extending to $130 or higher depending on the duration of disruption and the speed of strategic reserve deployment.
How Large Is the Existing Supply Shortfall From the Conflict?
The IEA's July 2026 monthly report confirmed global oil supply remains 9.4 million barrels per day below pre-war levels, despite a partial recovery of 4.1 million bpd following the June interim agreement.
What Is the Single Most Important Variable to Watch?
Whether physical supply from Kharg Island is directly disrupted and whether either party takes concrete steps to enforce their stated position on Strait transit rights. Declaratory positions matter far less to oil prices after US-Iran strikes than physical supply data.
Key Takeaways for Energy Market Observers
The current episode in US-Iran tensions delivers several clear lessons for those tracking oil price dynamics:
- The risk premium is real but bounded by market judgement that neither side currently seeks a total economic rupture through sustained strait closure.
- Physical supply data trumps political statements. Vessel transit counts, Kharg Island operational status, and IEA production figures carry more price weight than declarations from either Washington or Tehran.
- The 9.4 million bpd supply gap represents a structurally elevated price floor that did not exist in previous escalation cycles, meaning the downside to oil prices on de-escalation is less extreme than historical precedents might suggest.
- Volatility will persist until a durable political framework emerges, with each military exchange likely generating sharp intraday moves that gradually decay as markets recalibrate.
- The ceasefire framework remains the critical variable, and its survival or collapse in the coming days will likely determine whether Brent crude tests $65 or $100 before the end of the current conflict cycle.
Readers seeking additional context on global energy market dynamics and Middle East geopolitical risk can explore related reporting and analysis available through ET EnergyWorld at energy.economictimes.indiatimes.com, which covers ongoing developments in oil markets, supply chain disruptions, and energy policy across the region.
Want to Capitalise on the Market Volatility Created by Major Geopolitical Events?
Discovery Alert's proprietary Discovery IQ model delivers real-time alerts on significant ASX mineral discoveries, transforming complex market data into actionable investment insights — explore historic discoveries and their exceptional returns to understand the scale of opportunity available, then begin your 14-day free trial at Discovery Alert to position yourself ahead of the broader market.